Drug efficacy and patient experience are given high precedence during the development of injectable biotherapeutics. To improve drug activity and efficacy, biotherapeutics are delivered subcutaneously or intravenously in high concentrations, usually >100 mg/mL, because of their short half-life in plasma.
However, injecting low volume, high concentration of biotherapeutic formulations can prove difficult because of increased solution viscosities observed under these conditions. Therefore, in order to reduce the invasiveness of the treatment, low injection volumes are needed.
Automated Viscosity Measurements
Small molecule excipients such as arginine, dimethyl sulfoxide (DMSO) and hydrophobic salts tend to inhibit the formation of aggregate networks and are shown to reduce the viscosity of protein solutions that are highly concentrated. The capability to monitor formulations at an early stage of development against defined viscosity thresholds or for low viscosity attributes provides an attractive option to choose biotherapeutic candidates with better injectability and syringeability. This selection process can result in significant savings in both time and investment.
Malvern Panalytical’ Viscosizer 200 is a benchtop system that is capable of performing automated viscosity measurements on extremely low volume samples. In this article, the Viscosizer 200 is used to evaluate the effect of an excipient on the viscosity of protein formulations.
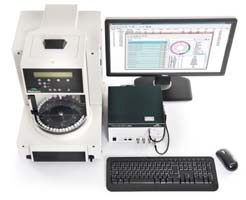
Figure 1. The Viscosizer 200 system.
Methodology
First, 400 mg/mL stock solutions of Bovine Serum Albumin (BSA) were prepared in two different buffers: 30 mM histidine, pH 5.3 and 30 mM histidine, 200 mM arginine.HCl, pH 5.3. From these solutions, a range of dilutions were prepared in the respective formulation buffers; using the E1% at 280 nm for BSA, the concentration of each new formulation was determined through UV spectroscopy. After this, no further treatment was made to the samples.
Then, aliquots of 100 µL were transferred into small vials and positioned into the autosampler carousel at 20°C. To measure the viscosity, samples were transferred into an uncoated fused silica microcapillary at 1000 mbar and the growth of the sample front between the two detection windows was checked at 214 nm. About 30 mM histidine buffer was used to wash the capillary, followed by rinsing it with pure water at 2000mbar between measurements.
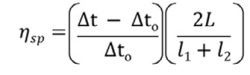
Here, Δt represents the relationship between the time taken for sample and ΔtO denotes the reference fronts to pass between the two detection windows, and ηsp indicates the sample specific viscosity. L is the total capillary length, and l1 and l2 are the lengths measured to the first and second detection windows in the capillary.
Malvern Panalytical’s Viscosizer 200 software was utilized for data acquisition, data processing and for all aspects of autosampler control. For each formulation, the ηsp was determined by utilizing the relationship provided in Equation 1. Frontal examinations of viscosity traces, as shown in figure 2, were utilized to acquire Δt and Δto for the sample and viscosity reference (pure water, 1.0021cP), respectively. Finally, the remaining parameters - L, l1 and l2 - are known from the dimensions of the capillary.
Results and Discusiion
A plot of the absolute viscosity as a function of BSA concentration is shown in figure 2. As expected, with increasing concentration for both formulations the absolute viscosities also increased. The green dotted/dashed line in figure 3 indicates a normal viscosity screening threshold for acceptable selection of candidates.
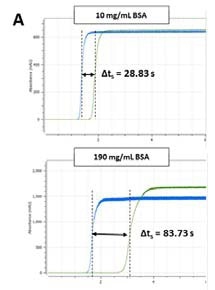
Figure 2. A screen capture of the Viscosizer 200 software showing the sample fronts at Windows 1 and 2, and corresponding Δt values for two different BSA formulations.
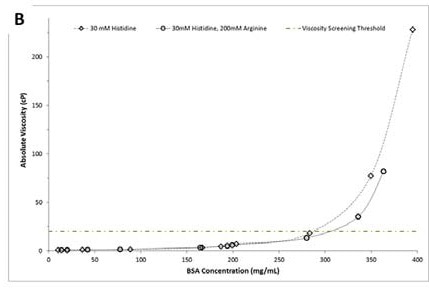
Figure 3. Plot of absolute viscosity as a function of BSA concentration (mg/mL): BSA formulations in 30 mM histidine, pH 5.3 (◊) and 30 mM histidine, 200 mM arginine, pH 5.3 (ο ).
When the absolute viscosities were compared, it did not reveal any significant difference between formulations of either buffer in concentrations less than 250 mg/mL. But in formulations with concentrations of over 250 mg/mL, the BSA formulations in 30 mM histidine had greater viscosity when compared to those containing arginine.
For instance, the BSA formulation containing arginine was about 30mg/mL more concentrated when compared to the BSA formulation in the histidine buffer alone. The viscosity-lowering ability of arginine is in line with the studies performed on monoclonal antibodies. This data can be utilized to choose formulation candidates based on low viscosity aspects. In the above example, four formulations fall over the viscosity screening threshold of 20cP and as a result would be excluded from additional development.
Conclusion
The use of biological material in medicines presents an extra level of difficulty during the process of drug development. The pharmaceutical industry is often faced with the challenge of producing low viscosity, high concentration biotherapeutic formulations.
The Viscosizer 200 provides a suitable solution as it is capable of distinguishing the differences between the viscosities of different protein formulations. This technology could also be used as a tool for screening suitable formulation candidates against a defined viscosity threshold. This would considerably help in excluding potentially problematic candidate molecules at an early stage of development, thus providing ashorter and more cost-effective route to bring biotherapeutics to market.
About Malvern Panalytical
Malvern Panalytical provides the materials and biophysical characterization technology and expertise that enables scientists and engineers to investigate, understand and control the properties of dispersed systems.
These systems range from proteins and polymers in solution, particle and nanoparticle suspensions and emulsions, through to sprays and aerosols, industrial bulk powders and high concentration slurries. Used at all stages of research, development and manufacturing, Malvern Panalytical’s instruments provide critical information that helps accelerate research and product development, enhance and maintain product quality and optimize process efficiency.

This information has been sourced, reviewed and adapted from materials provided by Malvern Panalytical.
For more information on this source, please visit Malvern Panalytical.