Like infrared (IR) spectroscopy, Raman spectroscopy is a type of vibrational spectroscopy. These similar methods have some differing qualities, as IR bands emerge due to alterations in the dipole moment of a molecule and Raman bands emerge due to alterations in the polarizability of a molecule.
Numerous transitions which are prohibited in IR are not in Raman, and therefore these techniques are often used in combination. This article concisely describes the Raman effect, outlining the benefits of Raman spectroscopy, and the key components of Raman apparatus.
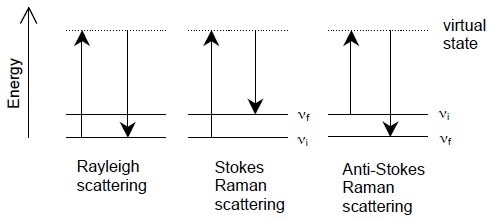
Figure 1. Energy-level diagrams of Rayleigh scattering, Stokes Raman scattering, and anti-Stokes Raman scattering.
The Raman Effect
A ray of light is initially beamed onto a sample, which leads to absorption and scattering of photons. Most of these dispersed photons have identical wavelengths as the original photons and are termed “Rayleigh scatter”.
However, very small amount (~1/107) of the distributed radiation is moved to an alternate wavelength, termed “Raman scatter”. The majority of these Raman scattered photons are moved to greater wavelengths, which is called Stokes shift. Alternately, a minute number are moved to inferior wavelengths, which is called anti-Stokes shift.
In all three scenarios, the original photon leads to excitation of electrons, which move into greater energy positions, before they fall back to a lower level and radiate a dispersed photon. If the electron falls back to its original level, it leads to Rayleigh scattering. However, if the electron falls back to a different level, then Raman scattering occurs.
When the resultant energy position is lower than the original level, this is termed Stokes Raman scattering. This scattering process is much more common than anti-Stokes scattering. Electrons within normal temperature ranges are likely to be in their minimal energy state, conforming to Boltzmann distribution, explaining why anti-stokes scattering is not as common.
As previously explained, Raman is a type of vibrational spectroscopy. This suggests that the alterations within energy emerge due to vibrations of molecules. These vibrations involve detectable functional groups, and so plotting energy transitions upon a spectrum allows molecular identification.
The Raman Spectrum
Plotting the magnitude of Raman scattered radiation as a function of the frequency change from the original radiation (frequently in units of wavenumbers, cm–1) produces a Raman spectrum. This change is termed the Raman shift. As it is a difference value, this change is not related to the frequency of the original radiation. Usually, the only regions which are used are the Stokes region. Even though the anti-Stokes spectrum has exactly the same pattern, its intensity is much lower.
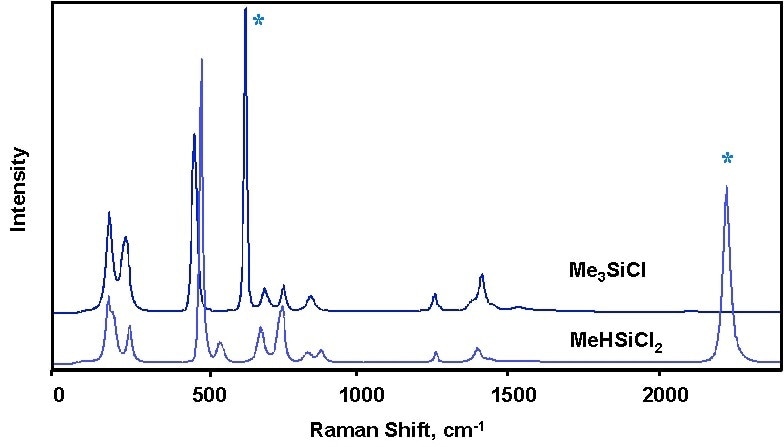
Figure 2. Raman spectra of two methyl chlorosilanes illustrating how the two species can be distinguished by Raman spectroscopy. Characteristic Raman bands of each species are marked with an asterisk (*).
Advantages of Raman Spectroscopy
This form of spectroscopy is very effective for chemical examination due to numerous properties, such as; high specificity, aqueous system compatibility, lack of particular sample preparation, and short timescale.
Specificity: Since Raman measures integral vibrations, the produced Raman bands have an exceptional signal-to-noise ratio and do not overlap. Therefore, a Raman spectrum can be utilized in many different applications, from creating sample “fingerprints”, to creating complicated chemical models of reaction mechanisms.
Analysis of aqueous systems: The strength and complexity of the IR water spectrum means that IR is inadequate for applications within the analysis of aqueous solutions, as it results in large interference by the water bands. Comparatively, the Raman spectrum of water is small and not obtrusive, meaning that a good spectra can be collected from species within aqueous substances.
No sample preparation: Most chemical analysis techniques require very particular sample preparation. However, Raman does not need this and, in fact, does not even require contact with the sample. Instead, Raman lights up the sample using a laser and measures the scattered photons. This therefore means that Raman spectroscopy is exceedingly non-destructive.
Short timescale: A Raman spectrum can be amassed in a few seconds, and therefore Raman can be utilized to measure chemical reactions in “real time”.
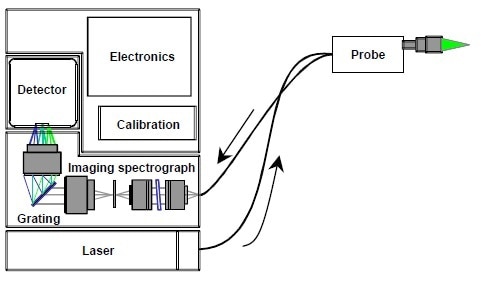
Figure 3. Schematic diagram of a RamanRxn1TM Raman spectrometer from Kaiser Optical Systems, Inc.
Raman Instrumentation
Normal Raman spectrometers are composed of three integral parts: the laser, the measurement device, and the spectrograph.
Laser: The ability to produce a beam of monochromatic light makes a laser the ideal instrument for exciting the Raman spectra. Sufficient intensity is given which produces an effective concentration of Raman scatter and permits a clean spectrum, which has no extraneous bands. The chosen lasers display excellent wavelength stability and minimal background emission.
Probe: The probe collects the dispersed photons, whilst filtering out the Rayleigh scatter and additional background signals from fiber optic cables. It then transmits this information to the spectrograph. Numerous probes also target and transfer the incident laser beam.
Spectrograph: Raman scattered photons initially enter the spectrograph and are transmitted through a grating, which acts to separate them by wavelength, before they are carried to a detector. This measures the intensity of the Raman signal at each wavelength, which is then plotted as the Raman spectrum.
References:
- Analytical Applications of Raman Spectroscopy; Pelletier, M.J., Ed.; Blackwell: Oxford, 1999.
- Handbook of Raman Spectroscopy: From the Research Laboratory to the Process Line; Lewis, I.R., Edwards, H.G.M., Eds.; Marcel Dekker: New York, 2001

This information has been sourced, reviewed and adapted from materials provided by Kaiser Optical Systems.
For more information on this source, please visit Kaiser Optical Systems.