Despite being considered low-tech commodities, tires are actually highly engineered structural composites.
Tires frequently include up to 20 different rubber compounds featuring several types of microstructures, specifically designed to provide varying levels of grip and traction. Fillers are also added to the primary polymer matrix to reinforce the rubber.
An optimal, homogenous dispersion of these fillers is a key factor in maintaining higher material quality. Lower or decreased material quality is a common cause of tire failures
It is necessary to employ analytical techniques such as SEM-EDS to understand the underlying cause of a failure, but the obtainable material contrast from a backscattered electron image is not sufficient to distinguish between the diverse array of materials commonly found in tires.
This article explores the live quantitative elemental analysis potential of Axia ChemiSEM - an efficient and straightforward means of characterizing this array of fillers, despite their similar compositional contrast.
Tires are designed to offer consistently high performance and enhanced safety properties for thousands of kilometers of use, all while operating under a wide range of conditions.
Tread (the section of the tire in contact with the road) detachment and tire aging are listed among the most common tire failures discovered during routine failure analysis.
The causes of these failures are typically related to material or manufacturing defects – either directly or indirectly. Rubber mixtures tend to naturally harden over time, with this aging causing reduced elasticity of the rubber parts, even when tires are not in use.
Natural and synthetic rubbers are the primary raw materials employed in tire manufacturing. To ensure the proper strength, resilience and wear-resistance properties, rubber products are modified via the addition of reinforcing fillers to each rubber compound.
Fillers were initially introduced to reduce the final cost of the product, but rubber manufacturing technology has recently seen a growing amount of research in selective fillers due to their capacity to enhance different composite characteristics, depending on their specific chemical composition.1
Specific fillers can enhance a product’s durability, reduce its cost and improve its processability throughout the manufacturing process.
Reinforcing fillers typically make up more than 40% of the entire tire compound and are central to tire’s elastic efficiency and minimizing the aging, which may lead to subsequent failure.
The parameter responsible for performance is filler dispersion in the rubber matrix. Thus, improving filler dispersion will lead to improved polymer-filler interaction and a subsequent improvement in both the rolling resistance of the tire and the elastic behavior of the material.
Methods
The solutions of choice for the characterization of different additives and their dispersion in a polymer matrix include scanning electron microscopy (SEM) with backscattered electron imaging (BSE) and energy dispersive X-ray spectroscopy (EDS).
BSE images are generally regarded as the most straightforward means of acquiring compositional information.
This is due to the contrast seen with BSE images being linked to the variation in atomic number – a key factor in enabling easy differentiation of the rubber matrix (low atomic number) from the inorganic particles (high atomic number) typically used as fillers.
The diverse array of materials employed in the contemporary tire industry necessitate the use of EDS analysis to discriminate between the different elements.
Conventional EDS characterization is expensive, complex and often slow, however. This method requires extensive experience and knowledge to correctly set up the parameters and system for data acquisition, making it inefficient and impractical for many users.
This article outlines the use of the Axia ChemiSEM in the characterization of different fillers in a tire cross section.
The Axia ChemiSEM is an entirely new platform designed to provide an extremely efficient SEM-EDS user experience. Its primary feature – live quantitative elemental mapping – effectively resolves the limitations of conventional EDS previously discussed.
Analysis
A traditional failure analysis workflow will use microscopic analysis to determine the underlying cause of a failure, first employing low magnification analysis to characterize the specimen and identify potential regions of interest.
A large field-of-view SEM image was acquired using Axia ChemiSEM’s navigation montage of the prepared cross section for this purpose. Navigation montage is a built-in function of the SEM, making navigation on large samples quick and easy.
This novel feature can be used to automatically collect a number of neighboring images, rapidly generating a large-scale overview of the sample.1
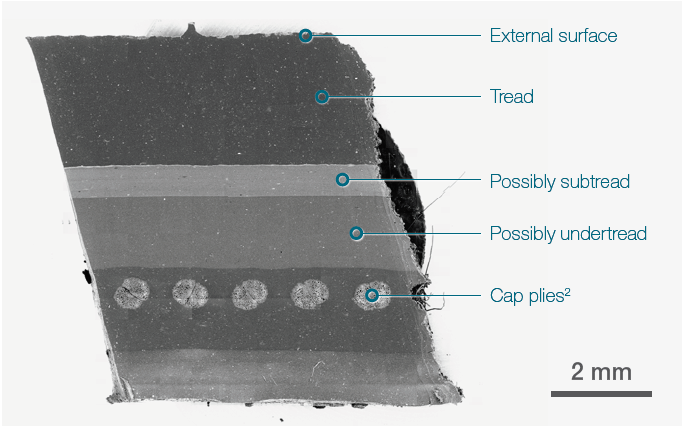
Figure 1. 19x19 tiles montage. Tot acquisition time ≈ 15 mins. Acc voltage 20 keV, beam current 0.94 nA, Low vacuum (30 Pa). Image Credit: Thermo Fisher Scientific – Electron Microscopy Solutions
Higher levels of magnification are necessary to evaluate key microfeatures, for example, the dispersion of the various fillers and their distribution over different layers.
The most commonly used fillers in rubber technology are carbon black and zinc oxide.
Carbon black is perhaps the most long-serving and popular reinforcing filler, but this is no longer the preferred solution due to its adverse environmental impact and tendency to agglomerate within the rubber matrix.
Zinc oxide is the second most abundant material in the tread rubber matrix. This offers a range of advantages when employed as an additive in rubber compounds.
It is a critical ingredient - along with sulfur - because it promotes the process of vulcanization (tire curing reduces the time while impacting the length and number of crosslinks in the rubber matrix). Its conductivity also helps remove some of the heat generated during tire motion.
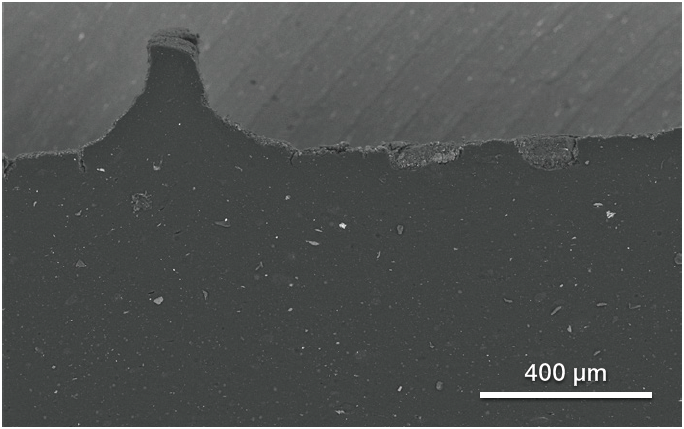
Figure 2. Upper surface (tread). Acc voltage 20 keV, beam current 0.48 nA. Image Credit: Thermo Fisher Scientific – Electron Microscopy Solutions
In the example presented here, an initial characterization of the fillers and additives was performed by screening some of these in the tire’s upper layer (Figure 2). Additional analysis was also performed on some of the visible objects.
While working in a conventional SEM imaging session, Axia ChemiSEM provides a rapid, comprehensive understanding of the objects’ composition. It is also able to seamlessly deliver all required chemical information without the need to adjust acquisition conditions or change methodology.
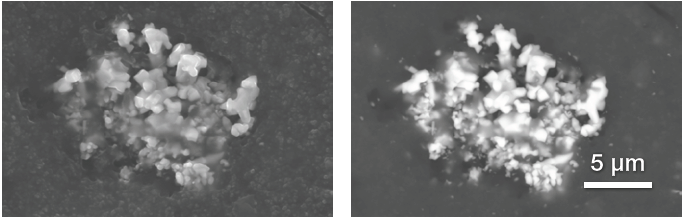
Figure 3. Secondary electrons and backscattered electrons image of a Zn oxide particles cluster. Acc voltage 20 keV, beam current 0.48 nA, acquisition time 40 s. Image Credit: Thermo Fisher Scientific – Electron Microscopy Solutions
Figure 3 displays a cluster of zinc oxide particles. The intuitive graphical user interface for Axia ChemiSEM allows the operator to simultaneously acquire different signals to increase the amount of information available.
A secondary electron image provides topographical information and confirms that the particles are embedded (left image), while a backscattered electron image confirms that the particles have a higher atomic number than the rubber compound surrounding them (right image).
The live quantitative mapping provided by Axia ChemiSEM is fully integrated within the SEM user interface. This key feature allows X-rays to be continuously acquired and processed, even throughout live imaging or acquisition.
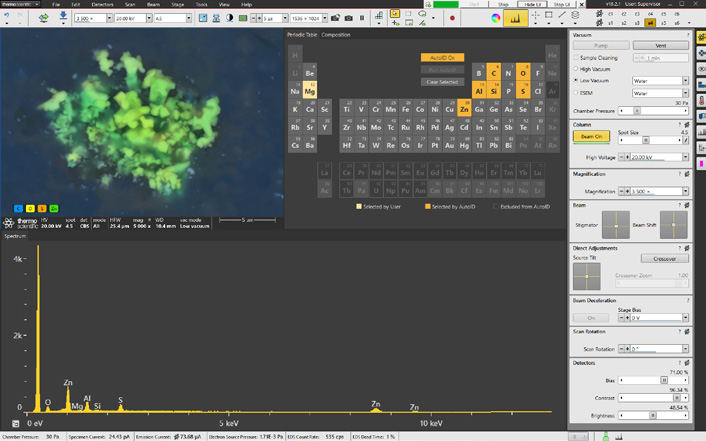
Figure 4. Axia ChemiSEM user interface with integrated live quantitative elemental mapping. It shows the quantitative elemental image during its acquisition, the spectrum of the area acquired, and the periodic table to select/unselect elements of interest. Image Credit: Thermo Fisher Scientific – Electron Microscopy Solutions
A simple click is all that is needed to display the quantitative elemental maps (Figure 4).
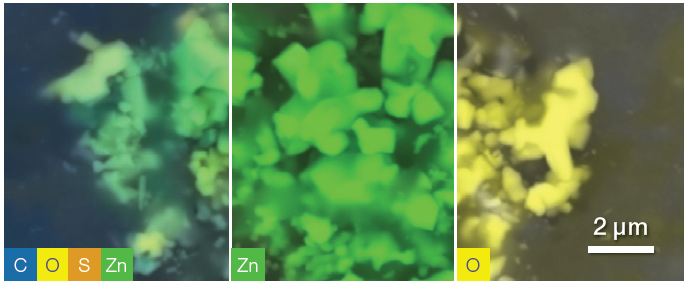
Figure 5. Quantitative elemental images, showing from left to right respectively all elements shown, zinc distribution and oxygen distribution. Some disuniformities in the distribution may be due to shadowing. Image Credit: Thermo Fisher Scientific – Electron Microscopy Solutions
Within the same acquisition (40 seconds for this region of interest), specific elements can be selected or deselected to better highlight their distribution (Figure 5), locating and targeting different filler compositions for more detailed analyses.
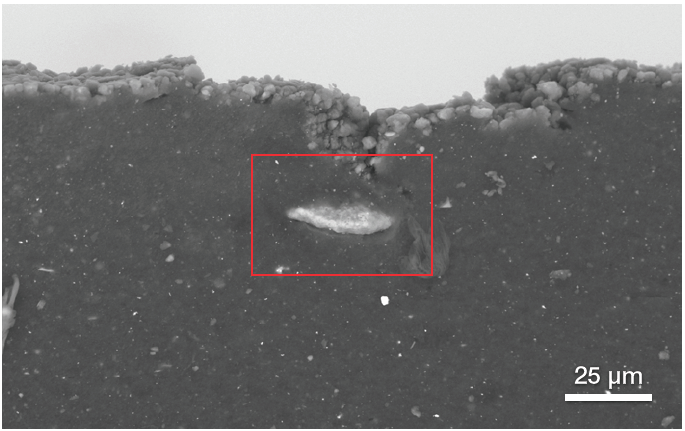
Figure 6. Backscattered electron image showing the position of another type of filler. Image Credit: Thermo Fisher Scientific – Electron Microscopy Solutions
Figure 6 confirms the presence of another abundant filler in the tread (upper part of the tire cross section), very close to the external surface of the tire.
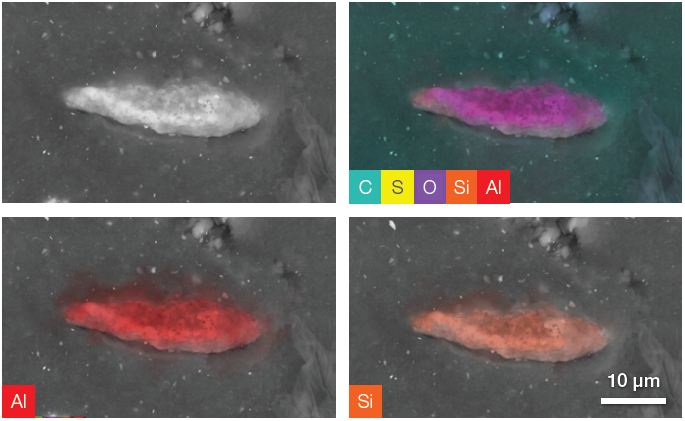
Figure 7. Backscattered electron image and a complete set of quantitative elemental images showing, in the upper right image, all the elements present in the ROI (including C, O and S). The last two images show Al and Si distribution on the particle. Acc voltage 20 keV, beam current 0.94 nA, acquisition time ≈ 100 s. To be noted, the elemental distribution and the related set of images have been obtained using only one image acquisition. Image Credit: Thermo Fisher Scientific – Electron Microscopy Solutions
Elemental distributions and quantitative information can be obtained by acquiring quantitative elemental images and performing a point analysis on the particle.
| Element |
Atomic % |
Atomic % error |
| C |
28.6 |
0.2 |
| O |
52.0 |
0.2 |
| Al |
12.4 |
0.0 |
| Si |
6.8 |
0.0 |
| S |
0.2 |
0.0 |
Figure 8. Point analysis acquired for 60 s. Average count rate ≈ 3000 cps. Image Credit: Thermo Fisher Scientific – Electron Microscopy Solutions
Point analysis of the example presented here (Figure 8) indicated that the sample’s Al content is double its Si content. This information - combined with the information provided by the quantitative elemental images - suggests that this particle is one of the aluminosilicate fillers (Al2SiO5).
These fillers are synthetic additives frequently used in tire treads to increase compound strength and enhance the tire’s mechanical properties. A significant amount of oxygen and a comparatively high percentage of carbon can be assigned to the signal generated by the rubber below the particle.
While fillers are typically used to reinforce and strengthen the rubber structure, some are classified as semi-reinforcing or non-reinforcing fillers2 because they have not been designed to enhance mechanical properties.
A range of these ‘non-black fillers’ was found in the rubber components, including calcium carbonate, clay, talc and precipitated silica.
The characterizations presented here provide examples of calcium carbonate and talc, respectively. Their chemical composition and nature have been assigned to these specific materials via the fast and accurate ChemiSEM technology.
The images below were acquired in the rubber layers underneath the tread layer, with the different compounds observed showing a significant amount of the filler calcium carbonate.
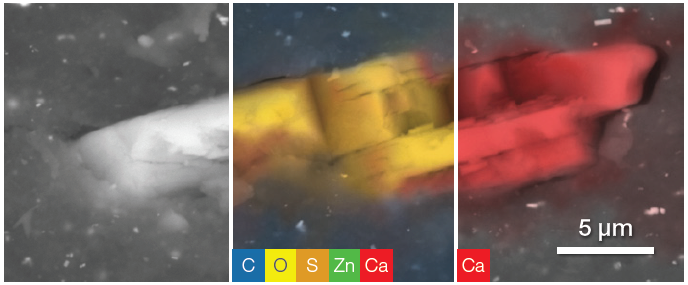
Figure 9. Layered filler. From left, backscattered electron image, ChemiSEM image with all the present elements selected, quantitative elemental image showing Ca distribution over the particle. Acc voltage 20 keV, beam current 0.48 nA, acquisition time 40 s. Image Credit: Thermo Fisher Scientific – Electron Microscopy Solutions
A 30-second point analysis was performed in the center of the particle, revealing an equal amount of Ca and C and three times the amount of oxygen.
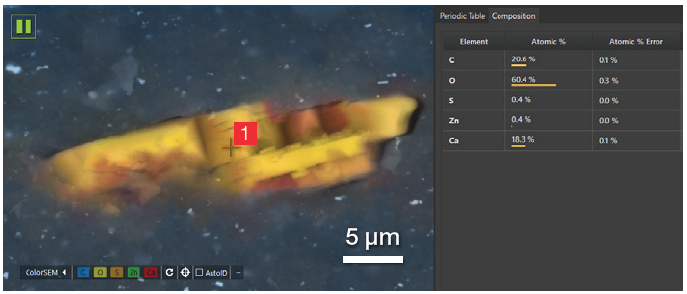
Figure 10. Partial view of the user interface showing the point where the point analysis has been acquired and the related quantification. Acc voltage 20 keV, beam current 0.48 nA, 5000 cps, acquisition time 30 s. Image Credit: Thermo Fisher Scientific – Electron Microscopy Solutions
This confirmed that it was correct to assign this to calcium carbonate (CaCO3) - an inorganic compound classified as a semi-reinforcing filler due to its minimal capacity to enhance the whole rubber compound’s mechanical properties.
CaCO3 increases a product’s volume, reducing the required amount of more expensive natural rubber.
It also improves characteristics such as final material hardness, abrasion and heat resistance. These factors – along with its cost-effective nature – have seen CaCO3 as a long-serving, popular material in plastics and rubber manufacturing.
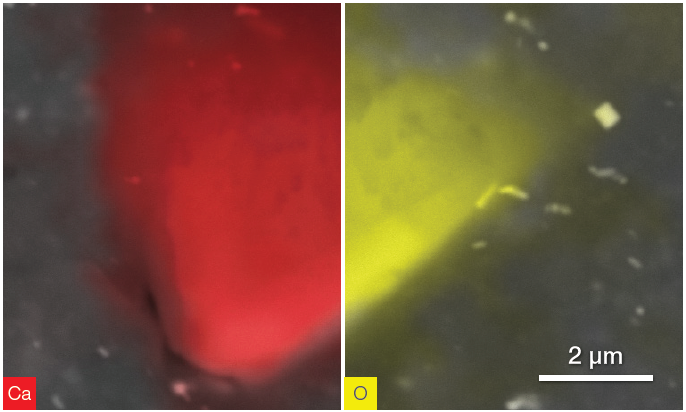
Figure 11. CaCO3 particle. Ca distribution (left) and O distribution (right). Acquisition time 40 s. Image Credit: Thermo Fisher Scientific – Electron Microscopy Solutions
Figure 11 provides an example of the investigation of other particles with similar compositions but different shapes.
Hydrous magnesium silicate is typically known as the naturally occurring mineral talc (Mg3Si4O10(OH)2). This type of filler has been used in the rubber industry for more than 40 years - not in tread rubber compounds, but in the tire’s inner layers where it provides higher tear resistance.
Talc is, therefore, an essential factor in a tire’s overall toughness and durability.
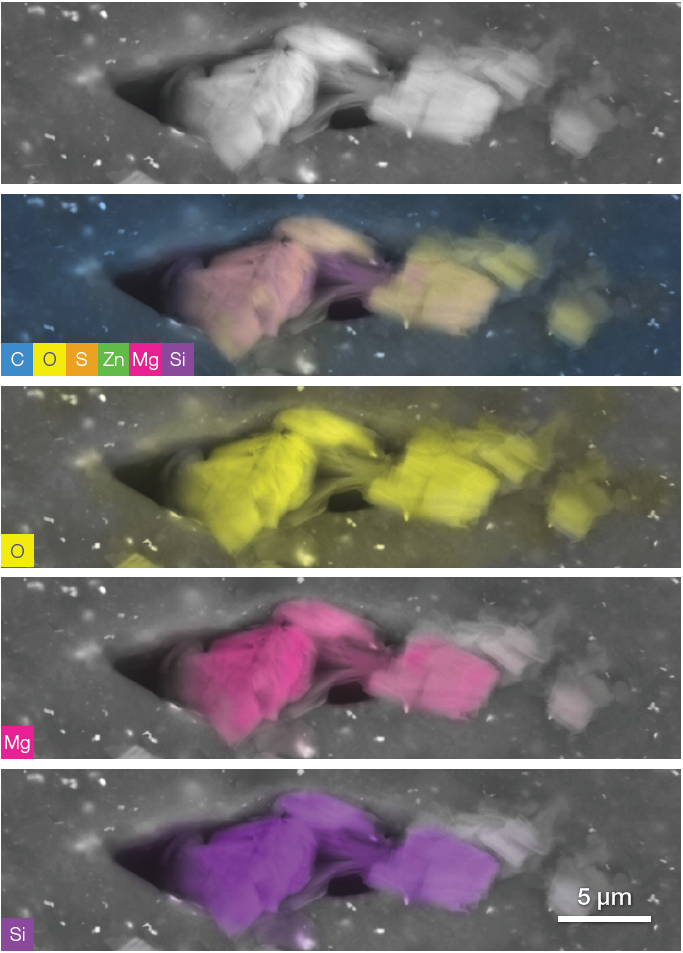
Figure 12. Oxygen, magnesium and silicon rich fillers. The set of images has been acquired in one time by simply saving the conventional greyscale image and then turning on the live quantitative elemental analysis and selecting or unselecting the different elements in order to highlight their distribution. Image Credit: Thermo Fisher Scientific – Electron Microscopy Solutions
Figure 12 displays a complete set of quantitative elemental maps, highlighting one of many clustered additives found in the subtread and undertread.
The morphology of the imaged filler highlights these particles’ plate-like appearance, while a combination of crystal habit information and quantitative elemental information delivered on the fly during image acquisition allows these to be confidently classified as talc.
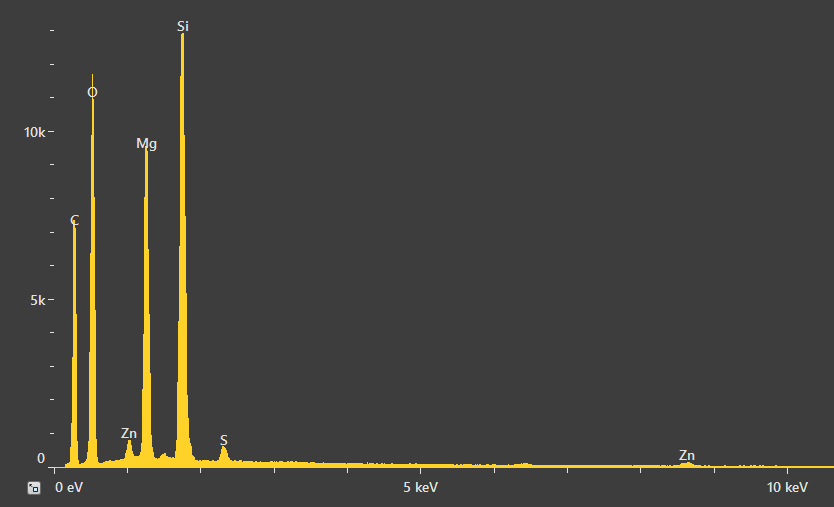
A point analysis was also acquired to gain an improved understanding of the quantities involved. The spectrum shown in Figure 13 displays small peaks for Zn and S, stemming from either the rubber matrix or the relatively high amount of zinc oxide particles surrounding the RoI.
A high acceleration voltage – for example, 20 keV – generates an interaction volume that also includes a signal from the area surrounding the point of interest.
Quantification verified the Mg:Si ratio as being around 3:4 – the same ratio as is in talc. Oxygen was found to be slightly higher, which is likely due to the presence of an oxygen signal from the rubber.
| Element |
Atomic % |
Atomic % error |
| C |
38.4 |
0.2 |
| O |
44.5 |
0.2 |
| S |
0.3 |
0.0 |
| Zn |
0.3 |
0.0 |
| Mg |
7.5 |
0.0 |
| Si |
9.0 |
0.0 |
Figure 13. Spectrum resulting from the point analysis of the talc particle and related quantification. Acc voltage 20 keV, beam current 0.48 nA, acquisition time 60 s. Image Credit: Thermo Fisher Scientific – Electron Microscopy Solutions
Conclusions
Tire failure is typically associated with inhomogeneous dispersion of different fillers. SEM, along with the contribution of EDS, is a vital tool in better understanding the underlying cause of failure.
This article demonstrated the challenging task of adequately identifying both the distribution and identity of filler materials in tires, highlighting how this task is made more efficient via live quantitative imaging and analysis with the Axia ChemiSEM.
Filler materials in the examples presented here were correctly identified, while their distribution was easily observed thanks to the sample centricity of the Axia ChemiSEM’s analytical workflow.
References
- Brewer HK, C. S. (2006). The Pneumatic Tire. U.S.A: U.S. Department of Transportation, National Highway Traffic Safety Administration.
- Roy K, D. S. (2019). A critical review on the utilization of various reinforcement modifiers in filled rubber composites. Journal of Elastomers & Plastics, Vol. 52(2), 167–193. doi:10.1177/0095244319835869

This information has been sourced, reviewed and adapted from materials provided by Thermo Fisher Scientific – Electron Microscopy Solutions.
For more information on this source, please visit Thermo Fisher Scientific – Electron Microscopy Solutions.