One of the most widely used industrial polymers is polybutadienes, representing more than 2 billion pounds of plastics and more than 4 billion pounds of rubber annually. The superior resiliency of polybutadienes makes them suitable for high-stress applications, including the cores of golf balls and the sidewalls and treads of tires.
Polymerization of Butadiene
Polymerization of the 1,3-butadiene monomer (Figure 1) follows two different reactions: 1,2- and 1,4-polymerization. Most systems undergo both polymerization reactions, yielding products consisting of a mixture of both structures. 1,2-polymerization (Figure 2) is less significant when compared to 1,4-polymerization, which yields products such as 1,4-cisand 1,4-trans-polybutadiene (Figure 3).
The cis isomer is a superior elastomer, exhibiting lower crystallinity Tm and Tg when compared to the trans isomer. High-cis polybutadiene shows outstanding cut growth resistance, a significant property especially for tires.
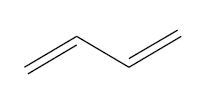
Figure 1. 1,3-butadiene monomer
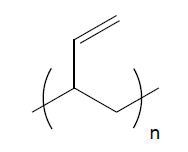
Figure 2. 1,2-vinyl
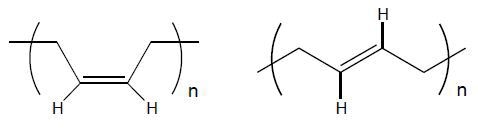
Figure 3. 1,4-cis and 1,4-trans units
Spectroscopy of Polybutadienes
The microstructure of polybutadienes can be explored using spectroscopic techniques, including IR, 1H and 13C Nuclear Magnetic Resonance (NMR), and Raman spectroscopy. The comparison of these spectroscopic techniques revealed the supremacy of 13C NMR and Raman spectroscopy, which produce accurate and reproducible results.
NMR Spectroscopy
Both 1H and 13C NMR techniques are useful in the analysis of polybutadienes. However, resolving 1,4-cis and 1,4-trans olefinic proton peaks appeared near 5.4ppm is possible only using high frequencies in the case of 1H NMR. This region helps determining the 1,4 and 1,2-vinyl content through comparison with the 1,2-vinyl peaks near 4.9ppm. Conversely, 13C NMR technique can differentiate 1,2-vinyl, 1,4-cis, and 1,4-trans units, but needs roughly 12 hours for the NMR data. This makes the 13C NMR technique unsuitable for quality control at the process line.
IR Spectroscopy
Although IR spectroscopy is useful for monitoring polymerization reactions, it is not ideal for determination of the microstructure of polybutadienes. It is not possible to observe the 1,4-trans ν(C=C) vibration in the IR region as it is symmetry forbidden due to the presence of center of symmetry. Other criteria have to be used for the polybutadiene microstructure determination.
IR can be used to detect each of the three micro-structural units’ δ(C–H) bending modes, but interpreting the data is a challenging task owing to the fact that the spectral bands are from all the three microstructures as well as from other structures. There are different techniques available for IR analysis of butadiene, but the results vary between methods. In addition, the IR method results often disagree with the results acquired by NMR and Raman spectroscopy.
Raman Spectroscopy
Since the (C=C) bond stretching of 1,4-cis, 1,4-trans, and 1,2-vinyl units exhibit a strong Raman signal at 1664, 1650, 1639cm-1, respectively, Raman spectroscopy is ideally suited for polybutadiene characterization. Since Raman scattering intensity varies in proportion to the concentration of samples, a polybutadiene sample can be quantitatively analyzed using the intensities of these Raman bands. In addition, since overlapping of the bands is common, curve-fitting techniques and multivariate analyses are often applied for accurate measurements of band areas.
Kaiser Optical Systems’ RamanRxn1™ analyzer was used to acquire the Raman spectrum using 785-nm excitation and three averaged 5-second acquisitions. The polybutadiene microstructure can be identified using the Raman spectral region as shown in Figure 4. The original Raman data are represented by the red curve, whereas the curve-fitted Raman data are presented by the blue curves. The green curve indicates the baseline. The GRAMS/32 AI™ software package was used to perform curve fitting. A Gaussian band shape was assumed for the curve-fitting algorithm. The Raman data is reproducible to within ±1%. Moreover, sampling methods can be used with in situ process monitoring.
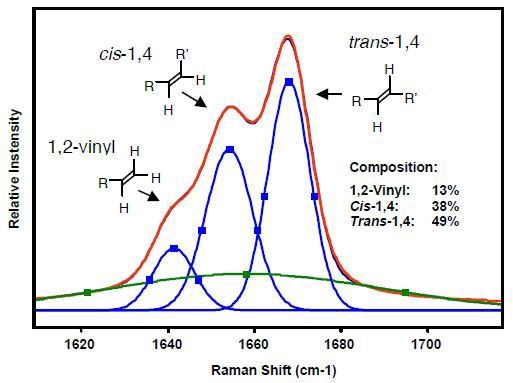
Figure 4. Raman spectral region used to identify microstructure of polybutadienes.
Conclusion
The results clearly demonstrate the supremacy of Raman spectroscopy over other techniques for the polybutadiene microstructure determination, for process applications in particular. The Raman analyzer can resolve all three major types of polybutadienes, yielding information-rich, reproducible quantitative data within minutes.
About Kaiser Optical Systems
Kaiser Optical Systems, Inc. is a world leader in spectrographic instrumentation and applied holographic technology. Principal products include Raman sensors and instrumentation, advanced holographic components for spectroscopy, and astronomy and ultra-fast sciences. Principal offices and the manufacturing facility are located in Ann Arbor, Michigan.
Their products and services are deployed throughout the world in such diverse applications as pharmaceutical and chemical manufacturing, nanotechnology, telecommunications, education, forensic science, deep-sea exploration, and astronomy. From particles smaller than a human hair to objects as large as planets, their products are providing their customers unique insights into both today’s as well as “age-old” questions.
Kaiser was founded in 1979 to meet the need for diffractive or holographic optics for the avionics market. Kaiser entered the spectroscopy market in 1990 with the introduction of the holographic notch filter. In 1993 Kaiser released their first Raman analyzer, the HoloProbe. In 2013, the company became part of the Endress+Hauser Group.
To better serve the European community, Kaiser opened a new subsidiary in Europe in 1998. Kaiser Optical Systems SARL is located in Lyon, France. Kaiser SARL supervises their distributor network within Europe.

This information has been sourced, reviewed and adapted from materials provided by Kaiser Optical Systems.
For more information on this source, please visit Kaiser Optical Systems.