For the past several years, vibrational spectroscopy has been utilized for polymer analysis, and IR spectroscopy is the traditionally preferred method. Nevertheless, recent technological developments have made Raman spectroscopy more user friendly and economical when compared to the past.
Advantages of Raman Spectroscopy
IR and Raman spectroscopy have different detection mechanism for vibrations. Vibrations modifying the dipole moment of a molecule are detected by IR spectroscopy, whereas vibrations modifying the polarizability of a molecule are detected by Raman spectroscopy. Some vibrations can modify both polarizability and dipole moment, and are determined by both IR and Raman spectroscopy.
Vibrations of the backbone of long polymer chains cause no change in the dipole moment due to cancelling out of adjacent dipoles by repeating units, but significant changes in polarizability. Polymer backbone structure and conformation can be analyzed using Raman spectroscopy and side chains can be analyzed using IR spectroscopy. So both techniques complement each other.
Dealing highly colored samples with fluorescent impurities was previously a challenge to Raman spectroscopy due to fluorescence interference. However, fluorescence can be avoided in most samples using deep-red and near- infrared (NIR) excitations. Additionally, the developments in the polymer production processes have made potentially disruptive fluorescent impurities and non-fluorescent materials less prevalent now than in the past. It is easier to integrate Raman spectroscopy as in-line or on-line process monitoring tool. The non-invasive monitoring of a moving polymer film using a Raman probe is shown in Figure 1.
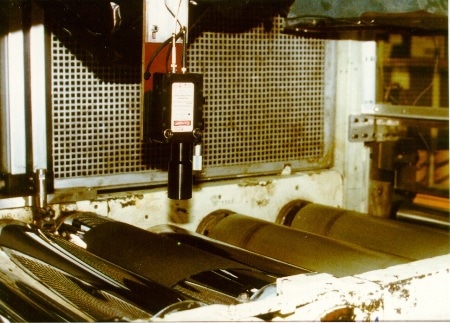
Figure 1. Monitoring a moving polymer film line.
There are different methods available for polymer analysis using Raman spectroscopy, of which using the Raman spectrum as a “fingerprint” is one simple method to qualitatively determine polymeric materials. Kaiser Optical Systems’ HoloMap™ and HoloWell™ software packages are used for more rigorous analysis, enabling data analysis by chemometric techniques such as principal components analysis (PCA) as well as univariate and multivariate calibrations.
Polymer Analysis Using Raman Spectroscopy
The following examples illustrate the ability of Raman spectroscopy for polymer analysis in a lab environment or on a process line.
Extrusion
Since Raman spectroscopy employs visible and NIR excitations, it is possible to remotely place the base unit consisting of the optical components and the PC used for instrument control from the probe used for interfacing with the sample. The Raman data collected from polymer blends during extrusion is illustrated in Figure 2. Here, a 100-m optical fiber was used to couple a 532- nm probe to the base unit. The area ratios of the spectral bands of components provide information about their proportion.
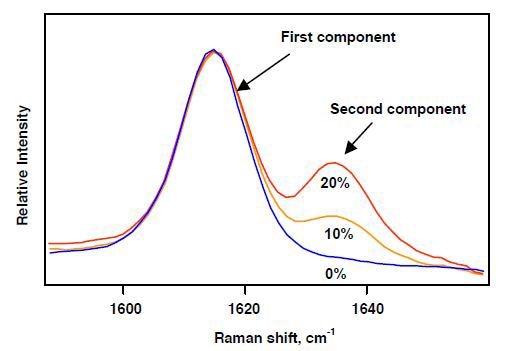
Figure 2. On-line Raman spectroscopy of extruded polymer blends.
Polyethylene Density
Polyethylene (PE) is a key polymer available in two general forms, namely low-density polyethylene (LDPE) and high-density polyethylene (HDPE). PE with a density range of 0.920-0.935g/cm3 is defined as LDPE, while PE with a density range of 0.955-0.970g/cm3 is defined as HDPE. Less creep, less gas permeability and high strength are the characteristics of HDPE, whereas LDPE is more translucent and flexible. Raman spectra of polyethylene samples with densities of 0.882, 0.910, 0.960g/cm3 are presented in Figure 3. A calibration model can be created using curvefitting techniques to correlate a PE sample’s Raman spectrum to its density.
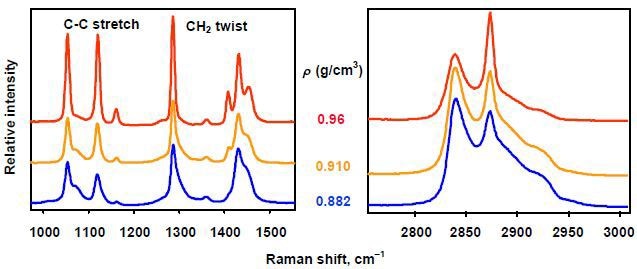
Figure 3. Raman spectra comparing polyethylene samples of various densities.
Polybutadiene Microstructure
Polybutadiene characterization can be effectively performed using Raman spectroscopy due to its ability to differentiate all fundamental structural units through the ν(C=C) bond stretching of 1,4-cis, 1,4-trans, and 1,2-vinyl units, which provide Raman bands at 1639, 1650, and 1664 cm-1, respectively (Figure 4).
Additional, polybutadiene samples can be quantitative analyzed using the Raman band intensities as they vary in proportion to the concentration of the samples. It is necessary to use curve-fitting techniques due to the partial overlapping of the Raman bands. The resulting Raman data is reproducible to within ±1%.
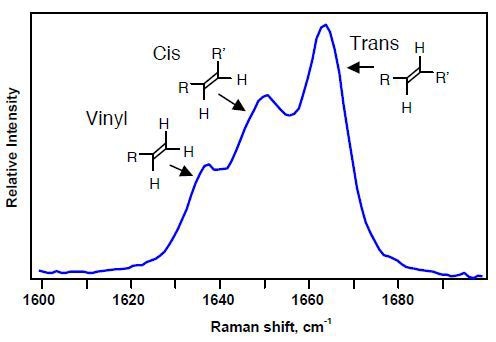
Figure 4. Raman spectral region used to identify microstructure of polybutadienes.
Copolymers
The availability of different grades of copolymers at different prices based on the distribution of monomers makes monitoring of their composition necessary. The differentiation of the ethylene vinyl acetate copolymers based on the vinyl acetate fraction using the Raman spectra is illustrated in Figure 5.
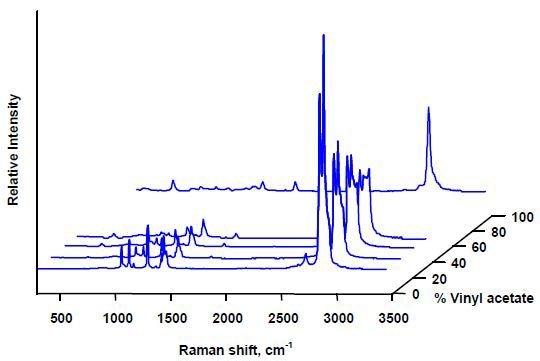
Figure 5. Raman spectra of ethylene vinyl acetate copolymers.
Conclusion
From the aforementioned examples, it is evident that Raman spectroscopy is a powerful technique for polymer analysis both in laboratory settings and on the process line.
About Kaiser Optical Systems
Kaiser Optical Systems, Inc. is a world leader in spectrographic instrumentation and applied holographic technology. Principal products include Raman sensors and instrumentation, advanced holographic components for spectroscopy, and astronomy and ultra-fast sciences. Principal offices and the manufacturing facility are located in Ann Arbor, Michigan.
Their products and services are deployed throughout the world in such diverse applications as pharmaceutical and chemical manufacturing, nanotechnology, telecommunications, education, forensic science, deep-sea exploration, and astronomy. From particles smaller than a human hair to objects as large as planets, their products are providing their customers unique insights into both today’s as well as “age-old” questions.
Kaiser was founded in 1979 to meet the need for diffractive or holographic optics for the avionics market. Kaiser entered the spectroscopy market in 1990 with the introduction of the holographic notch filter. In 1993 Kaiser released their first Raman analyzer, the HoloProbe. In 2013, the company became part of the Endress+Hauser Group.
To better serve the European community, Kaiser opened a new subsidiary in Europe in 1998. Kaiser Optical Systems SARL is located in Lyon, France. Kaiser SARL supervises their distributor network within Europe.
This information has been sourced, reviewed and adapted from materials provided by Kaiser Optical Systems.
For more information on this source, please visit Kaiser Optical Systems.