A molecule’s hydrophilicity or lipophilicity is a key physicochemical property, especially in the pharmaceutical industry due to its impact on the distribution of drug-like molecules within the body. The lipophilic behavior of a substance can be determined by measuring the distribution of the substance between two immiscible solvents, typically water and 1-octanol. This involves the computation of partition coefficient (Pow) and logarithm (log Pow) of water and 1-octanol.
According to Lipinski's "Rule of 5" for orally active drugs, if a substance’s log Pow is less than 5, then it will have superior drug-likeness. This article discusses an experiment involving determination of the log Pow for some common solvents using 1H NMR and comparison of the experiment results with literature values.
Experimental Procedure
This experiment used the benchtop Spinsolve NMR spectrometer to measure the quantity of the selected analyte in water, prior to and following the addition of 1-octanol layer (Figure 1). This data will be used to calculate the Pow and log Pow of the analytes. Around 200µL of acetone and 500µL of water are placed in a clean, dry NMR tube. The tube is then capped and inverted for mixing. The resulting solution’s 1H NMR spectrum is then recorded. From the spectrum, the acetone and water peaks’ integration values are obtained, followed by normalization of the water peak to a value 1.00.
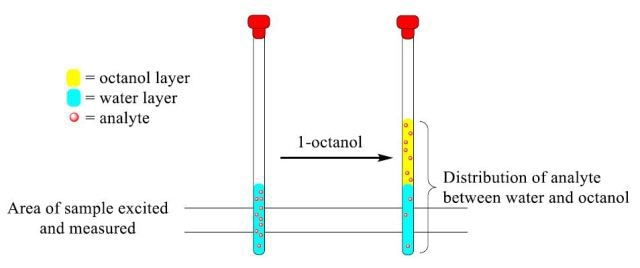
Figure 1. Representative diagram of analyte distribution between the water and 1 -octanol layers upon addition of 1-octanol.
The NMR tube is filled with exactly 500µL of 1- octanol, capped, and inverted for 15-20 times for thorough mixing. The layers are then allowed to separate for roughly 5min. The solution’s 1H NMR spectrum is then recorded to collect integration values for water and acetone peaks, followed by normalization of the water peak to a value 1.00. The Pow and the log Pow of acetone are calculated using the integration values and marked on a large whiteboard.
The mean and standard deviation are calculated using no less than four other values. The above procedure is repeated by using the following solvents in place of acetone: THF, tert-butanol, acetonitrile, 2- propanol and ethanol.
Calculations
The octanol/water partition coefficient (Pow) is the ratio between the analyte concentration in the organic layer (Co) and the analyte concentration in the water layer (Cw). The water quantity remains the same prior to and following the extraction due to its insolubility in 1-octanol. Hence, the two integral values collected for the analyte varies in direct proportion to the concentration prior to and following the extraction. The Pow can be determined using the following equation:
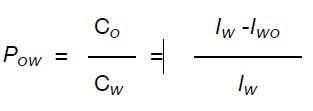
where Iw and Iwo are the peak values of the analyte in water and in water /1- octanol.
Experimental Results
The 1H NMR spectrum of acetone in water (top) and with a layer of 1-octanol (bottom) is shown in Figure 2, from which the peak values of the analyte in water and in water /1-octanol are identified. Using these values, the Pow and log Pow are calculated to be 0.589 and -0.23, respectively, which is in good agreement with the literature value of -0.24.
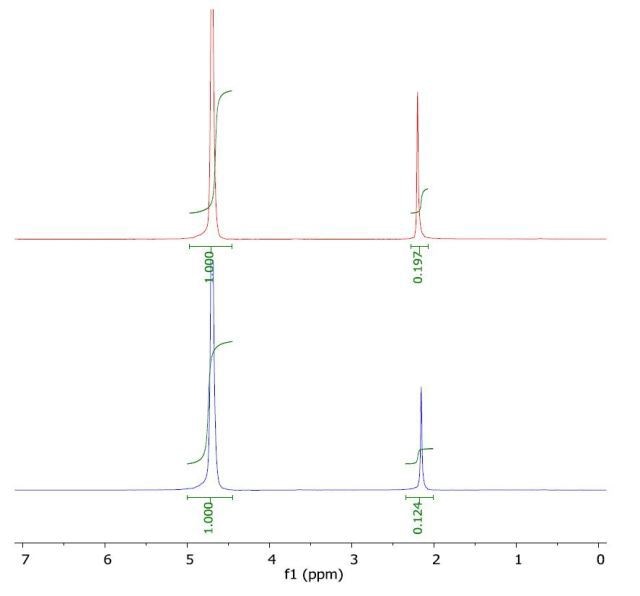
Figure 2. Spectrum of acetone in water (top) and with a layer of 1-octanol (bottom).
The 1H NMR spectrum of ethanol in water (top) and with a layer of 1-octanol (bottom) is presented in Figure 3. The calculated log Pow value of -0.29 correlates with the literature value of -0.30.
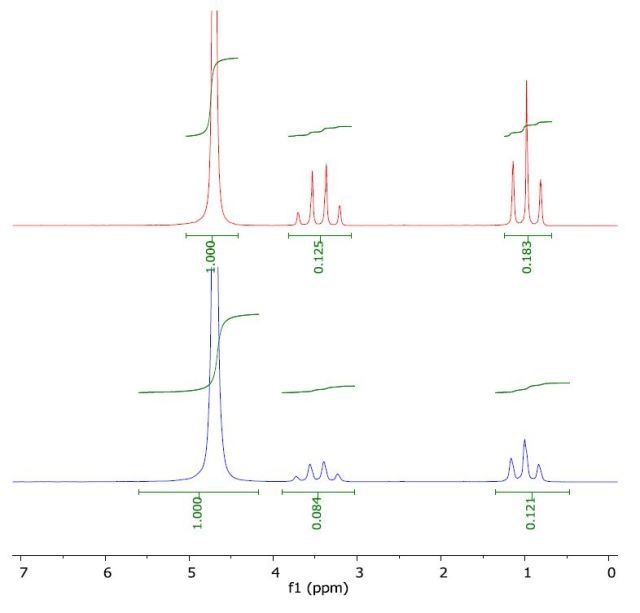
Figure 3. Spectrum of ethanol in water (top) and with a layer of 1-octanol (bottom).
The 1H NMR spectrum of THF in water (top) and with a layer of 1-octanol (bottom) is depicted in Figure 4. The calculated log Pow value of 0.43 is comparable with the literature value of 0.46.
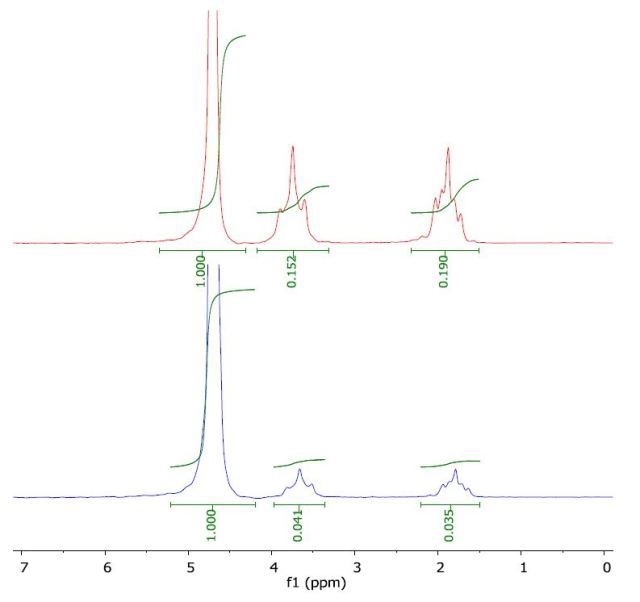
Figure 4. Spectrum of THF in water (top) and with a layer of 1-octanol (bottom).
The 1H NMR spectrum of tert-butanol in water (top) and with a layer of 1-octanol (bottom) is illustrated in Figure 5. The calculated log Pow value of 0.36 is in good agreement with the literature value of 0.35.
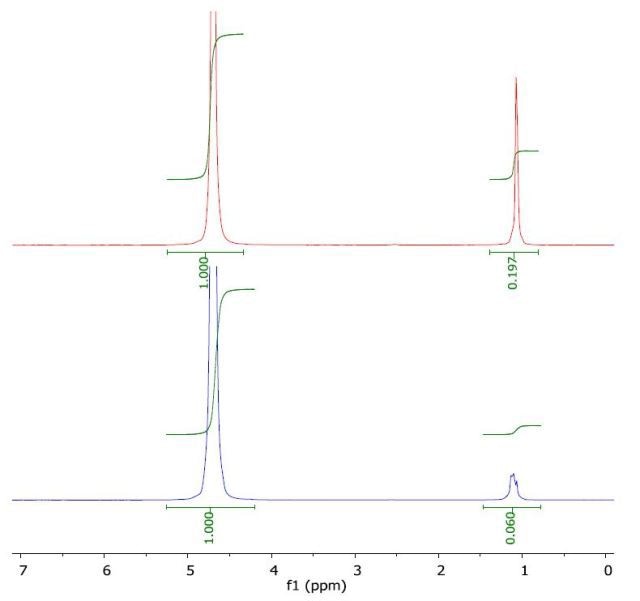
Figure 5. Spectrum of tert-butanol in water (top) and with a layer of 1-octanol (bottom).
The 1H NMR spectrum of 2-propanol in water (top) and with a layer of 1-octanol (bottom) is presented in Figure 6. The calculated log Pow was 0.11 when compared to the literature value of 0.05. the literature value of -0.35.
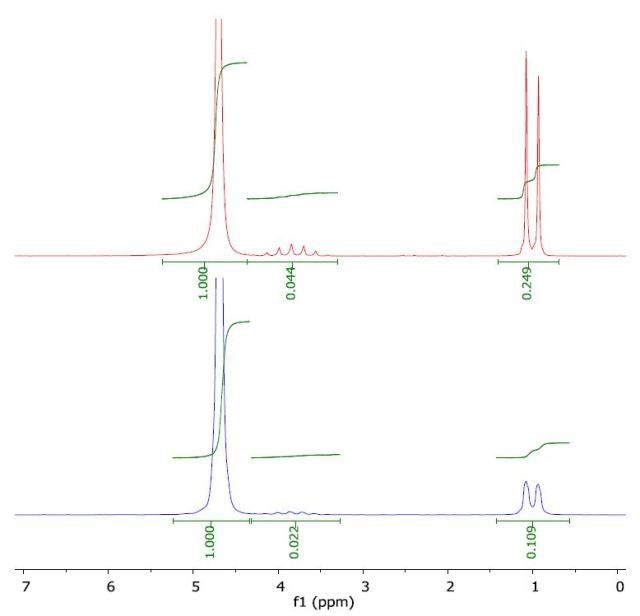
Figure 6. Spectrum of 2-propanol in water (top) and with a layer of 1-octanol (bottom).
The 1H NMR spectrum of acetonitrile in water (top) and with a layer of 1-octanol (bottom) is presented in Figure 7. The calculated log Pow was -0.51 when compared to the literature value of -0.34.
the literature value of -0.35.
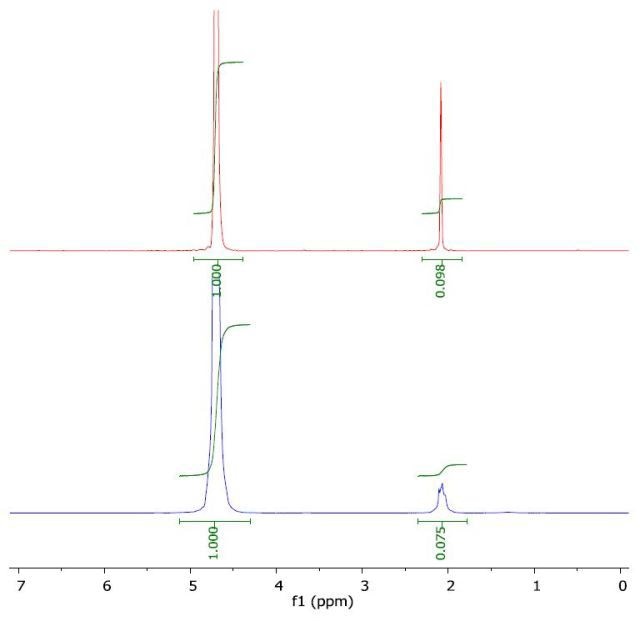
Figure 7. Spectrum of acetonitrile in water (top) and with a layer of 1-octanol (bottom).
Conclusion
The results clearly demonstrate the advantage of using the benchtop Spinsolve NMR spectrometer to calculate Pow and log Pow of some common solvents.

This information has been sourced, reviewed and adapted from materials provided by Magritek.
For more information on this source, please visit Magritek.