In the metallographic laboratory, grain analysis of metallic and alloy samples is an effective quality control procedure. The majority of metals have grain boundaries in their crystalline structure. The material's crystal structure determines how the atoms in each developing grain of a metal or alloy are ordered throughout processing.
Grain size evaluation is crucial to ensure the sample or product has appropriate qualities for the application.
Since it is established that a sample’s mechanical properties at room temperature are often improved when using a smaller grain size, it is necessary to regulate alloy composition and processing to obtain the correct grain size.
Drawbacks of Traditional Methods
In North and South America, ASTM E112 is the grain analysis standard that is most frequently accepted. The “Chart Comparison” approach, which involves visually calculating the grain size by comparing a live image under an optical microscope and a micrograph chart, has historically been the method most commonly used in quality-control laboratories for grain analysis.
By placing an eyepiece reticle directly into a microscope’s optical path, direct comparisons can be made within it. This method uses images of specified grain size patterns, as shown in Figure 1.
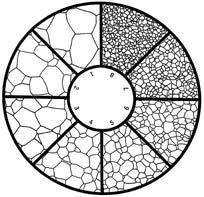
Figure 1. Example of a microscope eyepiece reticle used to compare against a live image. Image Credit: Evident Corporation - Industrial Microscopy
However, operator participation in these approaches results in inaccurate, inconsistent, and non-reproducible outcomes. Additionally, the manual entry of results into a computer-based spreadsheet or report increases the possibility of errors and lengthens the time required for this variety of study.
Turnkey, Fully Automated Grain Analysis Solution
PRECiV™ imaging and measuring software and Olympus Stream™ image analysis software provide two material solutions, grains intercept and grains planimetric, to speed up grain analysis and improve the accuracy of calculated grain size. Both techniques can be applied to standards like ISO 643:2012 and ASTM E112-113.
The “Intercept Method,” a popular digital technique for grain size characterization in metallurgical laboratories, entails superimposing a pattern on the real-time or acquired digital image and drawing an intercept wherever the pattern intersects a grain boundary (Figure 2).
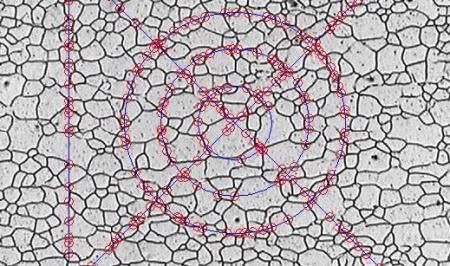
Figure 2. Grain Analysis via the Intercept method in Olympus Stream software. Image Credit: Evident Corporation - Industrial Microscopy
The image analysis software automatically calculates the ASTM “G-Number” and mean intercept length as a function of the pattern length in addition to intercept count following system calibration.
Another method for analyzing particle size is “planimetric,” which estimates the number of grains per unit area in the live or captured image (Figure 3).
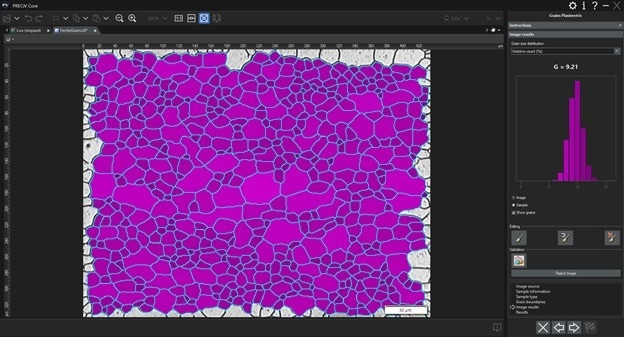
Figure 3. Grain analysis via the Planimetric method in PRECiV software. Image Credit: Evident Corporation - Industrial Microscopy
By eliminating operator guesswork through internal calculation of the results, image analysis software produces accurate, consistent, and reproducible outputs.
Additionally, it is feasible to set up the software programs for metallurgical-specific microscope image analysis to automatically archive the grain results into a spreadsheet or optional integrated database (Figure 4).
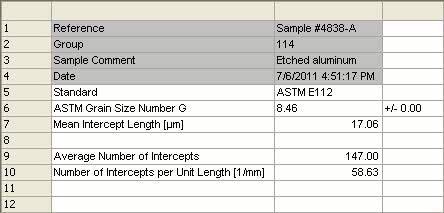
Figure 4. Results of an ASTM E112 analysis. Image Credit: Evident Corporation - Industrial Microscopy
Typical Equipment Configuration for Grain Analysis
The standard experimental set-up for grain analysis using digital image analysis includes an inverted metallurgical microscope, a high-resolution CCD or CMOS digital camera explicitly designed for microscope use, a 10× metallurgical objective lens, and image-analysis software tailored to the field of material science (Figure 5).
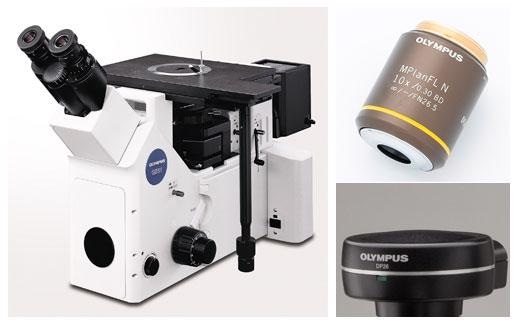
Figure 5. Typical equipment configuration: inverted metallurgical microscope, 10× metallurgical objective lens, microscope-specific high-resolution digital camera. Image Credit: Evident Corporation - Industrial Microscopy
Consistent focus can be guaranteed while controlling the scanning stage since the flat, polished sample is stabilized on the mechanical stage of an inverted microscope.
Users can perform direct grain analysis following international standards such as ASTM E112 by extending material science microscope-specific image analysis software programs with optional add-on modules. Users must be aware of which approach, intercept or planimetric, is more suitable at the procurement time.
When choosing a digital camera for grain size measurement, pixel size or associated density is more important than digital resolution. The Nyquist Theorem states that two to three pixels are required to resolve the finest detail.
For instance, the optical resolution of a mid-grade objective lens would typically be around 1.1 µm when used for grain analysis with a 10x objective lens. As a result, the real, calibrated pixel’s size must be smaller than 366 nm. Therefore, 3 MP or higher material science microscopy-specific cameras can be employed for grain analysis.
It is essential to have cameras capable of grayscale photography since the mode permits accurate grain size analysis - additionally, cameras with a quick refresh rate in live mode aid in focusing and placing samples. A coded manual or motorized rotating objective nosepiece is advised.
The chosen image-analysis program must always be capable of automatically reading the objective lens’s magnification. Preventing errors from being made when it comes to manually entering the objective lens magnification into the software helps assure excellent measurement accuracy.
A manual or motorized XY scanning stage must also be used to position the sample at the desired location for further examination. The experimental set-up includes a PC with a high-resolution monitor that meets the minimum hardware requirements for the camera and image-analysis software.
Experimental Procedure
An all-inclusive solution for grain analysis, including image acquisition, processing, and reporting, is provided by a specialized metallurgical microscope such as the GX53 inverted optical microscope with PRECiV or Olympus Stream software. The fundamental procedures for analyzing grains are as follows:
- Utilize the imaging program to capture the digital image. To make the grain boundaries clear for analysis, use filters as necessary.
- Image analysis uses Grains Intercept or Planimetric material solution. The results are automatically stored on a spreadsheet within the image analysis program. Five random fields are commonly used for grain analysis.
- Position the sample using the XY stage so that the 10x objective can be used in brightfield, reflected light conditions to observe the area of interest.
- The previous steps should be repeated five times in succession. According to the user’s predefined template, a report comprising the analysis results, illustrative photographs of the grains, and related information is automatically prepared (Figure 6).
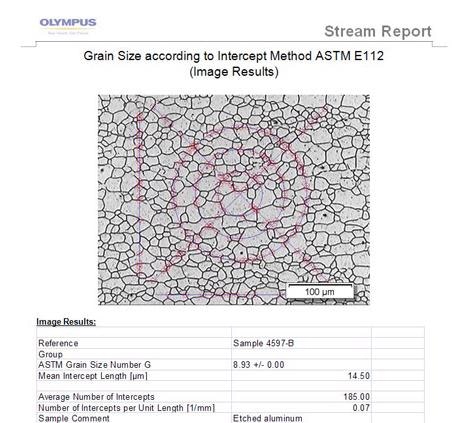
Figure 6. An example report for grain intercept in Olympus Stream software. Image Credit: Evident Corporation - Industrial Microscopy
Conclusion
Modern grain size analysis software reduces the necessity for human intervention, resulting in precise and reproducible results when used in tandem with material science microscope images. Numerous software packages are available to perform grain analysis following international standards like ASTM E112.
In addition to requiring little effort to set up, these software packages can produce reports automatically based on analysis data and offer an integrated database for storage for future use.

This information has been sourced, reviewed and adapted from materials provided by Evident Corporation - Industrial Microscopy.
For more information on this source, please visit Evident Corporation - Industrial Microscopy.