Nonmetallic impurities can contaminate steel during manufacture. Steel has various mechanical properties due to its different chemical compositions.
These inclusions frequently have a considerable impact on the qualities of steel, including machinability, toughness, corrosion resistance, and formability. It follows that lower inclusion levels correlate directly with improved steel quality. This emphasizes the significance of investigating the nonmetallic inclusions in steel during quality control.
In North and South America, ASTM E45 is the most widely used standard for examining nonmetallic impurities. One of the often employed techniques in quality control laboratories allows the operators to make a visual assessment of the nature and severity of the inclusion.
Since the development of digital imaging, samples can now be examined with a 10× objective lens at a resolution of 1.0 µm/pixel or higher to look for inclusions. Nowadays, most people prefer digital image analysis due to its outstanding repeatability and precision.
This article presents a typical equipment setup for applying digital image analysis to detect nonmetallic inclusions in steel.
Digital Image Analysis of Nonmetallic Inclusions in Steel
Under brightfield conditions, nonmetallic inclusions on the steel sample surface can be observed using a compound microscope. As a result of their high contrast ratio, inclusions stand out against the steel’s brilliant, gleaming background by appearing dark and are, therefore, simple to see. However, silicate and globular oxide inclusions have different morphological properties.
A wholly integrated digital system to rate nonmetallic inclusions in steel can be run by any user according to the needs of any laboratory setting, thanks to the ongoing advancement of sophisticated image analysis software. Microscopy-based image analysis solutions for metallurgy, which are created in accordance with the ASTM E45 standard, allow the user to rate inclusions in steel accurately and consistently with no training.
Configuring the Metallurgical Image Analysis System
A common metallurgical image analysis system, e.g. the microscopy solutions from Evident, comprises an inverted microscope positioned over the mechanical stage that is used to hold the flat, polished sample. The necessary objective magnification for the nonmetallic inclusions rating is a 10× metallurgical objective lens.
Another crucial component is a microscope-specific CCD or CMOS digital camera with a calibrated digital pixel size of 1 µm per pixel per the ASTM E45 standard. Based on the analysis and observation, a manual or motorized XY scanning stage adjusts the sample’s position at the region of interest. In addition, a PC and high-resolution monitor is employed to meet the minimum system requirements of the camera and image analysis software.
Employing industrial image analysis tools, such as OLYMPUS StreamTM or PRECiVTM software, nonmetallic impurities in steel can be precisely, consistently, and easily discovered. This software also includes optional add-on modules to produce results that adhere to ASTM E45 and other international standards. The schematic of metallurgical image analysis is illustrated in Figure 1.
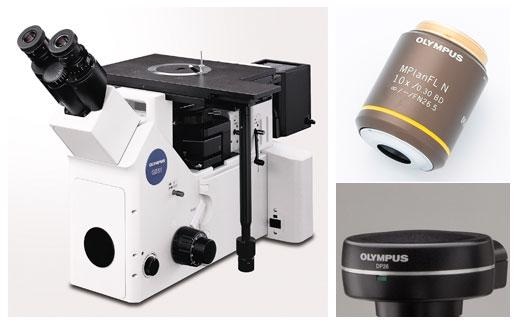
Figure 1. Schematic of a metallurgical image analysis system. The GX53 inverted microscope is combined with a 10× objective, camera, and software to analyze nonmetallic inclusions. Image Credit: Evident Corporation - Industrial Microscopy
How to Use the Metallurgical Image Analysis System
The process involved in using the metallurgical image analysis system is described in the steps below:
- Move the sample to the scanning stage to see the region of interest to examine the inclusions while using the 10× objective lens in brightfield, reflected light circumstances. If a motorized stage is being used, the software can be configured to allow the stage to scan the necessary area.
- Take a digital image using imaging software.
- Using the Nonmetallic Inclusions material solution, set the grayscale threshold settings in the software to indicate all inclusions and distinguish between sulfides and oxides (Figure 2).
- Perform an image analysis; the software will then grade the inclusions according to the selected standard. Other supporting standards besides ASTM E45 include DIN 50602:1988, ISO 4967:2013, and more. Custom solutions can be created to satisfy user needs if the standard of interest is not present in the software.
- Based on the preset framework, an automated report is created that includes the analysis results (Figure 3), inclusion photos, and all pertinent data.
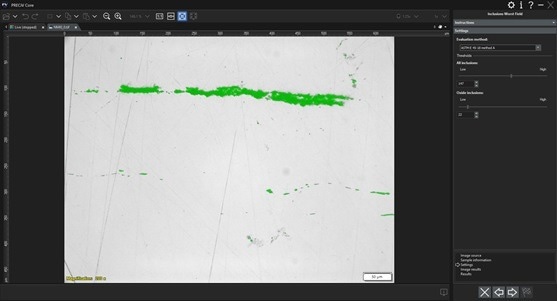
Figure 2. Analysis for nonmetallic inclusions in PRECiV software using the Inclusions Worst Field material solution. Thresholding is used to detect all inclusions and differentiate oxides from other inclusions. Image Credit: Evident Corporation - Industrial Microscopy
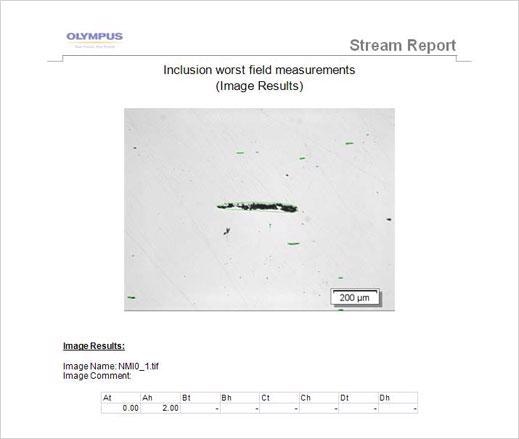
Figure 3. Report generated from OLYMPUS Stream software. Analysis was performed in the Inclusions Worst Field material solution available in both the OLYMPUS Stream and PRECiV image analysis software. Image Credit: Evident Corporation - Industrial Microscopy
Conclusion
Due to the strong contrast ratio between nonmetallic inclusions in steel and their metallic background, industrial image analysis tools can routinely and reliably rate nonmetallic inclusions.
Multiple international standards, including ASTM E45, are met by most industrial image analysis software packages, making implementation simple. They can also offer an integrated database to store and search for photographs and related data, in addition to analytical data reports, which are automatically generated.

This information has been sourced, reviewed and adapted from materials provided by Evident Corporation - Industrial Microscopy.
For more information on this source, please visit Evident Corporation - Industrial Microscopy.