Catalytic hydrogenation represents an integral part of many critical industrial procedures. Standard processes comprise of the catalytic reduction of nitro groups to the equivalent amino compounds, and the hydrogenation of a range of unsaturated compounds, aromatics, and olefins.
A few examples comprise of the production of aromatic amines from the equivalent nitrobenzenes and the production of margarine from vegetable oils. The former reaction holds significance in the synthesis and production of various products, chemicals, and intermediates spanning from pharmaceutical products through to pigments and dyes. This article discusses the advantages of Raman spectroscopy for studying the kinetics of catalytic hydrogenation reactions.
Reduction Reactions
In the presence of a heterogeneous catalyst, numerous nitro-reduction reactions are carried out. When choosing an appropriate catalyst, the reaction yield should be maximized, while the prospect for side reactions should be minimized. Also, to identify the presence of intermediates, a better understanding of the reaction kinetics is crucial.
Some intermediates are considered to be undesirable because they may lead to dangerous reaction conditions or they may produce unwanted side reactions. The presence of intermediates can be indicated by the order of the kinetics. The overall kinetics can also specify the rate determining steps, which are important when side reactions are also involved. This type of analysis help to determine the best catalyst for the reaction.
A kinetics study can be performed to acquire considerable amount of data on the species involved in the reaction. This can be done by using a suitable monitoring system. Such data is ideally achieved in real time, and at a speed that is complementary to the reaction speed.
For these type of reactions FTIR has shown to be a suitable method, and in some cases it has been relatively effective. Infrared (IR) measurements create difficulties relating to spectral interferences and sampling from solvents, particularly with regard to polar media. Raman spectroscopy has been shown to provide major benefits in both of these areas. This method can be interfaced to the reaction through fiber optics, using a non-invasive external probe or an immersion probe. The Raman spectra of a large number of commonly used solvents are much weaker as opposed to their IR spectra.
Experimental Procedure
The present reaction involves nitro-reduction reactions. For instance, ortho-nitrochlorobenzene is reduced with hydrogen at atmospheric pressure, in methanol with a carbon/platinum catalyst to produce ortho-chloroaniline. The reaction follows one of two pathways. At increased pH, chemometrics can be used to demonstrate the reaction to track the upper route, with the two intermediates for hydrogenation or condensation not being present. In this analysis, the effect of a vanadate-based catalyst can be shown, where the order of reaction alters, and where the formation of the expected hydroxylamine intermediate does not take place.
Results
A HoloProbe™ analyzer from Kaiser Optical Systems was used to obtain the Raman measurements in this study.
This method provides a non-invasive way to examine the reaction. Figure 1 shows the example spectral data, with a 2D representation that provides the spectral changes occurring over the course of the reaction for ortho-nitrochlorobenzene. A reduction in Raman band intensities during the progression of spectra from front to back indicates the usage of reactants.
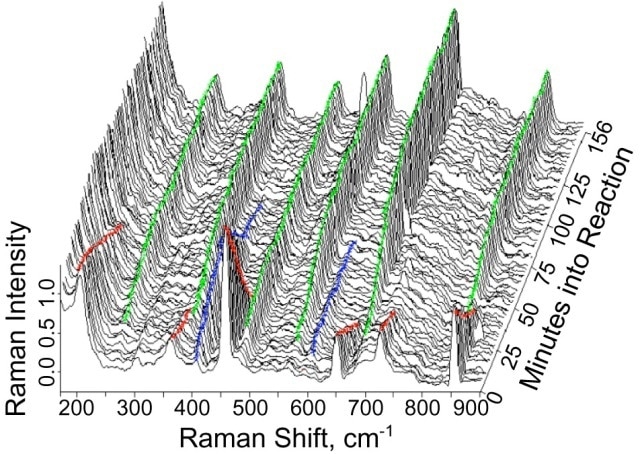
Figure 1. Two-dimensional representation of changes occurring during reduction of the nitro entity.
As expected in the reaction summary, an analysis of a typical reaction system involving the carbon/platinum catalyst point to the formation of hydroxylamine intermediate. When the vanadate catalyst is added to the system, there is an increase in the reaction rate. The outcomes of the Raman monitoring specify a change from the second order to zero order. This change is indicated by the lack of hydroxylamine intermediate, and is sustained by a fit of the quantified reaction rates to those expected for a reaction of zero order. Figure 2 shows a comparison of the observed kinetics for the present study.
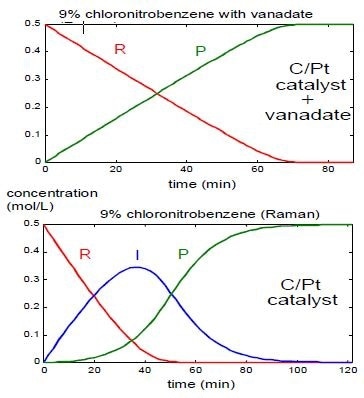
Figure 2. Changes of nitro reduction reaction kinetics as a function of the catalyst system.
Discussion
FTIR can be used to perform reaction monitoring experiments, however a considerable amount of interference is faced from methanol, a solvent and the solvent spectrum has to be subtracted before collecting the spectral data from the reaction products. This is not a viable method because as and when the reaction continues a change occurs in the interactions between the reaction products and the solvent, which makes it too complicated to make an absolute subtraction of the solvent bands. Artifacts and residuals continue to remain in the spectra that were subtracted, and these can impede with data interpretation.
FTIR creates a problem when it comes to sampling, because there is a limited option of optical window materials. For instance a reaction cannot be observed via a glass reactor, because for most of the mid-infrared region the material is solid. While immersion probes are available, limitations are faced when interfacing to the key spectrometer either by the use of physically awkward optical conduits or by optical constraints of mid-infrared optical fibers.
However, such issues are not encountered in Raman spectroscopy because the lasers applied for sample illumination can easily pass through the glass. Unique imaging probes like the KOSI HoloProbe help to track a chemical reaction via a sight glass or through the glass reactor walls. These can be combined to the spectrometer over large distances through traditional silica-based optical fibers.
Conclusion
With regard to the present example, a major advantage of Raman spectroscopy is that the measurement system and the optics do not restrict the instrument’s spectral range. During the entire vibrational spectrum, spectral data can be obtained down to low wavenumbers and without any optical constraints that are otherwise caused by FTIR spectrometers.

This information has been sourced, reviewed and adapted from materials provided by Kaiser Optical Systems, Inc.
For more information on this source, please visit Kaiser Optical Systems, Inc.