Ten infrared-spectrometers GRIPS (ground-based infrared p-branch spectrometers) are operated at the German Remote Sensing Data Center (DFD) of the German Aerospace Center (DLR) for routine monitoring of the so-called airglow arising from the lower thermosphere or upper mesosphere region. In this region, atomic hydrogen reacts with ozone to yield hydroxyl molecules and molecular oxygen:
O3 + H → O2 + OH* (+ 3.32eV)
The surplus energy produced by this exothermic reaction is converted into vibrational and rotational excitations of the OH- molecules (indicated by *). These OH*-molecules form a 8-km thickness layer at a peak altitude of approximately 87 km.
When these molecules return to their ground state, they release infrared radiation in the spectral region between ca. 710 and 2500 nm. This OH*-airglow is the brightest phenomenon at the night sky (Leinert et al., 1998), as its brightness varies between 10-6 and 10-4 Wm-2sr- 1.
The low energy transitions are meant to be in local thermodynamic equilibrium with the surrounding atmosphere, because the deactivation of the OH* occurs by a large number of consecutive transitions of rotational and vibrational excitations. When the intensities of multiple rotational lines within the same vibrational branch are measured, the rotational temperature can be derived as an estimator of the kinetic temperature in this height.
The German Remote Sensing Data Center carried out the measurements, which contribute to the worldwide Network for the Detection of Mesopause Change (NDMC), a program that supports international cooperation among researchers studying the mesopause region (80 to 100 km) for early detection of varying climate signals.
The analysis of atmospheric dynamics on all time scales continues to be an important topic of scientific interest in middle atmosphere studies. This comprises of both the characterization of different atmospheric waves and study of climate trends over several years.
Based on their nature, the atmospheric waves are divided into infrasonic, gravity, and planetary waves. Their typical periods span from several minutes to many hours for atmospheric gravity waves, from days to weeks for planetary waves, and less than 5 minutes for infrasonic waves (e.g. Pilger and Bittner, 2009).
Experimental Setup
In the late 1940s, Meinel (1950) relied on more than 40 hours of exposure time for his discovery of the airglow phenomenon. In contrast, the combination of a high aperture polychromator (Andor Shamrock 163) and an InGaAs-array detector (Andor iDus DU490A-1.7) enables exposure times as low as 10 to 15 seconds.
This temporal resolution is much higher than what was attained earlier with scanning spectrometers fitted with liquid nitrogen cooled ultra low noise Germanium photodiode. The iDus DU490A-1.7’s thermoelectric cooling system offers a major benefit when compared to liquid nitrogen cooled systems in terms of sturdiness and maintenance needs. As a result, the German Remote Sensing Data Center currently uses 8 out of 10 spectrometers that are integrated with the iDus DU490A-1.7.
The detector’s temperature is efficiently stabilized with the Exos-2 water recirculator, even in warm environments of +30°C or more. During routine monitoring, the grating is positioned at a permanent angle, shedding the spectral region from 1500 to 1600 nm on the 512 pixel InGaAs-array.
Although special entrance optics is incorporated in certain GRIPS instruments, others are merely loaded in an upward direction to monitor the night sky (Figure. 1). The F-number of the Shamrock 163 (F/# = 3.7) determines their field of view.
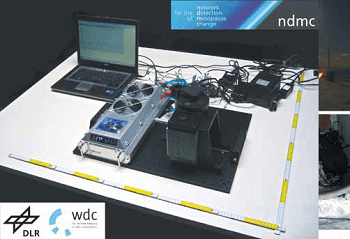
Figure 1. Setup of the GRIPS 6 instrument at the German Remote Sensing Data Center in Oberpfaffenhofen (48.09°N / 11.28°E). The instrument is composed of an Andor Shamrock 163 non-imaging spectrograph, an Andor iDus DU490A-1.7 photodiode array (partly hidden behind the spectrograph and filterwheel), powered by a PS-25 power supply for deep cooling temperatures in combination with an Exos-2 water recirculator. The laptop shows a 15 second exposure of the OH nightglow between 1500 nm and 1600 nm obtained with the Andor Solis software.
With regard to airglow observation, the most critical application of the iDus DU490A-1.7 is the detectors’ dark currents, which are an order of magnitude bigger than the recorded airglow signal. These dark currents remain extremely stable throughout the night, enabling accurate measurements of the intensities of emission lines.
Results and Discussion
The iDus DU490A-1.7 was first integrated in the GRIPS 5 and GRIPS 6 systems in October 2008 and January 2009, respectively. Since then, the instruments have been doing routine measurements almost all nights.
Until April 2011, the GRIPS 6 instrument has been used over 750 nights with the camera recording the data for 7 hours (summer) to 15 hours (winter) every night. During these two years, there was no major change in the responsivity of the system.
In addition, the systems’ maintenance requirements also allow remote operation of spectrometers located in remote areas, such as the Arctic Lidar Observatory for Middle Atmosphere Research (ALOMAR, 69.28°N/16.01°E) in Norway (Figure 2) and the Environmental Research Station “Schneefernerhaus” (47.42°N/10.98°E), situated at Germany’s highest mountain Zugspitze.
In Europe and beyond, new observation sites are being prepared. Data acquired using these systems can be accessed in almost real time through the World Data Center for Remote Sensing of the Atmosphere (WDC-RSAT).
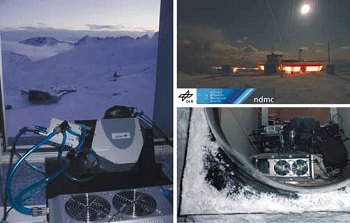
Figure 2. The left panel shows the GRIPS 5 instrument deployed at the Environmental Research Station “Schneefernerhaus” (47.42°N / 10.98°E), located 2650 m above sea level at Germany’s highest mountain Zugspitze. The right panels show the setup of the GRIPS 9 instrument under a dome on top of the roof of the Arctic Lidar Observatory for Middle Atmosphere Research (ALOMAR, 69.28°N / 16.01°E) in Norway during winter 2010/2011.
Figure 3 depicts a standard spectrum acquired using the GRIPS 8 at 15 seconds exposure time during the night from 5th February, 2011 to 6th February, 2011 at the Environmental Research Station “Schneefernerhaus”. In Figure 3, the intensity is provided in counts as retrieved from the iDus DU490A-1.7 used in high sensitivity mode at a - 60°C detector temperature and 15 seconds exposure time.
The dark current of about 5000 counts per pixel was also eliminated. The three P1-lines of the OH(3-1) branch are used to measure the rotational temperatures. This specific spectrum creates a temperature of 213.6 K ±3.5 K. The signal-to-noise ratio is quite high for this kind of measurement and the uncertainty is estimated from this ratio.
For the sake of comparison, the photon flux is of the order of about 5000 photons s- 1arcsec-2 m - 2 µm-1 at the maxima of the two Q-branches (Leinert et al., 1998). The instrument’s field of view is about 15° full angle.
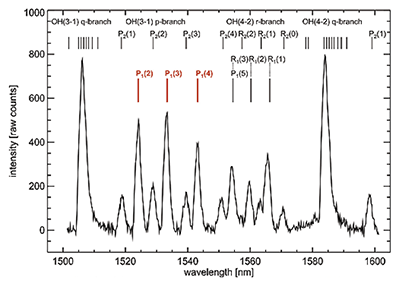
Figure 3. Medium resolution OH*-airglow spectrum between 1500 nm and 1600 nm; the original OH-line width is less than 0.01 nm. The spectrum was obtained with the iDus DU490A-1.7 detector mounted at the Shamrock 163 with the slit width set to 250 µm.
During routine monitoring, a single spectrum is acquired at intervals of 15 seconds. The amount of spectra acquired in each night spans from 1800 (summer) to 3600 (winter) for the observation sites located in Germany and up to 5000 spectra were acquired during the winter at ALOMAR (69.28°N/16.01°E) located in Norway.
Figure 4 displays the nocturnal evolution of OH* intensities and rotational temperatures for the night from June 27th to 28th, 2010, that were simultaneously recorded at two sites based in Southern Germany. Both systems observed relatively strong oscillations in rotational temperature and airglow intensity.
It must be noted that temperatures and intensities constitute separate parameters in airglow observations; temperatures do not rely on absolute intensities, only on relative line intensities. As a result, oscillations in intensities and temperatures are typically not in phase.
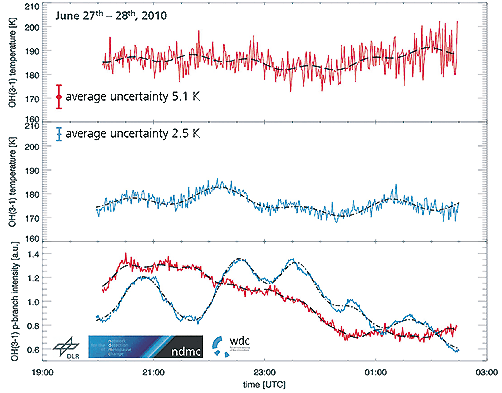
Figure 4. Simultaneous measurements performed with the GRIPS 6 instrument at Oberpfaffenhofen (red) and with the GRIPS 7 at the Schneefernerhaus (blue), both in Southern Germany. The field of views in the mesopause region is approximately 200 km apart.
In Figure 4, the lower panel displays the respective airglow intensity difference at both sites and the upper panels display the evolution of one minute mean values of rotational temperatures. The black curves represent the dominant oscillations, which are recovered by applying the data with harmonic analysis or spectral analysis.
During this night, the wave activity considerably varies at both stations. A 2.2 hour (gravity) wave, which is visibly observed in the intensity differences at the Schneefernerhaus (lower panel, blue), can also be seen in the data obtained from Oberpfaffenhofen (lower, panel red), though its amplitudes are reduced by over 60%.
Figure 5 depicts the evolution of nocturnal mean values as the beginning of observations in Oberpfaffenhofen from January 29th, 2009 to April 4th, 2011.
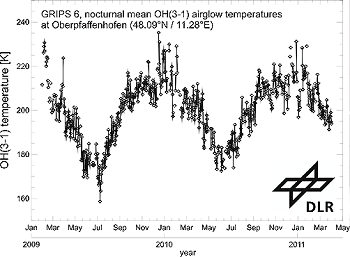
Figure 5. Course of nocturnal mean OH-airglow temperatures since the beginning of measurements at Oberpfaffenhofen at January 29th, 2009. For 629 nights (80% of the complete observation time) a nocturnal mean value was successfully retrieved, only a minor fraction is lost due to bad weather. As a consequence of the high temporal resolution a large number of spectra contribute to the nocturnal means resulting in a statistical uncertainty, which is less than 1 K for every value shown here. Note, that the upper atmospheric residual circulation causes low temperatures during summer and high temperatures during winter. The strong day to day variation is mainly caused by so-called planetary waves.
Conclusion
Due to the system’s excellent performance, nocturnal mean temperatures for 80% of all nights were successfully recovered. This is an exceptional value for a mid-altitude observation site.
The outstanding temporal coverage is attributed to the high temporal resolution that helped to exploit the tiny gaps in the cloud coverage to obtain sufficient amount of data for a representative nightly mean. This was even achieved during nights with relatively poor visibility conditions.

This information has been sourced, reviewed and adapted from materials provided by Andor Technology Ltd.
For more information on this source, please visit Andor Technology Ltd.