Fruit juice continues to be a refreshing and popular beverage, and is seen as a better nutritional alternative than the typical carbonated drinks. The nutritional content of 100% fruit juices is obtained from the fruit itself, and these nutrients are displayed on the detailed bottle label.
This labels provide customers with the nutritional content of the juice and perform comparative shopping. While the labels provide an informative reference for customers, they are a legal requirement in North America, and the manufacturer is responsible for the veracity of the labels.
For food processors and manufacturers, it is essential that there is a method to quantify the food product content, including micronutrients, for quality and safety reasons as well as regulatory label-claim requirements. Screening raw materials for contaminating elements before use and then checking the micronutrient content of the final food product are two examples of the advantages of analytical testing.
Additionally, accurate and correct analysis can help to improve the production process by providing quick results and allowing for optimization of the production process to maximize production volume or nutrient yield where appropriate.
Inductively coupled plasma optical emission spectroscopy (ICP-OES) is generally favored in a multi-element analytical environment with detection capabilities suitable for nutritional analysis as shown in this application. Flame atomic absorption (AA) systems, which save costs, and offer single-element analytical speed and simplicity, can be considered as an attractive alternative solution1.
However, measuring several elements by Flame AA translates to individually re-analyzing each sample for each element, which can nullify the speed advantage of Flame AA.
This article focuses on the analysis of micronutrients in various commercial juice products using a PerkinElmer Avio™ 200 ICP-OES with sample preparation performed using a PerkinElmer Titan MPS™ Microwave Sample Preparation System.
Experimental
Samples and Sample Preparation
As fruit juice and fruit juice blends are available in several varieties on the market, samples were chosen to be representative of commonly available and purchased juices. During selection, samples that were made from 100% juice (as accepted under the present labeling guidelines) were used, although in many cases, the juice was reconstituted from concentrate.
The samples that were analyzed represented two brands of orange juice, grape juice, and apple juice, along with a cranberry juice and a cranberry juice cocktail. The analytical elements chosen are representative of micronutrients that are usually displayed on product labels for the juices.
Closed-vessel microwave-assisted digestion using a PerkinElmer Titan MPS microwave digestion system was used to prepare juice samples. Tables 1 and 2 list the digestion method, sample parameters, and the reagents used. First, samples were transferred by volume into the digestion vessels, and subsequently the digestion reagents and sample spikes, if any, were added.
The samples and reagents were then kept in open vessels for 10 minutes, which permitted any early reactions to take place in a safe environment. Then, the vessels were closed and placed into the Titan MPS for heating and digestion. With digestion completed, the samples were shifted from the digestion vessels by triple-rinsing with deionized (DI) water into sample vials and then mixed with DI water (18 MΩ-cm) to make up for the final solution volume.
Table 1. Titan MPS digestion method.
| Step |
Target Temp (°C) |
Pressure Limit (bar) |
Ramp Time (min) |
Hold Time (min) |
Power Limit (%) |
| 1 |
150 |
30 |
8 |
5 |
90 |
| 2 |
200 |
30 |
2 |
20 |
100 |
| 3 |
50 |
30 |
1 |
20 |
0 |
Table 2. Digestion information.
| Parameter |
Volume |
| Reagents Used |
8 mL of HNO3 (70%), 2 mL H2O2 (30%) |
| Initial Sample Volume |
5 mL |
| Final Solution Volume (after dilution) |
50 mL |
Instrumental Conditions
The analyses were conducted on an Avio 200 ICP Optical Emission Spectrometer, which was equipped with a PerkinElmer S10 Autosampler. Tables 3 and 4 outline the elements of interest and instrument conditions for the analysis of the juice samples.
A Meinhard® glass nebulizer was used with the standard cyclonic spray chamber. External setting standards were made from a custom PerkinElmer multi-element standard and were diluted with DI water and trace metal-grade nitric acid (HNO3) to the final elemental concentrations as listed in Table 5.
The final HNO3 concentration of the standards was about 10% to match the somewhat high concentration of the acid in the digested and diluted samples.
Table 3. Avio 200 ICP-OES instrumental parameters.
| Parameter |
Value |
| Nebulizer |
Meinhard® Glass Type K1 (Part No. N0777707) |
| Spray Chamber |
Glass Cyclonic Baffled (Part No. N0791352) |
| Sample Uptake Rate (mL/min) |
0.8 |
| RF Power (W) |
1500 |
| Nebulizer Gas (L/min) |
0.68 |
| Auxiliary Gas (L/min) |
0.2 |
| Plasma Gas (L/min) |
8 |
Table 4. Method parameters.
| Element |
Wavelength (nm) |
Plasma View |
Integration Range (sec) |
| Ca |
317.933 |
Radial |
0.1 - 5 |
| Cu |
327.393 |
Axial |
0.1 - 5 |
| Fe |
238.204 |
Axial |
0.1 - 5 |
| K |
766.490 |
Radial |
0.1 - 5 |
| Mg |
285.213 |
Radial |
0.1 - 5 |
| Mn |
257.610 |
Axial |
0.1 - 5 |
| Na |
589.592 |
Radial |
0.1 - 5 |
| P |
178.221 |
Axial |
0.1 - 5 |
| S |
181.975 |
Axial |
0.1 - 5 |
| Zn |
206.200 |
Axial |
0.1 - 5 |
| Y (int std) |
371.029 |
Radial |
0.1 - 5 |
| Y (int std) |
371.029 |
Axial |
0.1 - 5 |
Table 5. Calibration standards.
| Element |
Std 1 (mg/L) |
Std 2 (mg/L) |
Std 3 (mg/L) |
Std 4 (mg/L) |
| Ca |
- |
- |
10 |
50 |
| Cu |
0.1 |
1 |
- |
- |
| Fe |
0.1 |
1 |
- |
- |
| K |
- |
- |
10 |
50 |
| Mg |
- |
- |
10 |
50 |
| Mn |
0.1 |
1 |
- |
- |
| Na |
- |
- |
10 |
50 |
| P |
- |
- |
10 |
50 |
| S |
- |
- |
10 |
50 |
| Zn |
0.1 |
1 |
- |
- |
Analysis was carried out with standard 2-point background correction without any other spectral correction formulas. Yttrium was used as an internal standard for all elements analyzed using axial and radial plasma view.
Together with PerkinElmer’s proven track record of ICP performance, the Avio 200 spectrometer also benefits from a number of unique capabilities. The patented Flat Plate™ plasma technology delivers a robust plasma with zero maintenance and does not require any cooling while using nearly half the argon plasma gas of helical load-coil systems.
The sample introduction system and torch assembly are boxed into a single cassette for simple use and maintenance. Additionally, Avio’s Dual View capability permits automated radial or axial viewing, and along with its better optical resolution, provides a large linear dynamic range and better stability and detection limits. The instrument control and analyses were carried out through PerkinElmer’s Syngistix™ software.
Results and Discussion
Table 6 shows calibration results and calibration verification check (ICV) results. The excellent correlation for the calibration standards highlights the precision and accuracy of the Avio 200 ICP-OES. From the independent calibration verification recoveries, it has been ensured that the calibration was valid and the standards were created accurately.
Table 6. Calibration results.
| Element |
Correlation Coefficient |
ICV Concentration (mg/L) |
Measured ICV |
ICV (% Recovery) |
| Ca |
0.99998 |
10.0 |
10.8 |
108 |
| Cu |
0.99995 |
0.100 |
0.106 |
106 |
| Fe |
0.99999 |
0.100 |
0.099 |
99 |
| K |
0.99999 |
10.0 |
10.6 |
106 |
| Mg |
0.99989 |
10.0 |
10.9 |
109 |
| Mn |
0.99999 |
0.100 |
0.098 |
98 |
| Na |
0.99999 |
10.0 |
10.6 |
106 |
| P |
0.99969 |
10.0 |
10.6 |
106 |
| S |
0.99991 |
10.0 |
10.5 |
105 |
| Zn |
0.99995 |
0.100 |
0.098 |
98 |
Figure 1 shows the analytical results of the juice samples. Sample preparation for analysis was easily and rapidly carried out using Titan MPS digestion system. This provided a significant time savings compared to the typical process of open vessel digestion, and, as shown by the sample data and spike recoveries, microwave digestion provides highly consistent sample preparation performance.
The analytical data for the samples match the amounts displayed on the juice labels and show the capability of the Avio 200 ICP-OES to perform accurate analysis of samples containing a large variation of elemental concentrations in one analysis. As one of the orange juices selected was fortified with Ca, the analysis demonstrated a higher amount of Ca for this sample.
The results also indicate the difference between a juice cocktail (Cranberry A), which is a sweetened and blended fruit juice drink, and a pure fruit juice (Cranberry B), where the pure fruit juice had consistently higher concentrations of elements as compared to the juice cocktail. The elemental distributions among the various samples indicate how the different balance of nutrients in the raw fruit can translate to the nutrients existing in the final product and how monitoring and measuring these is vital for the quality of products and labeling accuracy.
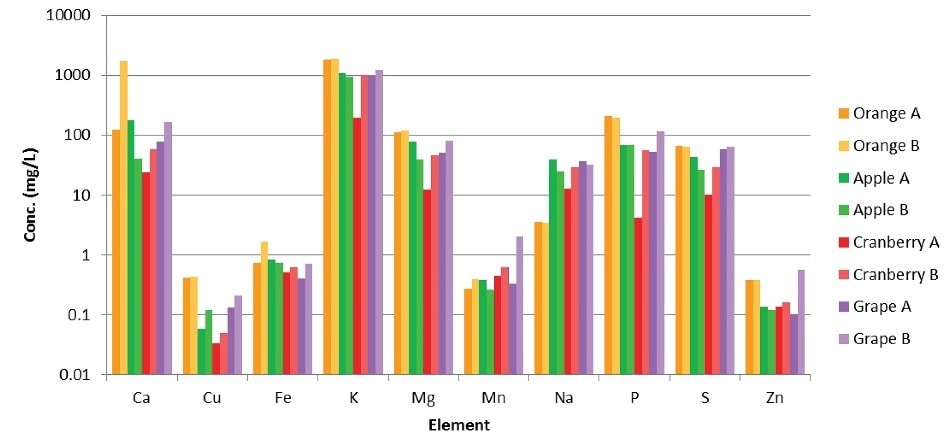
Figure 1. Results from analyses of juice samples.
It was not necessary to carry out additional sample dilutions to reduce any high-element concentrations due to the availability of a large dynamic range and the Dual View capability of the Avio 200 system. This meant that all elements were measured in a single analysis without any need to prepare samples using multiple dilutions or measure the elements over multiple analytical acquisitions.
This leads to improvements in productivity and sample throughput. A simple calibration covering the appropriate concentration range for each element ensured that each sample could be analyzed in a single analytical pass, as the Avio 200 ICP-OES had better linearity over a large concentration range.
To evaluate any remaining matrix effects from the various juices and for verifying the entire sample prep method, all juice samples were spiked before digestion with all elements at the levels, as shown in Table 7. Figure 2 shows the resulting spike recoveries. The potassium levels in the juice samples were very high in relation to the spike concentration level, so each and every recovery value for potassium are not included.
All other spike recoveries are within 10% of the calculated values, validating the capabilities and quality of digestion of the Titan MPS and eliminating the requirement for per-sample matrix-matching or use of a standard addition method for precise and accurate results.
Table 7. Pre-digestion spike levels.
| Element |
Spike Concentration (mg/L) |
| Cu, Fe, Mn, Zn |
2 |
| Ca, K, Mg, Na, P, S |
50 |
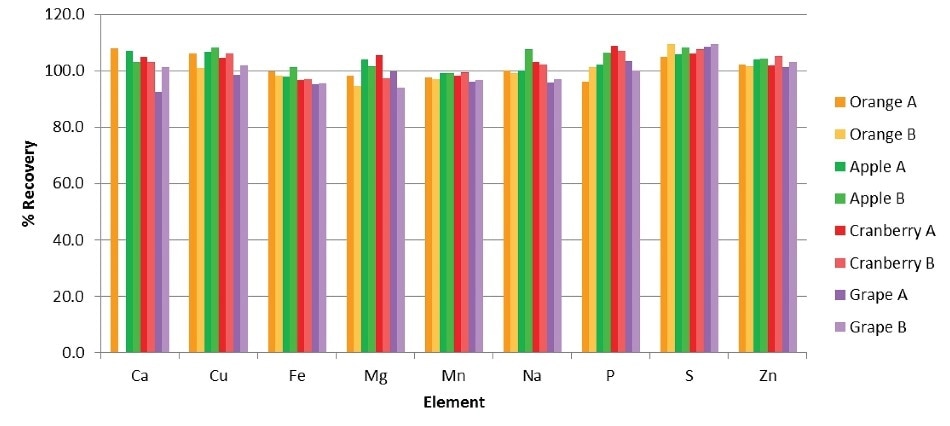
Figure 2. Spike recoveries in the juice samples.
Conclusion
This study showed the ability of the Avio 200 ICP-OES to effectively and reliably analyze various fruit juice samples for a number of elements over a wide concentration range. With its comprehensive capabilities, the Avio 200 system provides greater multi-element sample output as compared to Flame AA while allowing simple analysis of elements which are typically challenging for Flame AA (such as sulfur and phosphorus).
Using the Titan MPS microwave digestion system enabled a simple sample preparation while improving the output and productivity for the laboratory, compared to hot block or hot plate digestions. The ability to fully digest the samples makes the analysis simple by eliminating the requirement for matrix-match calibration standards or use of a standard addition method.
The combined use of the Titan MPS for sample preparation and the Avio 200 ICP-OES for analysis is ideal for simple, quick, and accurate analyses of nutritional elements in fruit juice.
Consumables Used
| Avio 200 ICP-OES |
| Component |
Part Number |
| Red/Red PVC Pump Tubing |
09908585 |
| Black/Black PVC Pump Tubing |
09908587 |
| Orange/Green PVC Pump Tubing |
N0777110 |
| Internal Standard Kit |
N0774068 |
| Autosampler Tubes |
B0193233 (15 mL)
B0193234 (50 mL) |
| Instrument Calibration Standard 2 (100 mg/L) |
N9301721 |
| Pure-Grade Phosphorus Standard (1000 mg/L) |
N9303788 (125 mL)
N9300139 (500 mL) |
| Pure-Grade Sulfur Standard (1000 mg/L) |
N9303796 (125 mL)
N9300154 (500 mL) |
| Titan MPS Digestion System |
| Component |
Part Number |
| Consumables Kit for Standard 75 mL Digestion Vessels |
N3132000 |
| Rupture Disks for Standard 75 mL Digestion Vessels (25 pieces) |
N3132001 |
| Pressure Seal for Standard 75 mL Digestion Vessels (10 pieces) |
N3132002 |
| End Cap Plug for Gas Containment Manifold |
N3134004 |
| Single Lip Seal Forming Tool for Standard 75 mL Digestion Vessels |
N3132015 |
| 8-Position Lip Seal Forming Tool for Standard 75 mL Digestion Vessels |
N3132014 |
References
1. Spivey, Nick, “Analysis of Micronutrients in Fruit Juice Using FAST Flame Sample Automation for Increased Sample Throughput”, Application Note, PerkinElmer, 2015.

This information has been sourced, reviewed and adapted from materials provided by PerkinElmer.
For more information on this source, please visit PerkinElmer.