Understanding the underlying processes that control the outcome of a reaction has always been important to chemists because they can learn from design, control and optimize a chemical transformation. To obtain a better understanding, a wide range of options are available in the chemists’ characterization toolbox – ranging from pH sensors, pressure and temperature through to chemically specific techniques such as mass spectrometry (MS), infrared (IR), ultraviolet-visible (UV-Vis) spectroscopy and Raman.
Nuclear Magnetic Resonance (NMR) Spectroscopy, in spite of its superiority in structure elucidation, is generally underrepresented in this capacity. Since its introduction in 1961, NMR spectrometers have remained large, expensive, both in capital costs and operating expenditures and difficult to use without suitable expertise. However, in the late 2000s, after the trend of other analytical technologies, the miniaturization of NMR spectrometers also started.1 The development of:
- New NMR signal detectors (i.e., force-detectors, microcoils, and external-field configurations); coupled with,
- The discovery of new rare earth metals (i.e., neodymiumiron- boron (NeFeB) and samarium-cobalt (SmCo));
- New design principles; and
- Suitable ways to develop magnets homogeneously and repeatedly.

has enabled the development of a new range of NMR instrumentation called the benchtop NMR Spectrometer.
More powerful than a relaxometer, the permanent magnet based benchtop NMR spectrometer, is low-field (<100MHz), high-resolution (<1.2Hz peak width at half height). Its compact size makes it suitable for fumehood, glovebox, in-laboratory, or process line applications.2 The performance enables several applications that require chemical speciation – including reaction monitoring.
While the efficacy of benchtop NMR spectroscopy for at-line reaction monitoring has been already discussed,3 this article discusses the hardware of the NMReady-flow kit required to transform an NMReady benchtop NMR spectrometer into a detector for analyzing online reactions.
The hardware consists of:
- A customized borosilicate glass flow cell designed to cover the length of the hybrid Halbach magnet that produces the static magnetic field of the NMReady
- The required hardware to connect the glass flow cell with chromatography tubing
The flow cell was designed in such a way that it can be used with any NMReady-60PRO or NMReady-60e without requiring any modification of probes. It maintains a sealed loop, minimizes volume in the flow cell and moves leaks to outside the magent to ensure that accidental spillage does not interfere with the operation of the instrument (Figure 1).4 Data can be obtained both manually and automatically through a number of ways. For simple and easy reaction monitoring, a kinetics package and access to the Application Programmatic Interface (API) via JSON protocols are provided, so that the same interface can control the entire liquid handling system.
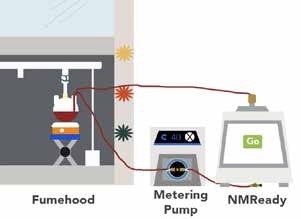
Figure 1. Cartoon schematic of online flow loop and reaction monitoring system.
Results and Discussion
A set of experiments were conducted to observe the efficacy of benchtop NMR as an online detector with different reactions. This article discusses the monitoring of hydrogenation reactions carried out in proteo-solvents without requiring the addition of deuterium, using the benchtop NMR instrument. In these analyses, basic Schlenk techniques with a stir plate, a round bottom flask and a metering pump that can be operated in either stopped flow (0mL/ min) or continuouse flow modes (0.1–4.0 mL/minute). Based on acquisition parameters, a scan can be acquired approximately every four seconds to allow for rapid signal averaging as required. Typical Wilkinson Catalyst ([Cl-Rh(PPh3)3] conditions were chosen to hydrogenate styrene and (R)-6,8-pmenthadie-2-one (R-(-)-carvone) with tris(triphenylphosphine rhodium (I) chloride.5
![Reaction schematic for R-(-)-carvone hydrogenation with [ClRh(PPh3)3].](https://www.azom.com/images/Article_Images/ImageForArticle_13898_44837497157905091710.jpg)
Scheme 1. Reaction schematic for R-(-)-carvone hydrogenation with [ClRh(PPh3)3].
On a double manifold high vacuum line using traditional Schlenck techniques, a 100 mL three neck round bottom flask was charged with R-(-)-carvone (1.35 g, 9 mmol, 0.3 M), a stir bar, and benzene (30 mL). This was stirred rapidly while adding tris(triphenylphosphine rhodium (I) chloride (0.252 g, 3 mol%) against an argon flow. The resultant solution was fully evacuated and degassed, before adding H2 (1 atm) and then heated to a temperature of 40 °C. Once at temperature, the solution was circulated through the NMReady at 1.2 mL/ minute for a period of 2 hours, with a 1H NMR spectrum (59.96 MHz, 16 scans, 1.1 minute) obtained at an interval of 5 minutes. Figure 2 shows the stacked plot.
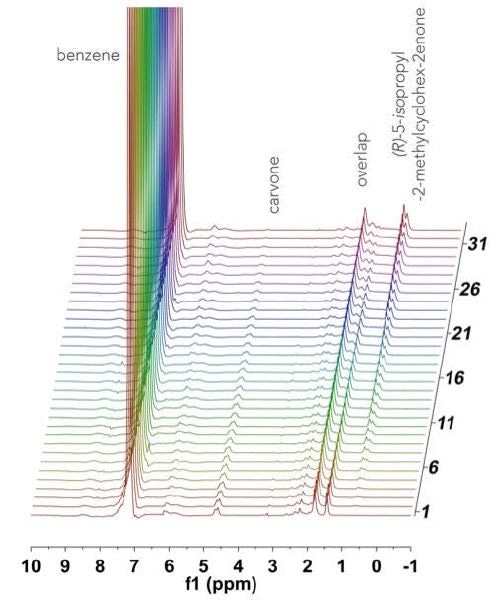
Figure 2. Stacked 1H NMR spectra acquired over 2 hours for the hydrogenation of R-(-)-carvone.
The spectrum is dominated by the benzene solvent peak at 7.16 ppm, and the 1H NMR spectra of the reactant and product are not fully resolved at 60 MHz. Owing to the hindered ring flipping in the cyclohexene moiety, several diastereotopic protons appear in the 1.5-2.5 ppm range. In order to quantify this reaction, well-resolved resonances were examined: the terminal =CH2 vinyl resonance at 5.76 ppm, which disappears as R-(-)-carvone (Figure 3a), is consumed and substituted by a doublet of the newly formed iso-propyl functionality (0.63 ppm) of 5-isopropyl-2-methylcyclo-hex-2-enone, as shown in Figure 3b. In Figure 3c, the speciation plot is seen to be linear, indicating saturation pseudo-zero order kinetics with this catalyst loading
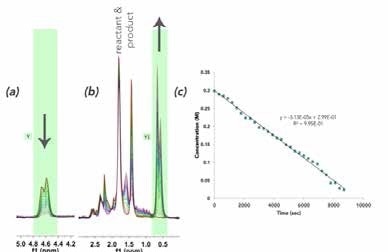
Figure 3. Superimposed spectra showing reaction progress by (a) R-(-)-carvone vinyl =CH2 consumption; and (b) 5-isopropyl-2-methylcyclo-hex-2-enone iso-propyl methyl production; (c) Mnova time plot showing the change in the vinyl resonance integration over time.
In order to further analyze the effects of dynamic range, styrene was also investigated as a substrate under similar oxygen-free Wilkinson conditions, as indicated in scheme 2. The reason for choosing styrene was vinyl groups resonate far enough to the strong benzene signal (7.16 ppm) which allows monitoring their disappearance as the reaction progresses. This is shown in Figure 4, indicating a stacked plot of styrene, benzene and ethylbenzene in d6-benzene.
![Reaction schematic for sytrene hydrogenation with [ClRh(PPh3)3] to afford ethyl benzene.](https://www.azom.com/images/Article_Images/ImageForArticle_13898_44837497172245372954.jpg)
Scheme 2. Reaction schematic for sytrene hydrogenation with [ClRh(PPh3)3] to afford ethyl benzene.
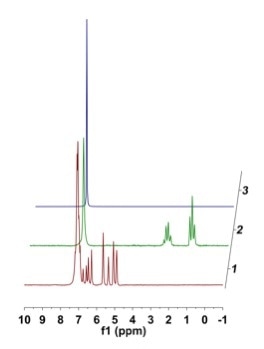
Figure 4. Illustrative 1H NMR 8 scan spectra (40 sec) 5 v/v% in d6-benzene showing proximity of styrene to solvent peak, and the vinyl styrene peak position relative to the hydrogenated ethyl group.
After styrene (1.25 g, 12 mmol, 0.4 M) was added to benzene (30 mL) in a three-neck round bottom flask, the solution was degassed and placed under atmospheric hydrogen pressure before adding tris(triphenylphosphine) rhodium(I) chloride (0.222 g, 2 mol%) against positive pressure. Then, the reaction was heated to 50 °C. Once at temperature, the solution was circulated via the NMReady at 2.2 mL/minute for a period of 2.5 hours, and a 1H NMR spectrum (59.96 MHz, 8 scans, 32 sec) was obtained at an interval of 5 minutes. Figure 5 shows the stacked plot.
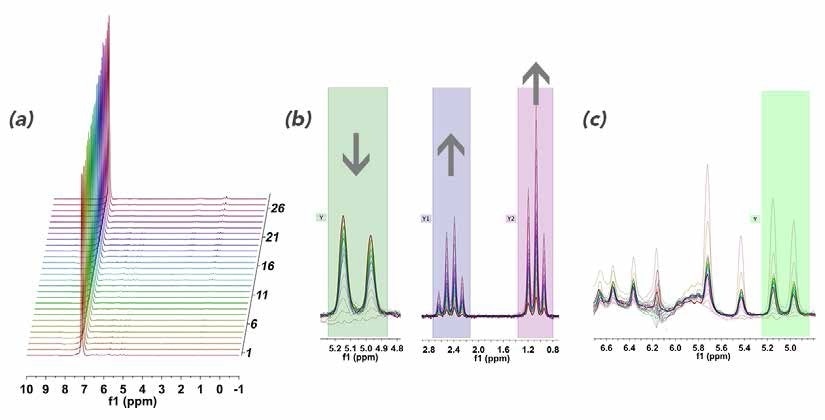
Figure 5. (a) Stacked 1H NMR plot of styrene reaction monitoring in benzene; (b) zoomed in regions of 5.0 ppm showing consumption of styrene and corresponding emergence of the ethyl group at 0.5 - 3.0 ppm; (c) zoomed in of styrene vinyl region to show baseline distortion from strong benzene resonances.
While there were some distortions close to the strong benzene peak that restrict the accuracy of the downfield integrals (Figure 5c), the required information was easily extracted while moving further up-field.
Conclusion
This article shows how the flow cell was effectively used to monitor the extent of hydrogenation reactions by maintaining a sealed loop and without adding any deuterated solvent. Customers interested in self-optimization of fine chemical synthesis using 19F NMR,4 interested in neat solutions,6 or looking for more information can contact Nanalysis Corp.
References and Further Reading
- Zalesskiy, S. S.; Danieli, E.; Blümich, B.; Ananikov, V.P. “Miniaturization of NMR Systems: Desktop Spectrometers, Microcoil Spectroscopy, and “NMR on a Chip” for Chemistry, Biochemistry, and Industry” Chem. Rev. 2014, 114, 5641-5694
- Meyer, K.; Kern, S.; Zientek, N.; Guthausen, G.; Maiwald, M. “Process Control with Compact NMR” Trends in Anal Chem, 2016, 83, 39-52
- Rehm, T. H.; Hofmann, C.; Reinhard, D.; Kost, H-J.; Löb, P.; Besold, M.; Welzel, K.; Barten, J.; Didenko, A.; Sevenard, D. V.; Lix, B.; Hillson, A. R.; Riegel, S. D. “Continuous-flow synthesis of fluorine-containing fine chemicals with integrated benchtop NMR analysis” React. Chem. Eng. 2017, ASAP
- Procedure adapted from: Hinchcliffe, A.; Hughes, C.; Pears, D. A.; Pitts, M. R. “QuadraPure Cartirdges for Removal of Trace Metals from Reaction Mixture in Flow” Org. Process. Res. Dev. 2007, 11, 477-481
- www.nanalysis.com/nmready-blog/2017/3/28/process-nmr-future-key-elements-in-the-world-of-process-analytical-technology-pat [Viewed March 28, 2017]

This information has been sourced, reviewed and adapted from materials provided by Nanalysis Corp.
For more information on this source, please visit Nanalysis Corp.