Sponsored by AdmesyApr 16 2018
Describing and defining the 'temperature' of a color is important for modern lighting applications.
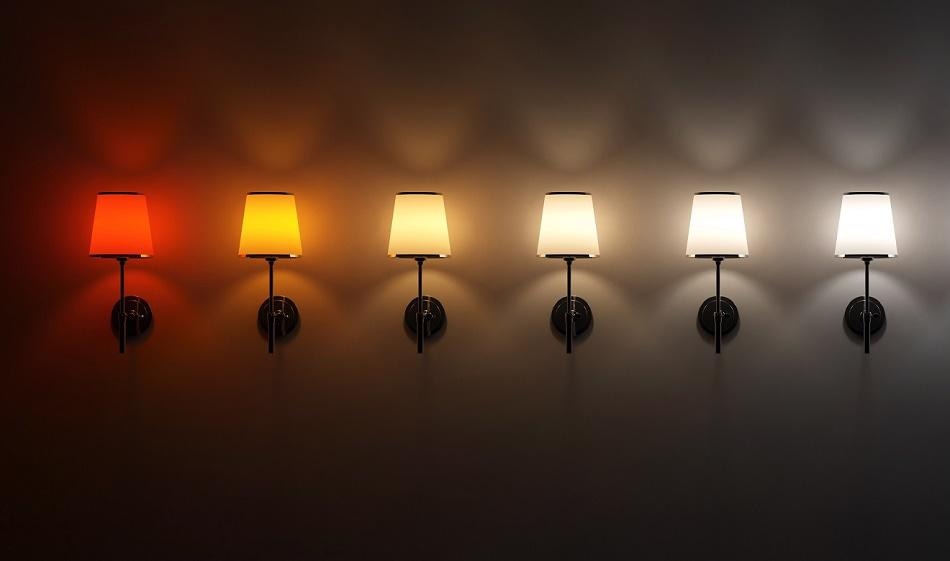
Image Credit: gualtiero boffi/shutterstock.com
Color temperature is defined along a second locus in the color space. This 'black body' locus is often employed in lighting measurement to describe various shades of white light by its color temperature (CT) expressed in Kelvin [K]. Color temperature is based on Planck’s Law which explains the changing color of a heated black body radiator over a certain temperature range.
When a [theoretical] black body radiator is heated, the black body starts emitting ‘warm’ orange light at approximately 1700 K.When the temperature increases, the color shifts more towards yellowish-white and then towards blueish-white. Hence, low color temperatures correspond to warm colors and high color temperatures correspond to cool colors.
In reality, light sources rarely match the exact color point on the black body locus, like the standard illuminants illustrated in the graph below. Correlated color temperature [CCT] is the term used for such light sources that only closely match the black body locus. Isotemperature lines that intersect the black body locus define boundaries for similar color temperatures.
The CCT is the same for colors of light sources on one isotemperature line but their color point may differ: if light sources have the same CCT, it does not necessarily mean they have the same color point.
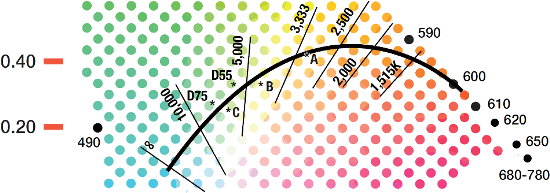
Figure 1. Image Credit: Admesy
| Examples |
| Candle |
1900 K |
| Incandesent Bulb |
2700-3000 K |
| Moonlight |
4100 K |
| Xenon or LED Car Headlight |
4300-8000 K |
| Sunlight |
5000-5800 K |
| Daylight |
5800-8500 K |
Color Deviations: Macadam Ellipses
Small color deviations are not only key to the colors on or around the black body locus, but in the total color space.
In the 1940s, MacAdam performed an experiment to identify which regions of colors are perceived the same by the human eye. For a number of sample colors, participants were tasked to reproduce the same color as accurately as possible. Analysis of these experiments demonstrated colors which were seen to be similar to the sample color were located in ellipses in the 1931 chromaticity diagram.
The various sizes and orientations of these ellipses, in addition to their elliptical [rather than circular] shape around a sample color proved that equal distances in the color space do not correspond to equally perceived color differences. In other words, the CIE 1931 chromaticity diagram looked to be non-uniform.
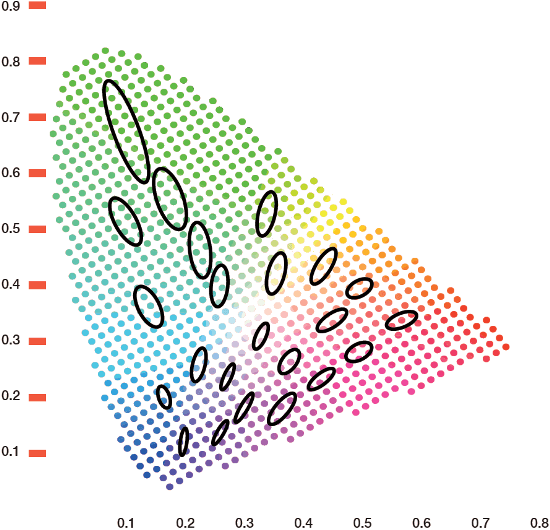
Figure 2. Examples of macadam ellipses in the 1931 chromaticity diagram. Image Credit: Admesy
CIE 1960 & 1976
Although the 1931 color space depended on the average human eye, its non-uniformity was regarded a major disadvantage. To overcome its non-uniformity, the CIE developed an updated color space in 1960 called the Uniform Chromaticity Scale UCS.
This new model was to be replaced rapidly by its 1976 successor - the CIE L*u*v* and simultaneously the L*a*b* model. Instead of x and y, the 1960 USC uses u and v as coordinates. The 1976 uses u’ and v’ to differentiate the variations between the 1960 and 1976 color space. Alike the 1931 and 1960 models, these coordinates are based on CIE XYZ, but estimated in a slightly different way. CIE 1976 u’v’ calculation formulas:
u’ = 4X/(X + 15Y + 3Z)
v’ = 9Y/(X + 15Y + 3Z)
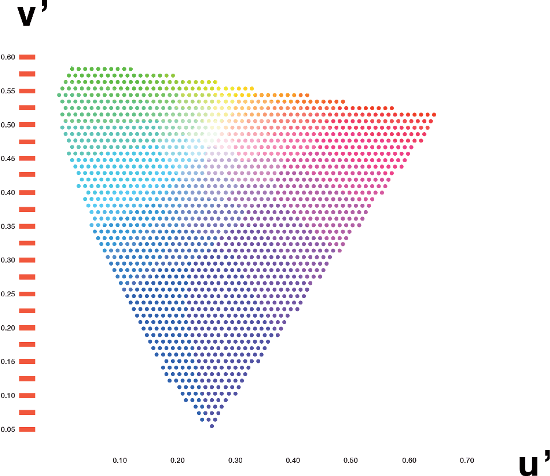
Figure 3. Image Credit: Admesy
The 1976 color space is shaped in a similar way to its 1960 and 1931 predecessors with a spectral locus and purple line. Saturated colors are situated along the spectral locus but colors and white point coordinates have moved in accordance with the enhanced uniformity of the diagram. Despite the influence of MacAdam’s work, the improved color space is so far not perfect.
Creating and developing new and more accurate color spaces matching the human eye is a continuous process wherein the CIE plays a key role. Although these developments pave the way for more accurate definitions in color deviation, the older color spaces such as CIE 1931 are still extensively used in color measurement.
 Download Admesy's Guide to Light for More Information

This information has been sourced, reviewed and adapted from materials provided by Admesy.
For more information on this source, please visit Admesy.