One-dimensional gas chromatographic (1D-GC) analyses of complex environmental, petrochemical, or biological samples often result in a chromatogram with a large portion of unresolved components. Mass spectrometry can be used to resolve some of the complexity but large concentration differences and structural isomers can complicate the spectral interpretation and data analysis. Some chromatographic resolution can be improved with an efficient, long, narrow bore, thin-film capillary column, but increased analysis time and decreased sample loading capacity may be unattractive for high throughput laboratories with complex samples.
Multidimensional gas chromatography (MDGC or 2D-GC) increases resolution by using two separate columns with two different stationary phases. One form of MDGC is heart-cutting. After a preliminary evaluation of the sample, a portion of the unresolved GC effluent can be diverted to a different column before detection. Heart-cutting can be a simple way to obtain a better separation of a complex mixture but just a portion of the one-dimensional separation can be improved with the second-dimension column. A high-frequency modulator is utilized by the comprehensive two-dimensional gas chromatography (GCxGC) for diverting the whole one-dimensional effluent onto a second-dimension column.
Earlier knowledge of the separation (or lack thereof) is not needed for optimizing the analysis as every peak is transferred to the second dimension column. The detector records both the first and second dimension retention times, and the response is plotted to produce a chromatographic plane (i.e. contour plot) (Figure 1). The chromatographic separation space is significantly increased compared to a standard 1D-GC analysis, yielding a big leap in potential peak capacity. Besides increased resolution, the resulting chromatogram is also structured so that similar compounds elute in clustered bands throughout the chromatogram plane.
The clustering of structurally and chemically similar compounds offers a helpful clue that can help in peak identification. Another positive side-effect of a GCxGC analysis is increased compound detectability. When the modulator rapidly traps and then “injects” the effluent of the primary column, it focuses the peaks just a few seconds prior to being detected. This process improves the signal-to-noise ratio (S/N).
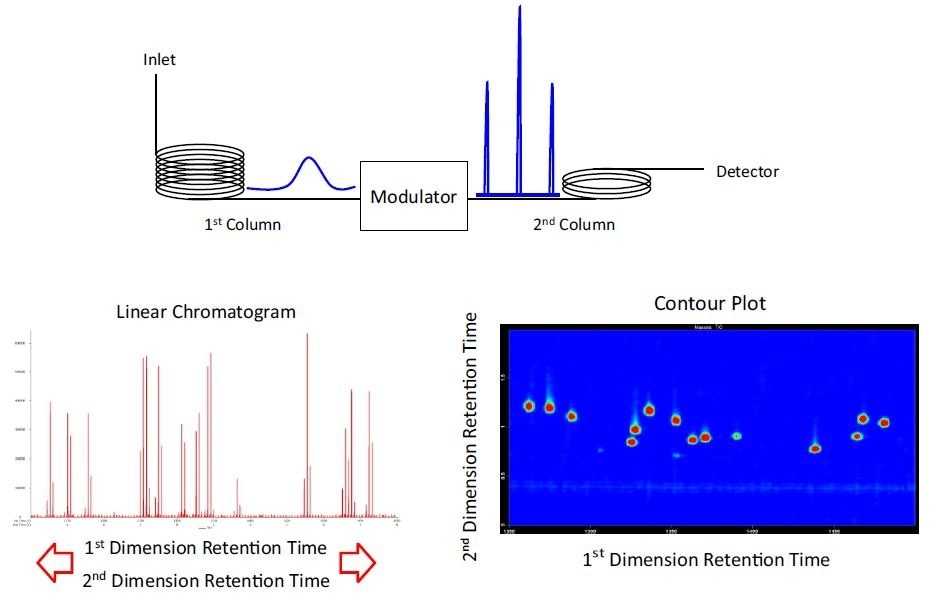
Figure 1. Overview of GCxGC: Peaks eluting from the 1st dimension column enter the 2nd dimension column through the modulator. The modulator rapidly traps the effluent from the primary column and “injects” this effluent to the secondary column. A fast detector simultaneously records the 1st dimension retention time and 2nd dimension retention time. A linear chromatogram is used for quantitation (for example, integration, peak area, peak height, S/N), and the contour plot is a topographic type surface that is useful for data review and display purposes
Groundbreaking leaps in technology like GCxGC can take time before widespread adoption takes place. For instance, the transfer of routine methods from packed GC to capillary GC took decades (one could argue that the transfer is still in progress!). The improved resolution of a capillary GC analysis was initially demonstrated in 1957 with the separation of m- and p-xylene[1]. Petroleum chemists were early adopters of capillary GC, and they gained from the increased peak capacity (i.e. resolution) of complex samples. Even though the technique was superior to packed columns, widespread adoption was slow because of ease of use and ruggedness of the capillary column (glass).
The ruggedness issue was finally solved in 1979 with the introduction of fused silica capillary columns[2], but it still has taken decades for transferring routine accredited methods from packed to capillary column technology. The benefits of capillary columns are indisputable and have enhanced the knowledge of the chemical composition of numerous samples.
Much like the transfer of methodology from packed columns to capillary columns, the transfer of 1D-GC to GCxGC in regulated industries has indeed been slow. The technique was initially demonstrated in 1991[3]. Early adopters discovered that the increased peak capacity was useful for complex petrochemical and environmental samples. The commercialization of a GCxGC instrument available with a thermal modulator in 2002[4] spurred research into a large cross-section of application areas (for example, petrochemical, environmental, metabolomics, fragrance, food safety). Similar hurdles of ease of use and ruggedness have restricted the adoption of the GCxGC platform.
Method development and optimization have been expressed as difficult and laborious and only for an experienced analyst. In recent years, these hurdles have been minimized, making it easier for implementation into a regular laboratory. Helpful guidelines[5] and tools[6] have been created to aid users in GCxGC method development. Flow modulators have been commercialized for users interested in attempting GCxGC at a lower initial cost. Method ruggedness has been demonstrated with a number of published validated methods[7-11].
GCxGC is presently in the process of moving from academic hype to daily practical analysis. In a routine lab, a comprehensive two-dimensional gas chromatographic analysis can help save time by merging several compound classes into a single analysis, and short-cut sample preparation and cleanup by chromatographically resolving matrix interferences. When complete characterization of a sample is required, a GCxGC analysis will speed up discovery and provide insight into a sample that no other chromatographic technique can match. For routine analyzes, more economical detectors (for example, ECD, FID) can be used instead of depending on mass spectrometers for resolving complex mixtures.
Save Time with Multi-Class Analyzes
In routine high throughput laboratories, time is money. Laboratories tasked with monitoring environmental pollutants, for instance, are experiencing reduced operating budgets, dirty samples (for example, soils, sludge, sediments), and a growing mixture of chemical contaminants. Contaminated samples often have multiple classes of components. Contaminants such as brominated flame retardants (BFRs) and polychlorinated biphenyls (PCBs) are halogenated compounds that are commonly analyzed using an ECD. The ECD is a non-specific detector and hence, sample extracts must be carefully fractionated to prevent interferences. When implementing a GCxGC method, fractionation steps can be reduced or eliminated completely. By taking advantage of the second dimension separation space, multiple classes of components can be examined in a single analysis (Figure 2).
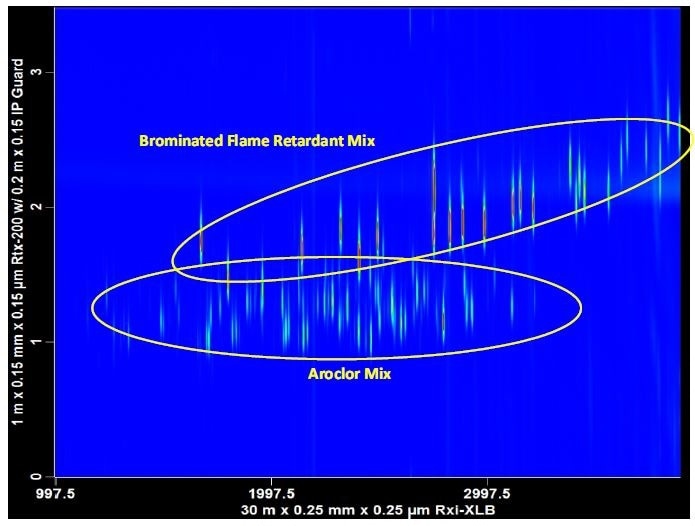
Figure 2. Multiple halogenated contaminants can be analyzed in a single injection using GCxGC-μECD. Brominated flame retardants (BFRs) and polychlorinated biphenyls (PCBs) are often found in the same sample extract. GCxGC reduces the need for fractionation steps.
The Canadian Ministry of the Environment and Climate Change (MOECC) Laboratory Services Branch (Toronto, Ontario) regularly uses three validated GCxGC-μECD methods[12-14]. The GCxGC methods are not only validated but also participate in proficiency testing programs offered by an external organization in order to satisfy accreditation requirements. Two of these methods have been successfully accredited. The first regulatory GCxGC method was produced at MOECC in 2011 for a single analysis of PCBs, organochlorine pesticides (OCPs) and chlorobenzenes (CBz) in soils, sediments, and sludge by GCxGC-μECD[8].
The micro-electron capture detector (μECD) is well suited for an environmental monitoring laboratory because of its low dead volume, low operating cost, and superior sensitivity for halogenated compounds. With GCxGC-μECD, up to six injections were replaced with a single analysis targeting 118 compounds. In addition to lowering analysis time, sample preparation time was also decreased as fractionation of the extracts was no longer necessary. The method performance was examined using certified reference materials and demonstrated excellent agreement with certified values.
Aroclor calculations were still possible using the targeted 82 PCB congeners, allowing for historical comparisons to be made. Another vital benefit of the GCxGC-μECD analysis is the ability to identify non-targeted halogenated contaminants that may have been obscured in a one-dimensional analysis. The locations of the unknown compounds in the GCxGC chromatogram can aid in tentative identification or compound-specific classification (for example, PBDEs, dioxins). Monitoring programs can benefit from the ability to screen for non-targeted analytes that could detect emerging contaminants, or catch illegal activity that would otherwise go unnoticed.
Reduce Solvent Usage with Simplified Sample Preparation
Sample preparation time can be long for pesticide residue analysis in food and agricultural samples. The QuEChERS (Quick, Easy, Cheap, Effective, Rugged, and Safe) sample preparation method is a multi-residue general extraction and cleanup method that has saved time-per-sample in high throughput food safety laboratories. The broad-based extraction approach is beneficial for a simultaneous multi-class residue analysis; however, co-extractive matrix components are also present in the extract and can interfere with targeted analytes. The second dimension separation space in a GCxGC analysis can be used for chromatographically removing interferences from pesticides of interest and reducing the burden of extensive cleanup procedures (Figure 3).
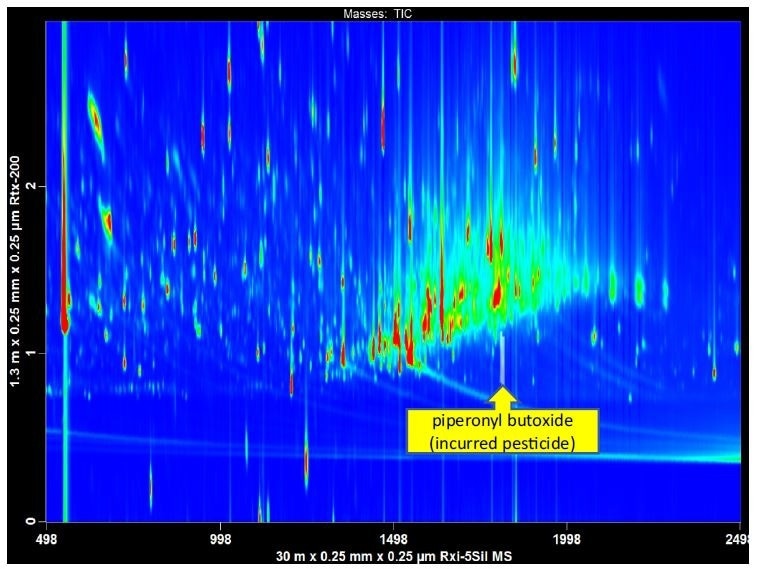
Figure 3. GCxGC-TOFMS was used to analyze a QuEChERS extract of finished tobacco. In a 1D-GC analysis matrix interference would have obscured the detection of a widely used pesticide ingredient, piperonyl butoxide. The automated peak find in the LECO ChromaTOF software identified piperonyl butoxide, with a library similarity of 876.
The QuEChERS approach to sample preparation has been modified for applications outside the scope of pesticide residues in vegetables and fruit. With a modification in extraction solvent, the QuEChERS approach can be employed for determining BFRs, PCBs, and polycyclic aromatic hydrocarbons (PAHs) in high fat animal feed ingredients (for example, fish oil, palm oil, rapeseed oil)[11]. A cleanup step is required before the injection on the gas chromatograph in order to remove the non-volatile lipids existing in the extract. Gel permeation chromatography (GPC) is commonly used to remove the co-extractive lipids, but is both solvent and time intensive.
A simple cleanup using silica solid phase extraction (SPE) columns can also be used for removing the majority of fat before analysis. Although the SPE cleanup may not provide as clean extracts as GPC, a GCxGC analysis can chromatographically resolve co-extractives that would interfere with a 1D-GC analysis. This simplified sample preparation method (QuEChERS extraction with silica SPE cleanup) was used in a validated screening method for PBDEs, PCBs, emerging BFRs, and PAHs in animal feed and ingredients using GCxGC with a time-of-flight mass spectrometer (GCxGC-TOFMS) for analysis[11].
Several marker compounds were chosen for each compound class, and they were detected at or below the established maximum regulatory limit (MRL). The validation method determined with high confidence (95%) that the screening method would properly flag non-compliant samples for further confirmation. To further expand the utility of the screening method, data processing was automated to rapidly identify other potential chlorinated or brominated contaminants. In addition, the comprehensive analysis of GCxGC-TOFMS delivers a complete record of a sample that can be used for retrospective data mining.
Decrease Manual Labor with Automated Peak Identification
Since the number of potential chemical contaminants increase (in the environment, people, food, animals, etc), the necessity for routine non-target screening methods also increases. One of the benefits of using GCxGC is the structured elution of components in a two-dimensional contour plot. With a non-specific detector like the ECD or FID, the contour plot can be used for grouping compounds based on their chemical class. When a mass spectrometer (MS) is used as a detector, unknown peaks can be further identified by searching a mass spectral library (for example, NIST).
In a 1D-GC analysis, library matching can be complicated when a number of coelutions corrupt the mass spectrum, thus resulting in poor quality search results. The quality of the search depends on the similarity of the selected spectrum to the reference mass spectrum. A GCxGC-TOFMS can help in unknown peak identification in a few ways. First, the extra peak capacity in GCxGC means more resolved peaks. If a peak is better resolved from surrounding interferences it is more likely to have a high library match (provided that the analyte in question is in the library). Second, a TOFMS can carry out spectral deconvolution that mathematically pulls apart spectral overlap for co-eluting analytes.
This also acts to “purify” a mass spectrum in order to obtain a better library match (Figure 4). Finally, due to these factors, the integrated software can automate the selection, search, and identification of unknown peaks and generate a peak table. Although the manual review is still essential for verifying the results of the automated peak find, the overall time to produce a list of identified peaks is greatly reduced.
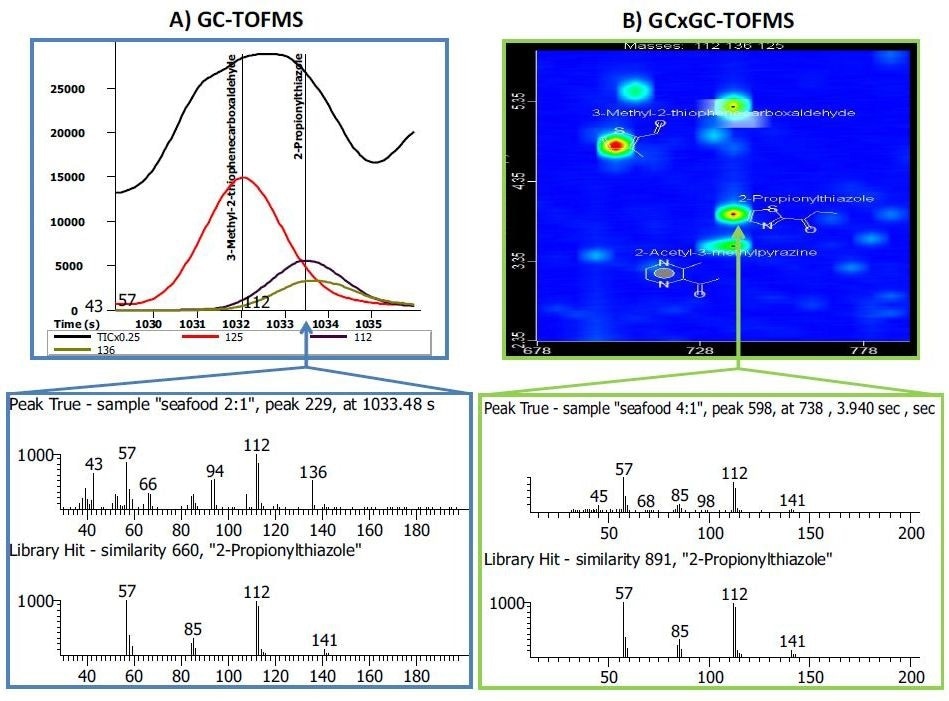
Figure 4. Side-by-side comparison of a GC-TOFMS and GCxGC-TOFMS analysis of the same pet food sample. A) In the GC-TOFMS mass spectrum, the flavoring compound 2-propionylthiazole had a library similarity of 660. Spectral deconvolution was not able to resolve (or identify) a co-eluting compound with m/z 136 in the peak true mass spectrum. B) In the GCxGC-TOFMS contour plot, the two co-eluting compounds were chromatographically resolved in the second dimension. The library similarity for 2-propionylthiazole was improved to 891 and the peak with m/z 136 was identified as 2-acetyl-3-methylpyrazine with a library similarity of 860 (not shown). Image courtesy of Joe Binkley, LECO Corporation
Accelerate Discovery with Increased Peak Capacity
One of the best (and most hyped) applications of GCxGC is to separate and then identify all of the individual components that make up a sample. Characterization of a sample can be fundamental to drug discovery, forensic investigations, and early disease diagnosis. When a GCxGC method is developed for maximizing chromatographic resolution (i.e. true peak capacity increase)[5, 15], a fingerprint of the sample can be obtained that is helpful for source apportionment in environmental forensics. The indicator molecules (i.e. biomarkers) are often small peaks in a GC chromatogram that can easily be obscured in a 1D-GC analysis (Figure 5).
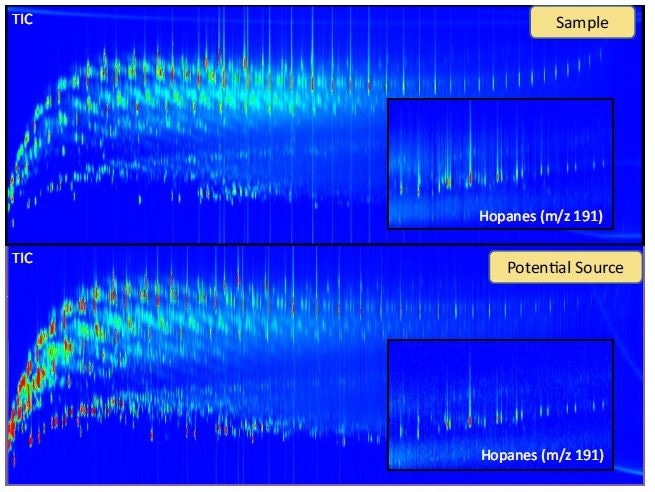
Figure 5. GCxGC-TOFMS contour plot of a tar ball sample and suspected crude oil source. Extracted ion chromatograms (XIC) are magnified to show the similarity between the two samples. The hopanes are molecular fossils that are resistant to weathering and are important biomarkers that aid in source apportionment. In a 1D-GC analysis, the hopanes are more difficult to identify due to interferences with late eluting hydrocarbons.
In metabolomics, small molecules have been known to be sensitive indicators of disease. These biomarkers are vital for the understanding of disease with the goal of treatment and prevention. A validated GCxGC-TOFMS method discovered 11 more statistically important biomarkers in human serum samples compared to a GC-MS method[10]. The enhanced resolution of the GCxGC analysis was vital to the discovery of additional biomarkers. Furthermore, the extra sensitivity afforded by the modulation process of the GCxGC system allowed using a 30:1 split injection instead of a splitless injection with the GC-MS method. A split injection is beneficial for reproducibility and increased column lifetime (less non-volatile material deposited onto the column).
Save Money with Economical Detectors
In order to quantify the minor components of a complex sample, increased resolution is essential through either the gas chromatograph or detector. Mass spectrometry is a powerful detector capable of spectrally resolving and identifying a number of co-eluting peaks. In a one dimensional GC-MS analysis, large concentration differences between co-eluting compounds, structural isomers, or multiple analytes eluting at the same time can decrease the utility of the MS. One method to increase the specificity of the MS is to use tandem mass spectrometry (MS/MS) or high resolution mass spectrometry (HRMS). These two detectors have their place in an analytical laboratory, but they are expensive to buy and also operate. Increasing the chromatographic resolution with GCxGC reduces the need for expensive mass spectrometer detectors. The FID is a robust, economical, and simple to operate detector.
Twenty laboratories were involved in an inter-calibration experiment employing certified reference materials of Gulf of Mexico Crude Oil (SRM 2779). The laboratories were tasked with reporting the levels of different crude oil constituents (for example, aromatics, saturated hydrocarbons, sterane and hopane biomarkers) in the NIST certified reference material[16]. Most of the laboratories used GC-MS for analysis, two laboratories used GCxGC-FID, and three laboratories used GC-MS/MS. Overall, the reported values using the GCxGC-FID agreed well with the NIST certified reference values.
The GCxGC-FID presented equivalent performance to GC-MS in the measurement of n-alkanes[17]. Only 8 of the 20 laboratories reported values for a list of several hopane and sterane biomarkers, one of which was the lab equipped with a GCxGC-FID. An additional advantage to using an FID in place of mass spectrometry is the ease of quantification, particularly for hydrocarbons. The reliable detector response of an FID decreases the need for multiple internal standards in order to achieve accurate quantitation.
Conclusion
Any leap in technology needs an initial investment of resources. Capital equipment purchases, instrument operation costs, and staff training are all factors when it comes to investing in GCxGC. Cautious buyers could question if the technique is viable in a routine environment, or how long will it take to realize a return on the investment. The examples in this article have provided a glimpse into the viability of GCxGC in a routine laboratory.
Saving time in sample preparation, instrumental analysis, and non-target data review can be an immediate payoff when a GCxGC system is implemented. The ability to analyze an extensive range of complex samples with the simultaneous target and non-target detection is an attractive prospect that can be leveraged in a competitive landscape. Comprehensive two-dimensional gas chromatography is no longer only research hype; it is indeed the separation science of the future. Are laboratories ready?
References and Further Reading
- M. Golay, Theory of chromatography in open and coated tubular columns with round and rectangular cross-sections, in: D.H. Desty (Ed.) Gas Chromatography 1958, Butterworths Scientific Publications, 1958, pp. 36-55.
- R.D. Dandeneau, E.H. Zerenner, An investigation of glasses for capillary chromatography, Journal of High Resolution Chromatography, 2(1979) 351-356.
- Z. Liu, J.B. Phillips, Comprehensive Two-Dimensional Gas Chromatography using an On-Column Thermal Modulator Interface, Journal of Chromatographic Science, 29 (1991) 227-231.
- LECO's Pegasus 4D The Next Dimension in GC-TOFMS Analysis, in: Pegasus 4D, St. Joseph, MI, 2002.
- J. Cochran, Eight Tips for Easy GCxGC, in, The Analytical Scientist, 2014.
- LECO, Simply GCxGC, in, 2017.
- H.G.J. Mol, H. van der Kamp, G. van der Weg, M. van der Lee, A. Punt, T.C. de Rijk, Validation of Automated Library-Based Qualitative Screening of Pesticides by Comprehensive Two-Dimensional Gas Chromatography/Time-of-Flight Mass Spectrometry, Journal of AOAC International, 94 (2011) 1722-1740.
- A.M. Muscalu, E.J. Reiner, S.N. Liss, T. Chen, G. Ladwig, D. Morse, A routine accredited method for the analysis of polychlorinated biphenyls, organochlorine pesticides, chlorobenzenes and screening of other halogenated organics in soil, sediment and sludge by GCxGC-μECD, Analytical and Bioanalytical Chemistry, 401 (2011) 2403-2413.
- M. Menéndez-Carreño, H. Steenbergen, H.-G. Janssen, Development and validation of a comprehensive two-dimensional gas chromatography–mass spectrometry method for the analysis of phytosterol oxidation products in human plasma, Analytical and Bioanalytical Chemistry, 402 (2012) 2023-2032.
- J.H. Winnike, X. Wei, K.J. Knagge, S.D. Colman, S.G. Gregory, X. Zhang, Comparison of GC-MS and GCxGC-MS in the analysis of human serum samples for biomarker discovery, J Proteome Res, 14 (2015) 1810-1817.
- P. López, M. Tienstra, A. Lommen, H.G.J. Mol, Validation of an automated screening method for persistent organic contaminants in fats and oils by GCxGC-ToFMS, Food Chemistry, 211 (2016) 645-653.
- A.M. Muscalu, The Determination of Polychlorinated Biphenyl Congeners (PCBc), Organochlorines (OCs) and Chlorobenzenes (CBs) in Water Samples by GCxGC-μECD, in, Ministry of the Environment and Climate Change Laboratory Services Branch, Toronto, Ontario, Canada.
- A.M. Muscalu, The Determination of Polychlorinated Biphenyls (PCBs) in Biota Samples by GCxGC-μECD, in, Ministry of the Environment and Climate Change Laboratory Services Branch, Toronto, Ontario, Canada.
- A.M. Muscalu, The Determination of Polychlorinated Biphenyl Congeners (PCBc), Organochlorines (OCs) and Chlorobenzenes (CBs) in Solids by Two-Dimensional Gas Chromatography Micro-Electron Capture Detection (GCxGC-μECD), in, Ministry of the Environment and Climate Change Laboratory Services Branch, Toronto, Ontario, Canada, 2017, pp. 65.
- M.S. Klee, J. Cochran, M. Merrick, L.M. Blumberg, Evaluation of conditions of comprehensive two-dimensional gas chromatography that yield a near-theoretical maximum in peak capacity gain, Journal of Chromatography A, 1383 (2015) 151-159.
- J.A.A. Murray, L.C.C. Sander, S.A. Wise, C.M. Reddy, Gulf of Mexico Research Initiative 2014/2015 Hydrocarbon Intercalibration Experiment: Description and Results for SRM 2779 Gulf of Mexico Crude Oil and Candidate SRM 2777 Weathered Gulf of Mexico Crude Oil, in, NIST National Institute of Standards and Technology, 2016.
- C.M. Reddy, S.A. Wise, L.C. Sander, J.A. Murray, Summary of results from the 2014/2015 Hydrocarbon Intercalibration Experiment (HIE), in, 2015.

This information has been sourced, reviewed and adapted from materials provided by LECO Corporation.
For more information on this source, please visit LECO Corporation.