Most fabric care products nowadays, such as laundry liquid detergent, laundry gel, or fabric softener, are liquid dispersions. These products are made up of many different ingredients but are known to be kinetically stable. This would mean that the mixture would not show any sign of instability, such as cloudiness, flocculation, and phase separation, throughout its shelf life. The fragrance or microcapsule component plays an important role in the perception of consumers regarding the product quality; however, adding fragrance into an already complex mixture may pose problems in stability.
The Turbiscan™ technology is a tool that allows the detection of variations in both clear and opaque samples. The variations are due to particles and micelle movements that are representative of the destabilization kinetics, including flocculation, phase separation, and sedimentation. Turbiscan™ is able to detect these processes weeks or processes prior visual control conclusions.

Reminder on the Technique
Based on Static Multiple Light Scattering, the Turbiscan™ instrument sends a light source (880 nm) on a sample and acquires backscattered or transmitted signal. Combining both backscatter and transmission detectors enables a wider reach of concentration range. The backward reflected light emerges from multiple scattering. According to the Mie theory, the signal intensity (BS) is directly related to different parameters:
BS = f (d, φ, np, nf)
Method
In this article, two different studies are presented:
- Fragrance-stability in a heavy-duty liquid detergent
- Instability in liquid detergent formulation
Fragrance-Stability in a Heavy-Duty Liquid Detergent
The objective of the study is to limit the effect of the fragrance on the final stability. In particular, three emulsions were studied:
- Stable un-perfumed liquid detergent (used as the target)
- Liquid detergent with original perfume
- Liquid detergent with optimized perfume
These formulations were analyzed using the Turbiscan technology at 45 °C for 7 hours. From this, the following graph was obtained.
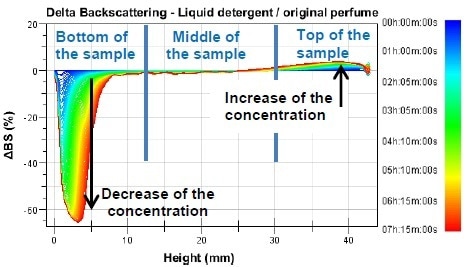
Figure 1. Backscattering variation for sample with original perfume
From the presented graph, a phase separation of the emulsion could be observed. As seen in the left side of the graph, light intensity decreases simultaneously along with the decrease of the oil concentration. Meanwhile, on the right side of the graph, an increase in light intensity corresponds to oil creaming.
It is possible to monitor the destabilization kinetics in the sample in relation to aging time. This is facilitated through the Turbiscan Stability Index (TSI) that sums up all variations detected in the sample, including variations in size, creaming, and clarification. The index also quantifies the variations with a single number. At a given time, a higher TSI would imply a worsening sample stability.
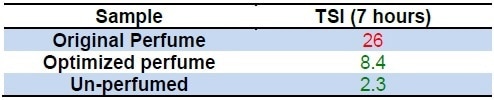
As presented in the second figure and in the table, the original perfume significantly affects the stability of the formulation. At the same time, the fragrance was optimized to meet an appropriate destabilization level that is based on internal criteria. Through the Turbiscan™ and its automatic TSI computation, the most stable fragrance formula in the liquid detergent based was identified in just a few hours, a relatively shorter time in comparison to visual observation that could take days or weeks to complete.
Study of instability reason in liquid detergent formulation
In a second study, an unstable liquid fabric softener was investigated in order to identify possible reasons of instability. A visual observation of the destabilization showed that a phase separation was forming. After a few days of storage at 3737 °C, the fragrance-free oil and encapsulated perfume floated at the top of the samples.
The formulation is comprised of a fragrance-free oil, encapsulated fragrance, and an unperfurmed based of the liquid softener. These ingredients were analyzed for 7 hours using Turbiscan™. The Turbiscan Stability Index was automatically computed from the software. The graph presented below was generated from the device.
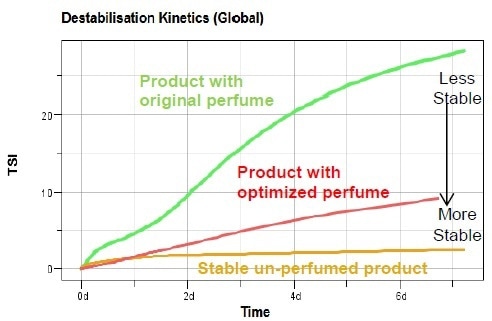
Figure 2. Turbiscan Stability Index for all samples
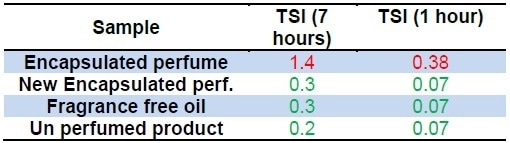
Table 1. Turbiscan Stability Index values for all samples
It took 7 hours to determine that the encapsulated fragrance was the main cause of the instability; however, with a tweaking of the TSI, the time of analysis was reduced to only 1 hour. Based on this finding, the fragrance system was modified and the instability issue was resolved. The following figure and table shows data from a new fragrance system that is free from instability.
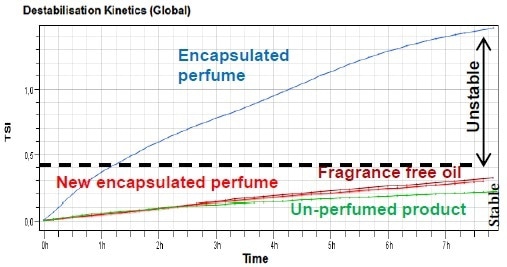
Figure 3. Turbiscan Stability Index for all samples
Table 2. Turbiscan Stability Index values for all samples
Conclusion
Turbiscan™ provides a quick, efficient, and simple method in order to characterize the fragrance effect on stability. Through the device, it became possible to easily identify reasons for instabilities in a formulated product. This was done by analyzing each phase separately and generating a data output. This process effectively addressed the issue and helped the the product’s improvement.

This information has been sourced, reviewed and adapted from materials provided by Microtrac MRB.
For more information on this source, please visit Microtrac.