The measurement of low levels of water in solvents is paramount to several chemical processes. The following communication discusses the measurement of the water concentration in solvents by utilizing fiber optic based, Near-Infrared (NIR) spectroscopy.
NIR is capable of being applied in real time mode for constant process monitoring or as a laboratory procedure. Through quick non-destructive analysis, the NIR technique saves time and money in either case. In addition, NIR provides the advantage of increased safety in comparison to traditional methods through utilizing remote sampling by fiber optics.
Measurement Background
The NIR segment of the electromagnetic spectrum includes information from the overtone and combination bands of the C-H, O-H, and N-H fundamentals. This information is connected to the chemical composition and is capable of being used for both quantitative and qualitative analysis.
As water has two strong absorption bands in the NIR, it is a brilliant candidate for carrying out low level measurements. The bands connected to water appear at 1,400 nm and 1,900 nm, the latter being the strongest.
The background solvent and water concentration decide the choice of band to use. Via measuring the NIR spectra of a sequence of samples of known water concentration, a quantitative model can be formed which will facilitate the measurement of water in upcoming samples based only on the NIR spectrum.
Experimental – Water in Methanol
The NIR spectra of a series of 22 samples of varying levels of water in methanol were measured between 1,000 and 2,100 nm by utilizing a Process Insights NIR-O™ Process NIR Spectrometry and a 1 cm pathlength cell at a constant temperature. Absorbance spectra of the samples with water concentrations in the range of 0% to 2% is shown in Figure 1.
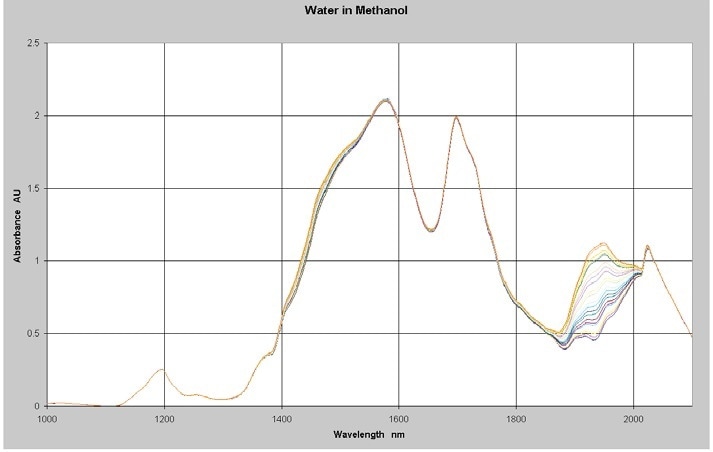
Figure 1. NIR Spectra of Water in Methanol 0-2%
The methanol causes the high absorbance levels in the data from 1,400 to 1,800 nm. This section of the spectrum is not necessary for water measurements and will be excluded from the analysis. Quantitative Partial Least Squares (PLS) calibration models was created from the spectra and concentration data using Camo’s Unscrambler™ multivariate analysis software. A discussion of the PLS regression method and other multivariate calibration techniques is available with Martens and Naes and ASTM E1655.
Results – Water in Methanol
Figure 2 shows the results of the data analysis. The model RMSEP cv (root mean square error of prediction for cross validation) was 507 ppm for the whole breadth of values. This is equal to around 1% of relative error on average. The experiment was carried out at constant temperature. Spectral data alterations are anticipated with temperature variations; however, this can be compensated for via including samples measured at different temperatures in the model.
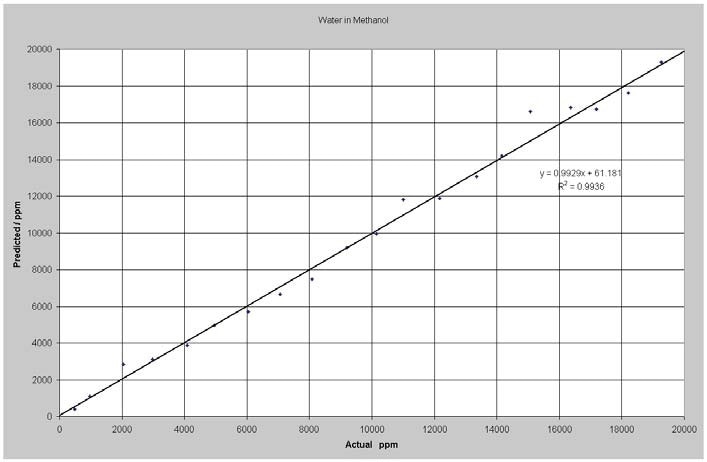
Figure 2. Predicted vs. Actual Water in Methanol
Experimental – Low Levels of Water in Hydrocarbon
To display lower levels of water measurement, the NIR spectra of a series of 17 samples with different levels of water in a hydrocarbon background were measured in the range from 1,100 nm to 1,600 nm using a Process Insights NIR-O Process NIR Spectrometer and a 3 cm pathlength cell. A longer pathlength is utilized to permit the use of the 1,400 nm peak. The absorbance spectra of the samples with water concentrations in the range of 0 to 1,500 ppm is showed in Figure 3.
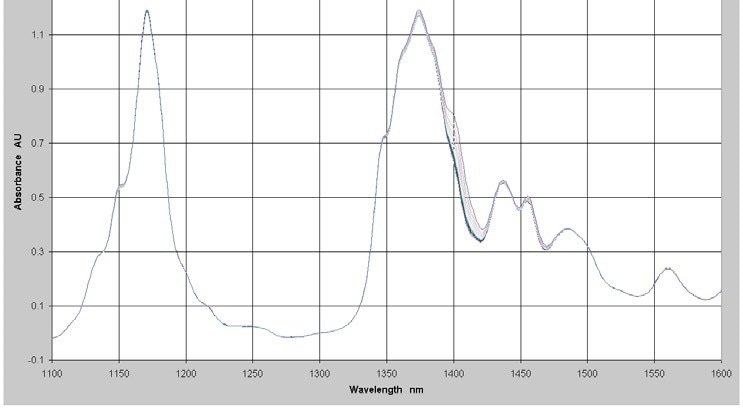
Figure 3. Absorbance Spectra - Low Levels of Water in Hydrocarbon
The water band is visible in the 1,400 nm area. This section of the spectrum was chosen for the regression analysis. To correct for baseline offsets, a first derivative was applied to the spectral data and the ensuing data used with the concentration data to make a quantitative model using PLS regression.
Results – Low Levels of Water in Hydrocarbon
Figure 4 illustrates the results of the low level water measurements. The model RMSEP cv (root mean square error of prediction for cross validation) was 16 ppm water. Water is capable of being detected at significantly lower levels in solvents lacking OH because there is less interaction between the base solvent and the water.
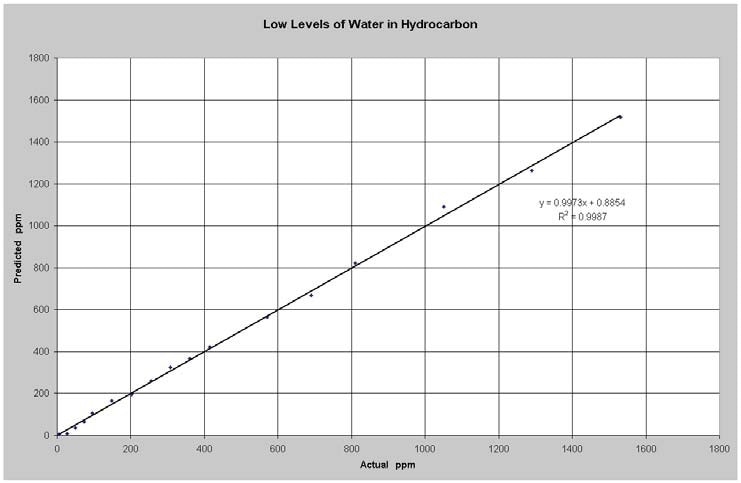
Figure 4. Predicted vs Actual Water in Hydrocarbon
Conclusion
The measurement of the water levels in solvents by NIR spectroscopy is both quick and dependable using the Process Insights hardware and software tools as expressed here. This method yields real-time (seconds) available results that make it a valuable tool for process measurement.
This method can be employed in either a process or a laboratory setting.
References and Further Reading
- H. Martens, T. Naes, Multivariate Calibration, John Wiley and Sons, 1989.
- ASTM E1655 Standard Practices for Infrared, Multivariate, Quantitative Analysis.

This information has been sourced, reviewed and adapted from materials provided by Process Insights – Optical Absorption Spectroscopy.
For more information on this source, please visit Process Insights – Optical Absorption Spectroscopy.