Most of the combustion properties of gasoline are determined by its aromatic content. It is desired to have accurate measurements of this parameter as it also impacts the fuel’s environmental characteristics. The conventional analytical method used for measuring aromatics is either an older method called fluorescent indicator adsorption (FIA) or gas chromatography (GC), both of which are time and labor intensive. This article explains the application of Process Insights hardware and software tools for measuring % aromatics in fuel products using fiber optic-based, Near-Infrared (NIR) spectroscopy. NIR can either be applied in real time directly in process monitoring or as a laboratory procedure. In both cases, NIR is a money- and time-saving alternative to conventional methods.
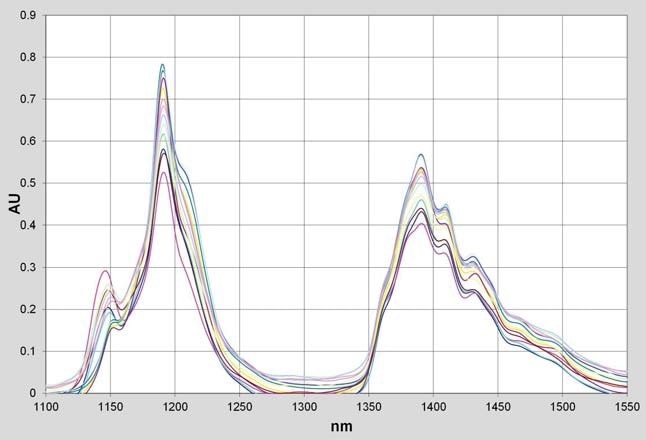
Figure 1. NIR Spectra of Gasoline Samples
Measurement Background
The NIR region of the electromagnetic spectrum enables the use of the overtone and combination bands of the O-H, N-H, and C-H fundamentals. A quantitative model can be developed by measuring the NIR spectra of a range of fuel samples of known aromatic concentration. This model will enable the measurement of % aromatics in future samples depending only on their NIR spectrum. Fiber optics is used by Process Insights analyzer systems to allow the sample probe to be placed in remote locations away from the spectrophotometer itself.
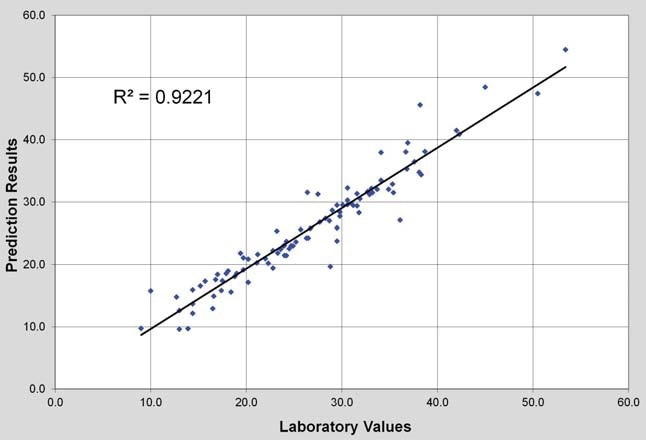
Figure 2. Laboratory vs NIR %Aromatics (scatter plot)
Experiment
Using a Process Insights NIR-O™ process analyzer spectrophotometer, the NIR spectra of a group of a large number of different process gasoline samples with known aromatics concentration ranging from 2.0 to 62.0% aromatics were measured between 1000 and 1600 nm. Shown in Figure 1 are the absorbance spectra of some representative gasoline samples obtained using an on-line process probe with a 1 cm pathlength. For this application, data preprocessing included a simple 2-point baseline correction to eliminate any offset. The concentration data and spectra were submitted to the UnscramblerTM software, and using PLS regression methodology, a calibration model was developed. For a discussion of PLS and other multivariate calibration techniques, refer Martens & Naes1 and ASTM E1655 2.
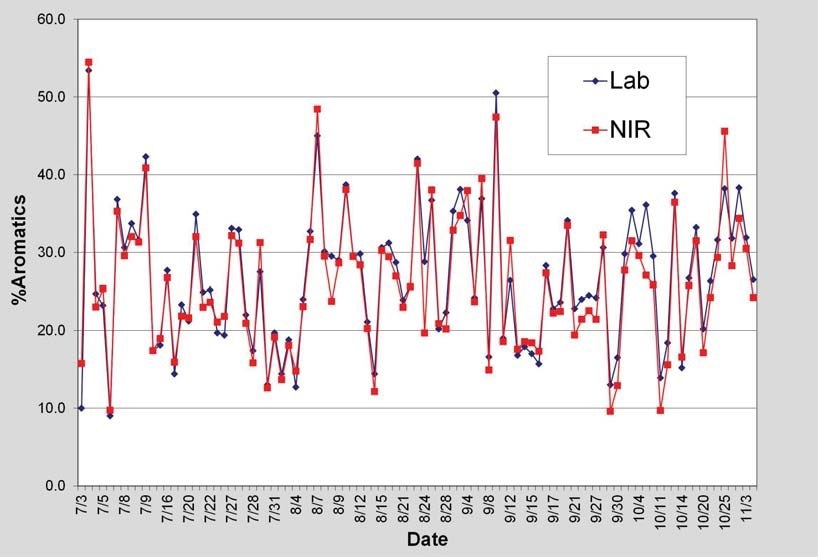
Figure 3. Laboratory vs NIR % Aromatics (trend plot)
Results
The model was used for predicting aromatic concentrations over a time period of three months. This was done by using an in-situ probe inserted in a gasoline process stream measuring in real time. In Figures 2 and 3, the results for this are shown as a scatter plot and a trend plot, respectively. The model yielded a prediction RMSEP (root mean square error of prediction) of 2.5% aromatics. This corresponds with the accuracy of the standard laboratory method.
Conclusion
By utilizing the Process Insights software and hardware tools described in this article, the measurement of aromatics in gasoline using NIR spectroscopy becomes both fast and reliable. This technique reduces the need for laboratory sample collection. There are results available in real-time (seconds) for aromatics content and various other parameters in other complex hydrocarbon streams.
References
- H. Martens, T. Naes, Multivariate Calibration, John Wiley & Sons, 1989.
- ASTM E1655 Standard Practices for Infrared, Multivariate, Quantitative Analysis.

This information has been sourced, reviewed and adapted from materials provided by Process Insights – Optical Absorption Spectroscopy.
For more information on this source, please visit Process Insights – Optical Absorption Spectroscopy.