Graphene is a crystalline allotrope of carbon with regular 2D properties. Existing in single sheets the carbon atoms are densely packed in a regular hexagonal grid much like an oversize aromatic molecule. Since the rediscovery and characterisation of graphene in 2004, an incredible amount of activity has been directed towards its study. This interest is motivated by the novel properties of graphene and its commercial potential. Its useful properties include exceptionally large electrical and thermal conductivity, high mechanical strength and high optical transparency. Graphene application areas, which can utilise these properties, include electronics, heat transfer, bio-sensing, membrane technology, battery technology and advanced composite materials.
Graphene or Graphite?
Graphene exists as a single atomic thickness sheet and graphene films are usually only between one and three layers thick. The special properties of graphene are only evident in these thin layers. In the case of thicker samples containing many millions of layers, the more common form of carbon is referred to as graphite. Development of technologies and devices based upon the unusual properties of graphene requires an accurate assessment of the layer thickness and quality.
Image Credit: Egorov Artem/Shutterstock.com
Methods of manufacture for graphene are quite sensitive and to retain consistency and quality, good analytical methods are vital. For large-scale manufacture of graphene there is a need for a method to easily and rapidly characterize the quality of graphene and other carbon nanomaterials to monitor and control production. Raman spectroscopy is the method of choice to provide a fast, non-destructive means of determining layer thickness and quality for graphene films.
Raman Spectroscopy
Raman is ideal for the characterization of carbon materials as it is extremely sensitive to geometric structure and bonding within molecules. It is a simple and non‐invasive technique, and is ideal because the carbon atoms are light, the sp2 σ bonds are strong, and the π‐electron‐related optical transitions range from the infrared up to the visible range. Even minor differences in the geometric structure of carbon lead to significant differences in the observed spectrum. Raman spectra of carbon nanomaterials like graphene are classically defined by three major bands; these are G-band, D-band, and 2D-band (also known as the G’-band). The Raman spectra of carbon nanomaterials are rich in data about their quality and their micro-structures such as crystallinity and level of disorder, and this is revealed by the peak positions, peak shapes, and peak intensities. This range of structural characteristics provides the many properties of the sp2‐bonded carbons that allow the high degree of sensitivity observed in Raman spectra of graphene systems including:
- high phonon frequencies
- sensitivity to strain and temperature
- strong electron‐phonon coupling and many‐body effects
- sensitivity to doping, functionalisation, environmental conditions, dimensionality, and optical resonances
- spectroscopy of single nanostructures and detailed analysis of their electronic structure
The G-band appears around 1582cm-1 and represents the graphene in-plane sp2 vibrational mode. This provides an idea of the crystallinity of the material. The peak ratio between the D-band and G-band of sp2 carbon material is highly significant. Dispersion of the G-band is observed in disordered graphene materials, where the dispersion is proportional to the degree of disorder. The D-band at around 1350 cm-1 is credited to the structural disorder near the edge of the microcrystalline structure that decreases the symmetry of the structure.
The Raman peak intensity ratio of these two bands, ID/IG, is therefore used to measure the degree of disorder of these materials. The ID/IG ratio is crucial to examine the uniformity of a sample as well as provide data on its disorder and any structural aberrations. For additional structural information the 2D-band that appears around 2700 cm-1 depending on the laser excitation wavelength is related to the number of graphene layers. There is also a linear increase in G band intensity as the number of graphene layers increases, which is typically seen in spectra collected with 532 nm laser excitation.
The Importance of Carbon Quality Control
Graphene can be produced in small quantities by ‘exfoliating’ layers from graphite. Although, large-scale production requires a different approach. An alternative is to grow graphene epitaxially from a crystal of silicon carbide at high temperature. To ramp up graphene production to the levels and precision required by the electronics industry, rapid measurement tools for quality control are essential. These tools need to be suited for on-line growth and production for the quality control used in industry. This is important in the scale-up from laboratory to factory to allow the industry to have confidence in graphene product quality.
Raman spectroscopy is ideal, but it can produce a huge amount of data and this needs to be rationalized for efficient quality control. Structural analysis of graphene materials can be accomplished by using parameterized principal component analysis (PCA) to handle the large data sets. Raman spectroscopy can be used for structural and functional characterization of sp2‐bonded carbon materials but is effectively automated for large-scale industrial applications for ease of use. PCA provides a methodology for large‐scale analysis and characterization of a wide variety of sp2 carbon materials looking at, for example, point defects, number of layers and functionalization as required. This could effectively be a Raman spectroscopy expert system to monitor production and keep the product in specification. However, as with many analytical methods, the degree of autonomy can be varied according to the requirements of research or manufacture.
B&W Tek Carbon Raman Analyzer (CRA)
This is a portable Raman system equipped with a 532nm laser excitation and fibreoptic sampling probe. The CRA features a high throughput spectrometer including back-thinned CCD TE-cooled to -25°C.
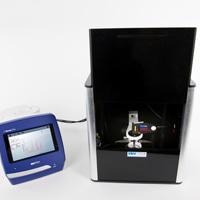
Unlike most other CRA’s on the market, B&W Tek’s product does not require the use of an additional microscope for analysis. It is ideal for materials in powdered forms, with no need for sample preparation. Additionally, the instrument includes a probe holder with an adjustable xyz stage for excellent reproducibility.
The B&W Tek Carbon Raman Analyser has the ability to monitor six variables simultaneously with real-time results displayed in a trend plot and a table. The system has automated spectral processing and can be configured to automatically calculate various parameters such as D- and G-band intensity ratios and G-band peak heights. This ease of use of CRA allows graphene manufacturers to obtain on-line measurements for material characterization, product quality control, and process monitoring. It is easy to set up gives definitive easily interpretable data, is non-destructive and needs no special preparation.
References and Further Reading
- Yu. S. Ponosov, A. V. Ushakov, and S. V. Streltsov, Electronic Raman scattering in graphite and single-layer and few-layer graphene, Phys. Rev. B 91, 195435, 22 May 2015
- Ahn, C.; Fong, S.W.; Kim, Y.; Lee, S.; Sood, A.; Neumann, C.M.; Asheghi, M.; Goodson, K.E.; Pop, E.; Wong, H.S.P. Nano Letters 2015, 15, 6809-6814.
- Zhi-Min Zhang, Shan Chen and Yi-Zeng Liang, Analyst, 2010, 135, 1138–1146.
- Michael J. Pelletier, Sensitivity-Enhanced Transmission Raman Spectroscopy, Applied Spectroscopy, Volume: 67 issue: 8, page(s): 829-840, August 1, 2013
- P Kalantri, Pushkar & Somani, Rakesh & T Makhija, Dinesh. (2010). Raman spectroscopy: A potential technique in analysis of pharmaceuticals. Der Chemica Sinica, 2010, 1 (1): 1-12
- Julia. A. Griffen, Andrew. W. Owen, Darren Andrews, Pavel Matousek, Recent Advances in Pharmaceutical Analysis Using Transmission Raman Spectroscopy, Spectroscopy, Volume 32, Issue 4, pg 37–43, Apr 01, 2017
- Campos, J. L. E., Miranda, H., Rabelo, C., Sandoz‐Rosado, E., Pandey, S., Riikonen, J., Cano‐Marquez, A. G., and Jorio, A. (2018) Applications of Raman spectroscopy in graphene‐related materials and the development of parameterized PCA for large‐scale data analysis. J. Raman Spectrosc., 49: 54–65.
This information has been sourced, reviewed and adapted from materials provided by B&W Tek.
For more information on this source, please visit B&W Tek.