Undergraduates in organic chemistry are usually exposed to nuclear magnetic resonance (NMR) spectroscopy with a specific focus on structure elucidation. However, quantitative NMR (qNMR)1,2 is still overlooked to a large extent, in spite of being increasingly significant in the chemical and pharmaceuticals sectors to assess the purity of samples.3
Moreover, quantitative analytical methods — that is, HPLC and GC analysis — introduced to undergraduates often employ the usual addition method in which the peak intensity is associated with a calibration curve created from samples of known concentration.4,5
Such a technique has also been used in qNMR spectroscopy,6 and although valid, methods employing an internal calibrant are known to be more accurate and lead to lower levels of ambiguity.7,8
In this article, the NMReady-60 is applied to measure the alcohol content in commercial liquors using two kinds of techniques. The first step involves the preparation of a calibration curve, while the second one involves the use of an internal calibrant. Furthermore, the data obtained from both the techniques will be compared and the benefits of applying an internal calibrant will be emphasized.
Procedure
Preparation of Calibration Curve
Ethanol solutions in D2O were initially prepared (5%, 10%, 15%, 20%, 25%, 30% v/v), and then, 0.6 mL of each solution was transferred separately to an NMR tube, and finally inserted into the NMReady-60. After equilibrating for a period of 5 minutes, the 1H NMR spectrum was eventually recorded in triplicate as follows:
- Spectral center: 5 ppm
- Spectral width: 20 ppm
- Receiver gain: 12dB
- Number of scans: 8
- Number of points: 4096
- Interscan delay: 32 seconds
- Pulse angle: 90°
- Dummy scans: 0
Within each spectrum, the ethanol triplet (δ = 0.84 ppm) was integrated and the absolute integral area was subsequently recorded. The known EtOH concentration versus the absolute integral area (as an average of the triplicates recorded for every concentration) was plotted to generate the calibration curve.
Preparation of Unknown Samples for Quantification via Calibration Curve
In an NMR tube 0.3 mL of the commercial liquor was mixed with 0.3 mL of D2O through a micropipette. The resultant sample was completely mixed and subsequently inserted into the NMR. The sample was then allowed to equilibrate for a period of 5 minutes, and this was followed by recording the 1H NMR spectrum in triplicate with calibration curve parameters. Using the absolute integral of the ethanol triplet, the alcohol content for individual samples was measured. This value in the calibration curve equation was used to calculate the alcohol content.
Preparation of Unknown Samples for Quantification via Internal Calibrant
An NMR tube was taken in which 0.3 mL of the maleic acid solution — prepared by dissolving 1.6354 g (≥ 99% purity) in D2O in a 5 mL volumetric flask — was added to 0.3 mL of the commercial liquor through a micropipette. The resultant sample was completely mixed and then mounted onto the NMR spectrometer. The sample was allowed to equilibrate for a period of 5 minutes, followed by recording the 1H NMR spectrum with the below parameters in triplicates:
- Spectral center: 5 ppm
- Spectral width: 20 ppm
- Receiver gain: auto
- Number of scans: 8
- Number of points: 4096
- Interscan delay: 28 seconds
- Pulse angle: 90°
- Dummy scans: 0
To measure the alcohol content, the triplet from the ethanol and the singlet from the maleic acid (δ = 6.09 ppm) in the 1H NMR spectrum were integrated. Then, the following equation was used:
 |
(1) |
Where,
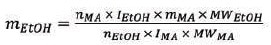
mEtOH = mass of ethanol
nMA = number of protons in the maleic acid singlet (2)
IEtOH = integral area of the ethanol triplet
mMA = mass of maleic acid (0.0981 g)
MWEtOH = molecular weight of ethanol (46.07 g/mol)
nEtOH = number of protons in the ethanol triplet (3)
IMA = integral area of the maleic acid singlet;
MWMA = molecular weight of malec acid (116.07 g/mol)
Equation 1 can be simplified as follows by substituting the known values:
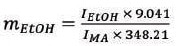 |
(2) |
From Equation 2, the mass of ethanol in individual samples was obtained, which can be converted to a volume by using its density (ρ = 0.789 g/mL). The volume percent of ethanol was established from this value.
Results and Discussion
As observed in the procedure, the acquisition of the 1H NMR spectra was accompanied by long interscan delays; this is very important to achieve accurate and reliable results. The duration of the interscan delay is directly proportional to the NMR sample’s T1 relaxation times and is usually set to the longest T1 relaxation time multiplied by five times to make sure that each nucleus in the sample has completely relaxed before applying the next pulse. To meet this criterion, the T1 relaxation times were determined for the triplet of the ethanol (~4–7 seconds) and the singlet of the maleic acid (~2 seconds) to identify an appropriate interscan delay.
Figure 1 shows the calibration curve produced by plotting the ethanol concentration against the absolute integral area. It was seen that the data points fitted quite well (R2 = 0.9992) to a linear equation that will be used for measuring the alcohol content in the commercially available liquor samples.
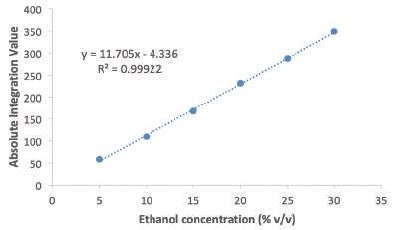
Figure 1. Calibration curve prepared to determine alcohol content.
The alcohol content of the commercial liquors was measured using the calibration curve and the results are shown in Table 1.
Table 1. Alcohol content measured via a calibration curve
| |
Alcohol Content (% v/v) |
|
|
| Commercial Liquor |
Manufacturer |
Experimental[a] |
% Error |
| Chambord |
16.5 |
15.94 |
3.39 |
| Frangelico |
20.0 |
19.71 |
1.45 |
| Disaronno |
28.0 |
27.57 |
1.54 |
| Crown Royal Apple |
35.0 |
34.88 |
0.34 |
| Grand Marnier |
40.0 |
38.96 |
2.60 |
| Bombay Sapphire |
40.0 |
38.74 |
3.15 |
[a] The experimental values are an average of 3 separate acquisitions.
It can be clearly observed that the results achieved correlate well with the alcohol content specified by the manufacturer for an array of samples, with percent errors spanning between 0.34 and 3.39.
A commercial liquor sample with an internal calibrant — maleic acid — is highlighted by a representative 1H NMR spectrum (see Figure 2).
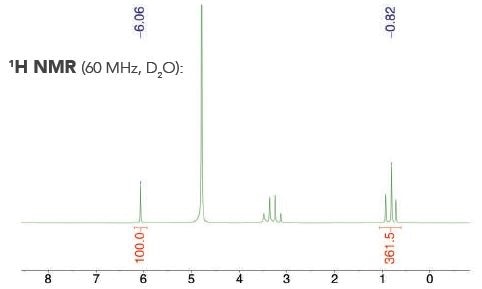
Figure 2. Example 1H NMR spectrum acquired to quantify alcohol content with an internal calibrant.
The singlet from the maleic acid is present at δ = 6.06 ppm, whereas the triplet from the ethanol in the commercial liquor appears at δ = 0.82 ppm. Table 2 shows the alcohol content established with the internal calibrant technique.
Table 2. Alcohol content measured via internal standard
| |
Alcohol Content (% v/v) |
|
|
| Commercial Liquor |
Manufacturer |
Experimental[a] |
% Error |
| Chambord |
16.5 |
16.81 |
1.88 |
| Frangelico |
20.0 |
20.38 |
1.90 |
| Disaronno |
28.0 |
27.94 |
0.21 |
| Crown Royal Apple |
35.0 |
35.7 |
2.00 |
| Grand Marnier |
40.0 |
39.67 |
0.83 |
| Bombay Sapphire |
40.0 |
40.05 |
0.13 |
[a] The experimental values are an average of 3 separate acquisitions.
Excellent correlation can be seen between the alcohol content established with the NMReady-60 and the alcohol content reported by the manufacturer. In addition to negating the necessity to prepare a separate calibration curve, the internal calibrant also provided more precise results when compared to those acquired with the calibration curve, with lower percent errors spanning between 0.13 and 1.90.
Conclusions
This article showed how the NMReady-60 was effectively used in the experiment to accurately determine the alcohol content of a wide range of commercial liquors. Here, two techniques were used and complementary results were acquired. Nevertheless, when an internal calibrant was used, more accurate results were determined and preparation of a calibration curve was also eliminated. Moreover, the experiment can be easily carried out and offers an excellent introduction to the principles and use of qNMR in undergraduate laboratory settings.
Data Accessibility
The NMReady-60 enables data to be processed directly and printed. It is also possible to export the data directly to a USB or networked file, where it can be worked up using third-party NMR processing software.
References and Further Reading
- Pauli, G. F.; Jaki, B. U.; Lankin, D. C. J. Nat. Prod. 2007, 70, 589.
- Pauli, G. F.; Chen, S.; Simmler, C.; Lankin, D. C.; Gödecke, T.; Jaki, B. U.; Friesen, J. B.; McAlpine, J. B.; Napolitano, J. G. J. Med. Chem. 2014, 57, 9220.
- Malz, F.; Jancke, H. J. Pharm. Biomed. Anal. 2005, 38, 813.
- Rice, G. W. J. Chem. Educ. 1987, 64, 1055.
- Ferguson, G. K. J. Chem. Educ. 1998, 75, 467.
- Rajabzadeh, M. J. Chem. Educ. 2012, 89, 1454.
- QUANTITATIVE NMR—Technical Details and TraceCERT® Certified Reference Materials, https://www.sigmaaldrich.com/content/dam/sigma-aldrich/docs/Sigma-Aldrich/Brochure/1/qnmr-brochure-rjo.pdf (accessed Mar. 4, 2019).
- Hill, R. A; Nicholson, C. P. J. Chem. Educ. 2017, 94, 1965.
This information has been sourced, reviewed and adapted from materials provided by Nanalysis Corp.
For more information on this source, please visit Nanalysis Corp.