What is the Krumbien / Sloss Chart?
An established geologist, William Christian Krumbein (1902–1979) was known to chase innovative methods in Geology, making great use of mathematics. The Krumbein Medal of the International Association for Mathematical Geology (IAMG) award was named after him. This award was first introduced in Sydney in 1976, at the 25th International Geological Congress.
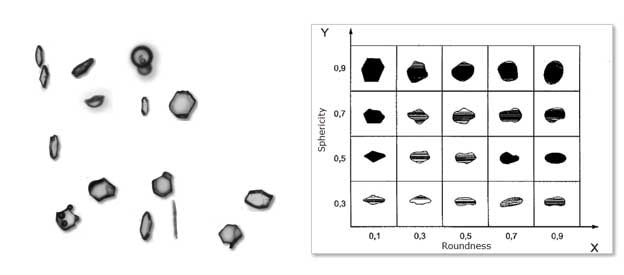
Image Credit: Vision Analytical Inc.
Krumbien is also famous for his “Krumbein Scale”, which was a method to measure the roundness, or sphericity, of particles. Krumbien and L. Sloss published this scale in Stratigraphy and Sedimentation in 1963. From then on, this became more frequently known as the Krumbien and Sloss Chart.
The chart consists of two axes. Sphericity is on the Y-axis and roundness on the X-axis. The chart contains a series of particle images with various sizes and shapes. From the research of several articles, it appears that the sphericity on this chart is defined as the diameter ratio between the biggest inscribed and the smallest circumscribing sphere. Roundness is defined as the average radius of curvature of surface features in relation to the radius of the maximum sphere that can be attributed to the particle.
While using this chart practically, the roundness and sphericity of particles being analyzed are visually compared against the chart and are allocated a value based on this visual estimation. W. C. Krumbein and L. L. Sloss, Stratigraphy and Sedimentation, San Francisco, W. H. Freeman, 1963.
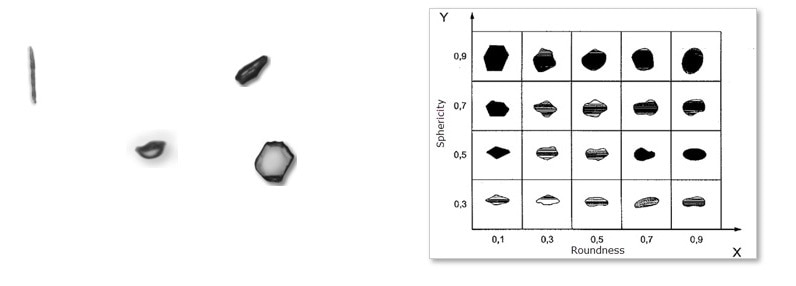
Image Credit: Vision Analytical Inc.
Potential Difficulties from Visual Comparisons
In 1963, the Kroumbien and Sloss Chart was a breakthrough. It became a method to partially quantify soils and sediments based on shape. When referring to a specific sample, a scientist could qualify a sample based on an estimated sphericity and roundness value when viewed using a microscope. This was a moderately radical development.
However, the method did present possible problems. For example, the user bias that this method would have. One person comparing particles to the K&S chart may differ from another operator. Based on the requirement to use microscopy, there was the fact that not many particles could be analyzed, therefore, statistical importance of the few particles estimated may not have been a satisfactory reflection of the total population. Additionally, the particles’ visual estimates were all conducted from a two-dimensional perspective.
At the time, it was brilliant progress in the qualification of samples, but as technology developed, there would be new methods to make improvements on this visual estimation.
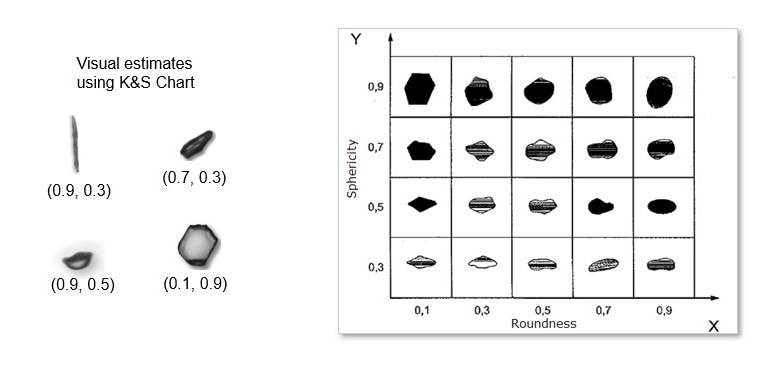
Image Credit: Vision Analytical Inc.
New Automated Methods
Since the introduction of the Krumbien and Sloss Chart, there have been a variety of innovative new techniques developed and commercialized for particle size. HIt was not until recent decades that more automated shape measurement systems have been designed. A greater amount of automated methods have enabled the analysis of a more representative sample, reduced bias with the use of a consistent and computerized measurement technique and the ability to view particles three-dimensionally.
Dynamic Image Analysis is a way to analyze the size and shape of moving particles. These instruments can make measurements of tens of thousands of particles in seconds ensuring a representative measurement is taken of the sample. Additionally, this automated method gets rid of user bias and, in a lot of instances, allows a random orientation that enables a three-dimensional analysis of all the particles measured.
Although such automated equipment exists, there is not a lot of published information that helps the transfer of an existing method to an increasingly automated one. To rectify this, below is an attempt to take the Krumbien and Sloss Chart and transfer the methodology to Dynamic Image Analysis.
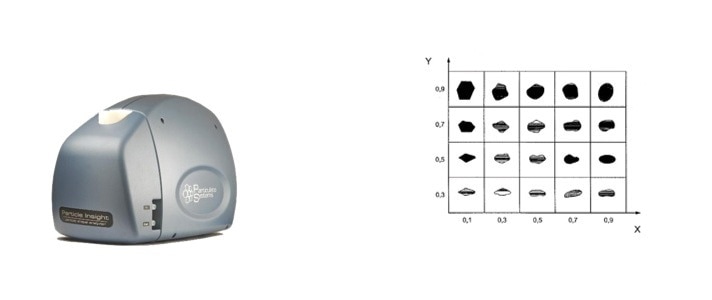
Image Credit: Vision Analytical Inc.
Based on the Krumbein and Sloss Comparison chart for roundness and sphericity, illustrated below, it is hard to understand the difference between what “roundness” is and what “sphericity”” is. Roundness appears to infer a two-dimensional image and how near it is to a circle. Sphericity appears to be a reference beginning from a flat particle, in two dimensions to an elliptical or round particle.
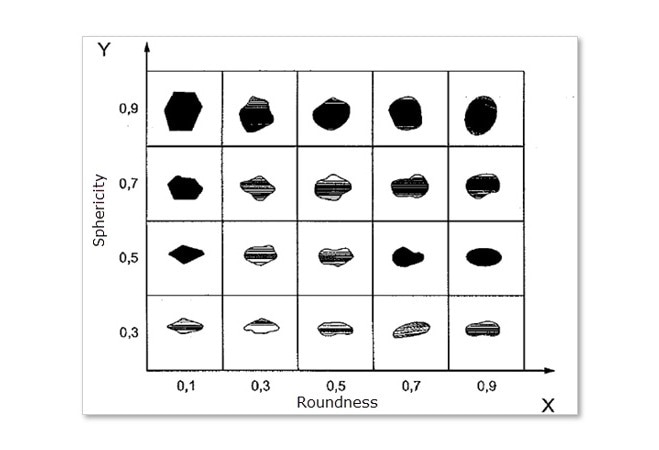
Image Credit: Vision Analytical Inc.
To make the best comparison to Dynamic Image Analysis, the individual images in the Krumbein and Sloss chart have been allocated numbers as illustrated below and visual observations have to be recorded that can be transferred to dynamic image analysis.
Making a visual observation, by viewing the bigger particles, as “roundness” grows, or for example, image #16 to #20, the particles are becoming smoother but their aspect ratios remain comparable. Additionally, as particles increase in “sphericity” or, for example, as they go from image #1 to #16, the particles appear to be growing in circularity and their aspect ratios appear to approach nearer a 1:1 ratio.
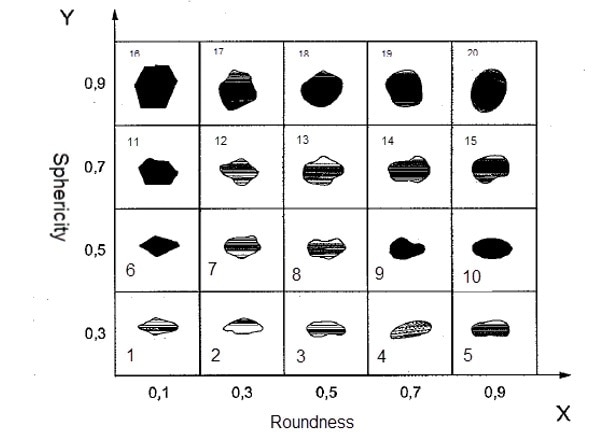
Image Credit: Vision Analytical Inc.
A high-resolution scan was taken of the Krumbein and Sloss chart and processed with the use of the software of a dynamic image analysis system, the Particle Insight. In the following, the scanned image and the application of the Feret aspect ratio shape measure can be seen.
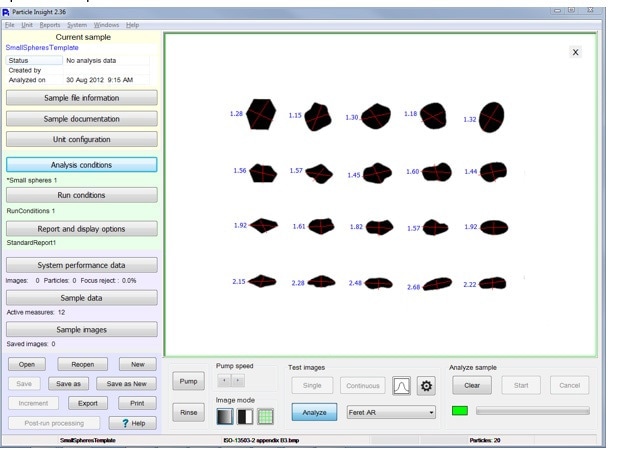
Image Credit: Vision Analytical Inc.
As the visual observation of the Krumbein and Sloss chart appears to be a selection of circularity, smoothness and aspect ratio, the individual Krumbein and Sloss particles were all analyzed with the use of the Particle Insight software for each measure and put into tables.
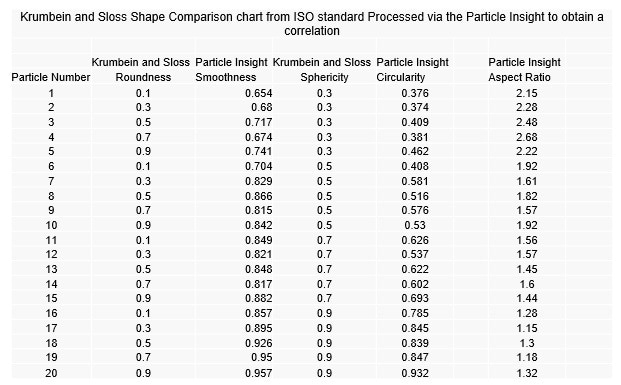
Image Credit: Vision Analytical Inc.
X-Axis Equivalence
It cannot be assumed that as the “roundness” factor increases on the X-Axis it would be the same as an increase in Particle Insight “circularity” shape measure. As can be seen, there are a few particles that move from left to right (increasing “roundness”) have some decrease in circularity.
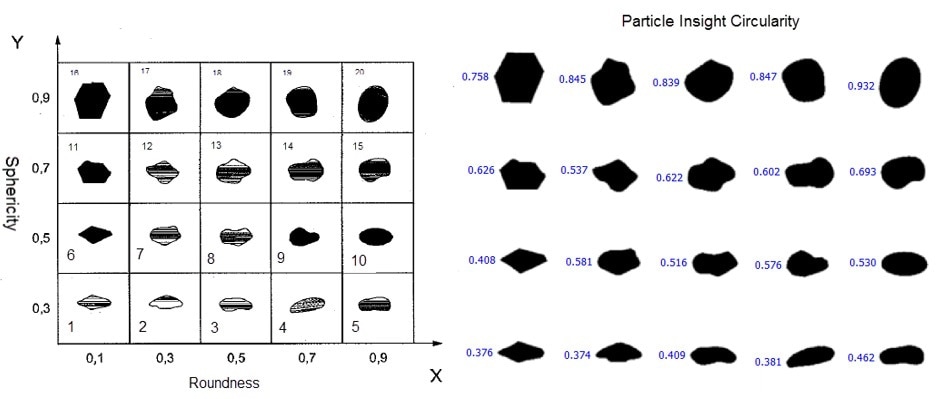
Image Credit: Vision Analytical Inc.
Y-Axis Equivalence
It also cannot be assumed that as “sphericity” factor increases on the Y-Axis it would be equivalent to an increase in the Particle Insight “smoothness” shape measure. What can also be seen is that there are a few particles that, as they go from top to bottom, (increasing “sphericity”) have some decrease in values of smoothness.
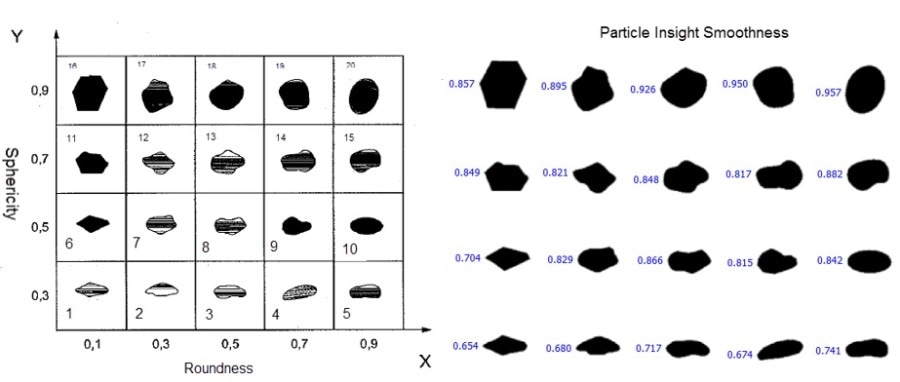
Image Credit: Vision Analytical Inc.
Y-Axis Equivalence
An equivalent measure to the Krumbein and Sloss Comparison chart for “sphericity” (Y-axis) would be aspect ratio as shown below.
Therefore, the Y-Axis the Particle Insight would be able to automate and substitute the sphericity measure with aspect ratio and the X-Axis would be able to combine circularity and smoothness.
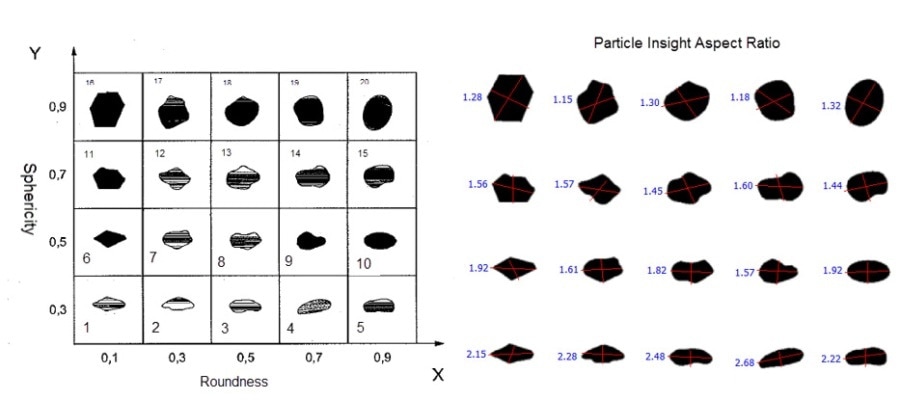
Image Credit: Vision Analytical Inc.
Practical Example of K&S Conversion to Dynamic Image Analysis
To apply this conversion practically, we illustrate here a Bauxite Frac Sand sample classified and on sale to the public as a #20/40 product. This classification is indicative of the expectation that the particle size is to be between a 20 mesh sieve and a 40 mesh sieve. This is the same as 850 and 425 microns in equivalent circular diameter in size.
It is vital to consider that classification by general sieves is conducted by stacking sieves and, once the segregation is finished, the weight in each sieve is used to ascertain what percent of the population is in each size class. It is also vital to realize that this process also assumes that particles are spherical. However, as will be demonstrated, not every particle is spherical.
The particles under analysis here are described as a synthetic bauxite-based proppant with medium mechanical strength which would suit fracturing gas and oil wells that involve contained high pressures of up to 10,000 psi.
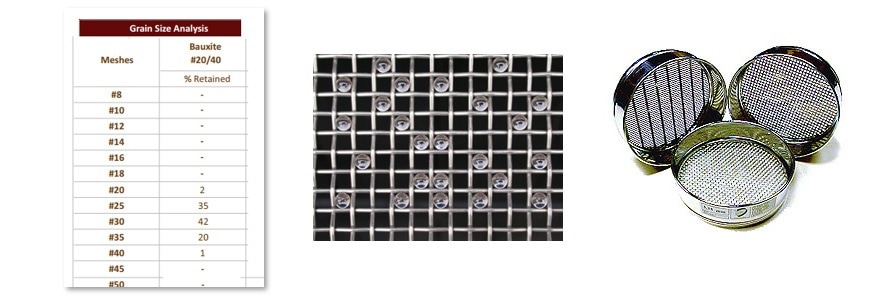
Image Credit: Vision Analytical Inc.
Sieve Correlation for Size
Many applications find results based on sieving methods a necessity. Below, we report the size of a Frac Sand sample based on not only size with the assumption particles being round (Equivalent Circular Area Diameter) but also correlated to sieve analysis.
Possessing an automated method such as Dynamic Image Analysis to grant further details on a variety of shape measurements, including size and correlation to sieve results, allows the end-user to move on from older methods (sieving) to the more automated methods.
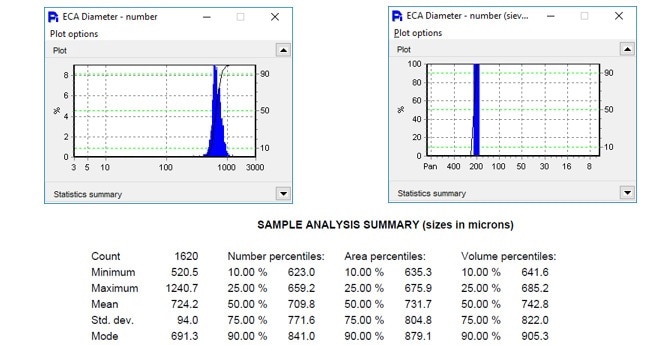
Image Credit: Vision Analytical Inc.
Sieve Correlation for Size
Below are some of the thousands of analyzed particles. As can be viewed from the sizes illustrated, a lot are relatively round, but some are not. A few also have bigger aspect ratios.
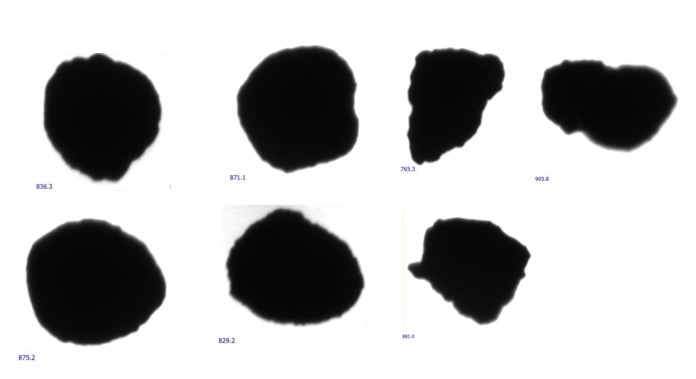
Image Credit: Vision Analytical Inc.
Correlation for Shape
When Dynamic Image Analysis is applied to the Krumbein Sloss Chart, the ability to gain more precise measures of not only circularity and size but also smoothness is attained. Taking that into account, particles can be chosen that are itemized as #12 through #20 as identified in the Krumbien and Sloss Chart. By making use of the analyzed equivalents, the values of these chosen particles can be obtained through the use of the Particle Insight software limits.
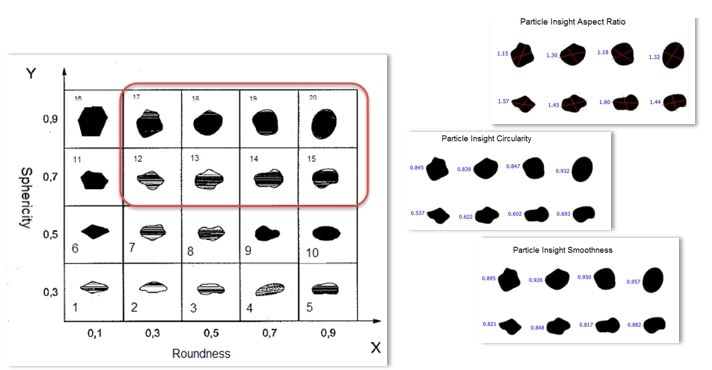
Image Credit: Vision Analytical Inc.
Correlation for Shape
Following the analysis of the Krumbien and Sloss Chart with the Particle Insight, the shape limits for the desired shapes are entered into the filter criteria to analyze the sample results based on the wished-for limits. From this, the particle listings, thumbnail images and histogram data can be analyzed for each particle that fits the criteria.
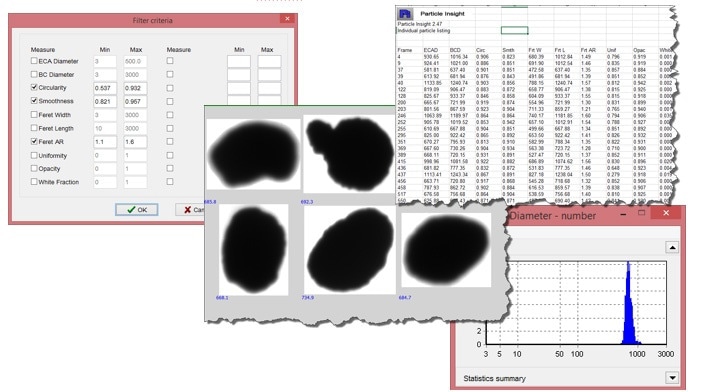
Image Credit: Vision Analytical Inc.

This information has been sourced, reviewed and adapted from materials provided by Vision Analytical Inc.
For more information on this source, please visit Vision Analytical Inc.