In NMR experiments, magnetizations that are perpendicular to the static magnetic field B0 will rotate about the B0 field at its typical Larmor frequency. This phenomenon is commonly known as chemical shift precession.
The magnetizations - apart from the chemical shift precession - will also emerge under the effect of the mutual coupling between the spins: the scalar or J-coupling.
While the evolution of the chemical shift accounts for the position of a specific resonance in the spectrum, the J-coupling happens to be the source of the peak splitting patterns. The evolution is controlled by the chemical shift when the J-couplings are small, when compared to the variance between the resonance frequencies of the coupled spins. This might be true because either the B0 field is high or the pair of spins is split in the molecule by many bonds, creating a small coupling.
In certain experiments, it is preferred to suppress the evolution of the chemical shift and enable the spin system to emerge only under the J-coupling. This is usually called isotropic mixing.
The chemical shift evolution can be suppressed by applying an intense RF pulse along a selected direction while making sure that the magnetizations remain aligned with the field. This is known as spin-locking, and the RF field is called the spin-lock field.
There are several techniques that manipulate composite pulses developed to offer a spin-lock. In such cases, imperfections in the RF-pulse can be constantly refocused to offer a clean spin-lock. The DIPSI (Shaka, AJ, Lee, CJ, and Pines, A, Journal of Magnetic Resonance 77(2), 274-293, 1988) and MLEV-17 (Bax, A and Davis, DG, Journal of Magnetic Resonance 65, 355-360, 1985) are the two most common techniques.
TOCSY
Total correlation spectroscopy, or TOCSY in short, can be described as a homonuclear 2D experiment analogous to COSY; in COSY, the J-coupling between two hydrogen nuclei appears as a crosspeak in the spectrum. But unlike COSY, the detection of the coupled spins is not restricted to the closest neighbors. During spin-locking, the TOCSY experiment manipulates the isotropic mixing condition to generate crosspeaks between all hydrogen nuclei forming part of a continuous chain of coupled spins.
A chain of four hydrogens - labeled A, B, C, and D - can be considered. Here, hydrogen A is linked to B that is linked to C, which, in turn, is linked to D. In a COSY experiment, a crosspeak would occur between the hydrogen nuclei in the following pairs of positions - that is, (A,B), (B,C), and (C,D). On the contrary, the hydrogens’ TOCSY spectrum would display crosspeaks between all pairs of hydrogen nuclei, as shown in Figure 1.
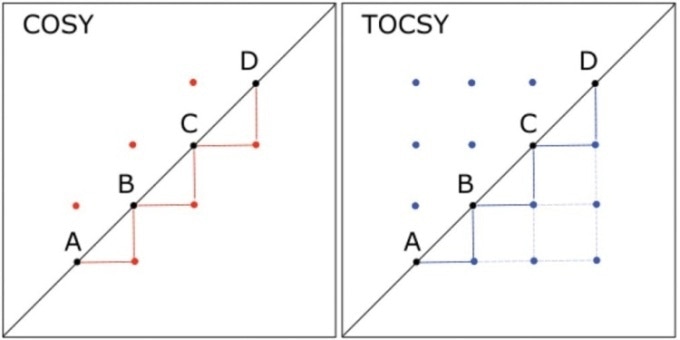
Figure 1. Comparison of 2D COSY and 2D TOCSY spectra for a hypothetical molecule in which hydrogen A is coupled to hydrogen B, which is coupled to C, which in turn, is coupled to D. Lines are drawn to connect the peaks below the diagonal, illustrating the throughbond connectivity shown by each spectrum; heavier lines indicate couplings shown in both spectra, and lighter lines indicate connectivity shown in the TOCSY spectrum but not the COSY.
To further explain this concept, the molecule trans-2-hexenoic acid depicted in Figure 2 (top) is considered. The molecule’s 1D 1H NMR spectrum shows six resonances (see Figure 2, bottom).
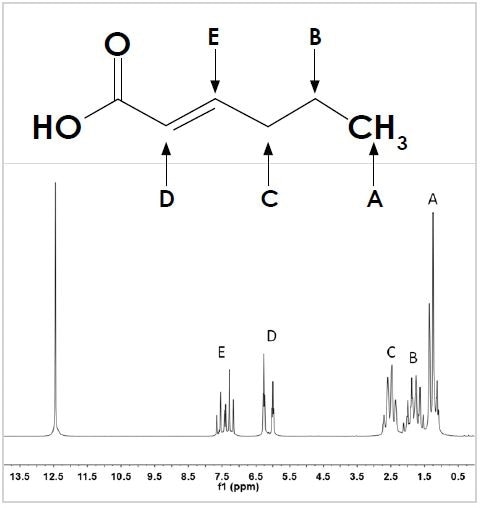
Figure 2. The structure (top) and 1D 1H spectrum (bottom) of trans-2-hexenoic acid. Hydrogen positions on the carbon backbone are labeled A to E to identify the appropriate resonance in the spectrum. The unlabeled singlet at 12.5 ppm corresponds to the –OH group of the carboxylic acid.
Five of these resonances have been labeled A to E corresponding to the hydrogens coupled to the molecule’s carbon backbone, while the sixth one corresponds to the –OH of the carboxylic acid group. All the resonances A to E display peak splitting that corresponds to the way in which they are attached to the neighboring hydrogens.
As illustrated in Figure 3, the COSY spectrum shows the coupling between (A,B) and (B,C) and between (C,D) and (D,E). In addition, it reveals the coupling between C and E, which may occur as a result of the double bond between D and E; this can lead to a more robust coupling between C and E than between D and B, for example.
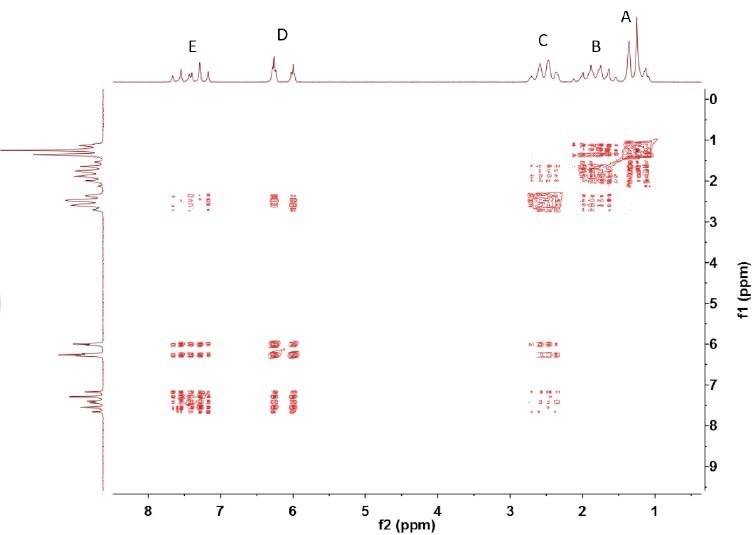
Figure 3. COSY spectrum of trans-2-hexenoic acid
The TOCSY spectrum (see Figure 4) reveals the coupling between all pairs of hydrogen nuclei. This demonstrates the fact that resonances A to E contain a single continuous chain of coupled spins.
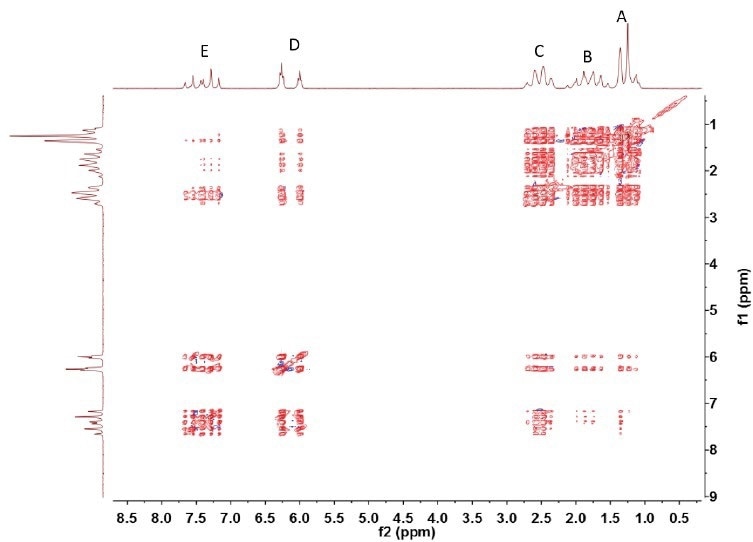
Figure 4. Spin-lock was implemented using MLEV-17
If Figure 3 is compared with the TOCSY spectrum of ethyl crotonate in Figure 5, it can be observed that the ethyl crotonate contains two separate chains of spins - the ethyl group, resonances A and C, and the crotonyl group, resonances B, D, and E.
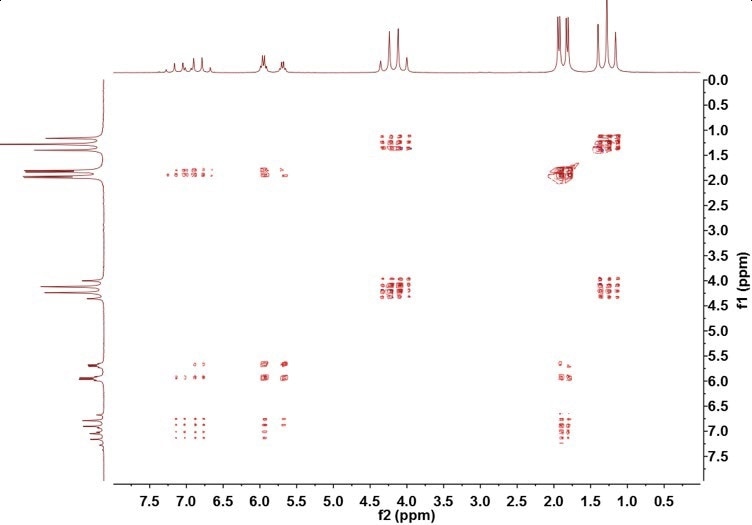
Figure 5. TOCSY spectrum of ethyl crotonate
The absence of crosspeaks between the two sets of spins demonstrates the presence of a nucleus that successfully breaks the J-coupling chain; in this example, the nucleus is the oxygen from the ester coupling.

This information has been sourced, reviewed and adapted from materials provided by Oxford Instruments Magnetic Resonance.
For more information on this source, please visit Oxford Instruments Magnetic Resonance.