The images obtained from confocal Raman imaging provide information for samples with micron spatial resolution. The images are based on molecular structure and are highly sensitive to small changes in chemical and physical properties.
Furthermore, confocal Raman imaging facilitates the non-destructive analysis of subsurface features in semi-transparent, non-turbid samples (dependent on optical properties this can be up to several hundred micrometers deep). This process is done without the need to cross-section or expose the inner parts of the sample. It is possible to generate three-dimensional chemical images through the collation of Raman images collected at different depths within a sample.
Complicating factors not encountered during surface analysis that result in aberrations and reduced quality of results can be introduced through the collection of images from within a sample using standard (metallurgical) microscope objectives. Paraxial light focuses differently from off-axis light (spherical aberration) when light passes through a material that has a refractive index greater than air (n >1).
As shown in Figure 1, the focal point is blurred as a result of this spherical aberration, and this effect escalates with increasing depth into the sample. The 3-D image appears compressed along the z (focus) axis due to this distortion of the actual sampling depth. Additionally, the spreading of the focus also causes a loss of spatial resolution and Raman intensity.
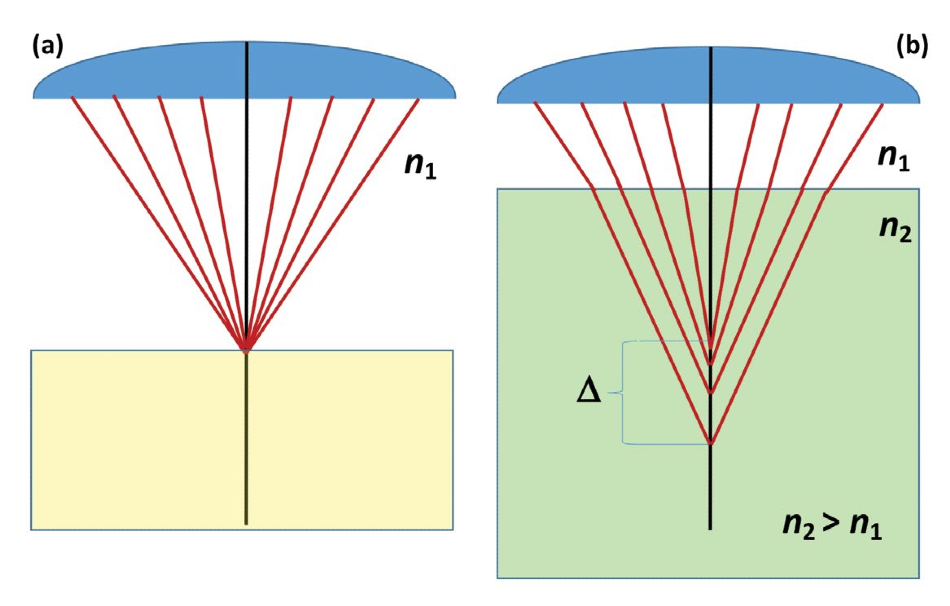
Figure 1. (a) Focus on a sample surface with air as the intermediate medium between the objective and the focal point. (b) Focus within a transparent sample with a higher index of refraction where spherical aberration causes a blurring of the focal point.
Some of this lost spatial resolution is recouped through the use of an aperture to achieve confocal imaging as this limits the collected signal to the region around the focal point. However, this comes with a reduction in Raman intensity. The reduction means the full 3-D imaging potential of Raman microscopy is not unlocked with traditional microscope objectives.
This loss of fidelity can be corrected for using mathematical corrections. However, these vary in complexity and completeness in addressing the aberrations. It is also not possible to recover the loss of Raman intensity and spatial resolution. More in-depth information on these mathematical and semi-empirical corrections can be found elsewhere and will not be discussed further in this article.1,2
Alternately, immersion objectives can be used to address the aberration optically. The spherical aberration can be reduced or eliminated by filling the gap between the objective and sample with an index matching fluid (rather than air). Put simply, this restores the lost spatial resolution and Raman intensity and removes the bending of the light at the surface of the sample.
Oils with an index of refraction around n ≈ 1.5 (a value similar to many polymeric materials) are typically used by oil immersion objectives. A higher numerical aperture (better effective focus and resolution) is also facilitated with the use of oil, which increases the collected Raman intensity. Additionally, the impact of sample shape is reduced by oil immersion, and ultimately superior 3-D Raman imaging results are produced.
This article presents examples illustrating the use of an oil immersion objective with the Thermo Scientific™ DXR3xi Raman Imaging Microscope in order to improve the 3-D Raman imaging of buried or subsurface structures.
Experimental
A Thermo Scientific™ DXR3xi Raman Imaging Microscope and the accompanying Thermo Scientific™ OMNIC™xi Software were used to create the 3-D Raman images presented here. Both tools for straightforward collection of 3-D Raman data sets and built-in tools for the generation of the 3-D Raman images using interactive 3-D visualization features are contained in the OMNICxi Software.
An Olympus™ MPlanN 100X BD objective was used to collect imaging data as the representative metallurgical objective and an Olympus™ PlanApo 100X for oil immersion objective imaging data. The immersion oil used was non-fluorescent with an index of refraction of 1.516. For all Raman images, a 532 nm laser with a power of 10 mW at the sample was used.
Results and Discussion
The investigation of multi-layer polymer composites is a common application of Raman confocal depth analysis.
For this example, the selected layered polymer composite was approximately 124 μm thick and consisted of 5 distinct layers. Using both the metallurgical and immersion objectives a 30 μm x 30 μm x 135 μm volume was analyzed with an image pixel size of 1 μm in x, y, and 1 μm steps in the z-direction. An enhanced performance was demonstrated with the immersion objective in three key aspects: accurate layer thickness measurement, increased signal-to-noise, and enhanced spectral purity.
The 3-D Raman images, based on MCR (multiplicative curve resolution) and obtained using both a metallurgical objective (a) and an oil immersion objective (b), are shown in Figure 2. Layers can be automatically segmented using MCR analysis through OMNICxi without requiring any direct knowledge of the Raman spectral features of the components before analysis.
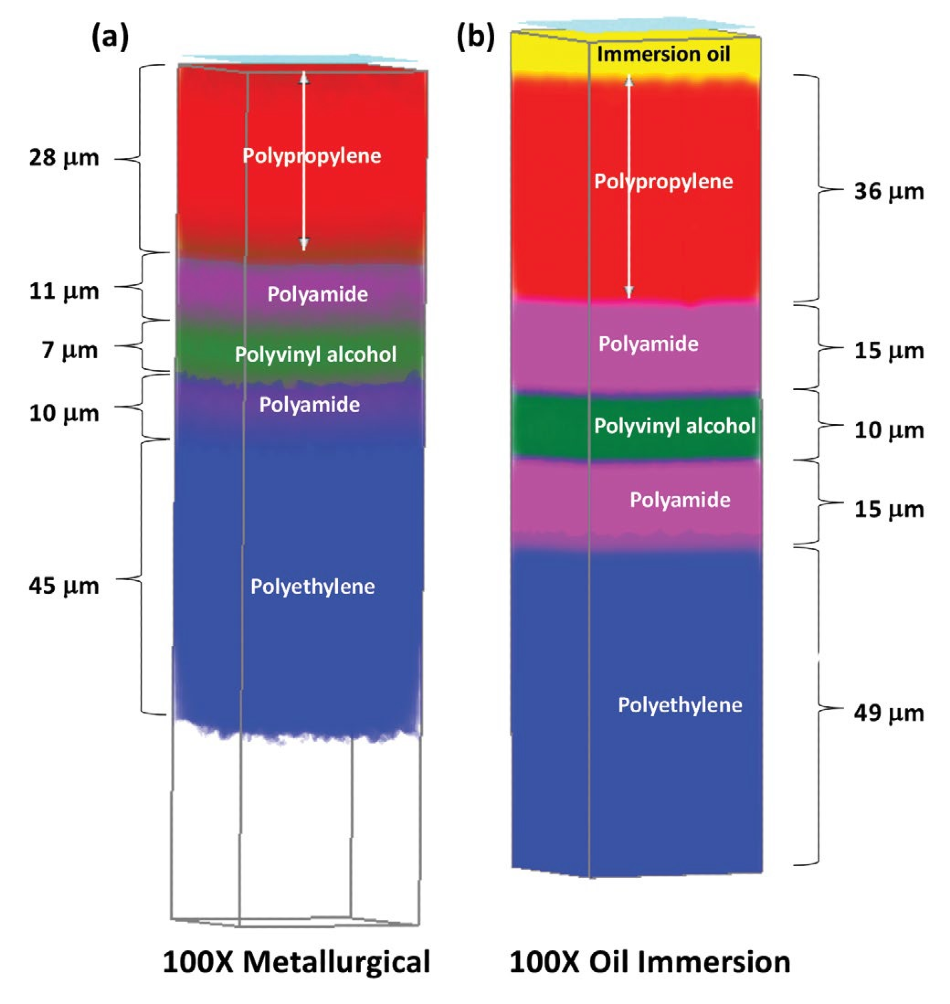
Figure 2. (a) 3-D Raman image based on a MCR analysis of a layered polymer composite film using a metallurgical objective. (b) 3-D Raman image based on a MCR analysis of the same layered polymer composite film using an oil immersion objective. The analysis with the oil objective shows clearer, more well-defined layers than with the metallurgical objective.
For comparison, the results of 2-D imaging of a physical cross-section of the same polymer composite are shown in Figure 3. There is significant compression of the layers when using the metallurgical objective in comparison to what is seen in both the 3-D image using the oil immersion objective and the 2-D image taken from the cross-section.
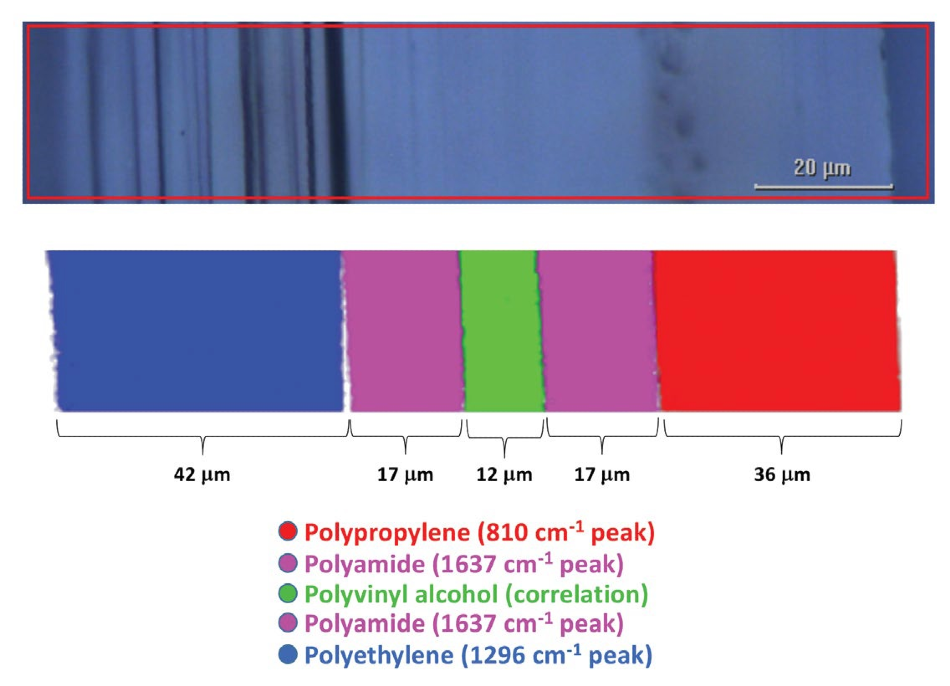
Figure 3. 2-D Raman image and visual image of a cross-section of the layered polymer composite. This reference measurement shows layer thicknesses that agree well with a 3-D Raman image using an oil immersion objective.
There is a close agreement between the layer thicknesses determined from the 3-D image collected with the oil immersion objective and the 2-D image of the cross-section. The layers in the confocal 3-D image using the metallurgical objective are also clearly not as well defined and experience a blurring of the focus and a loss of spatial resolution.
The lack of clarity leads to increased mixing of the spectral features at the interfaces. Some additional uncertainty in terms of the thickness determinations is also a result of this. Superior results for measuring layer thickness are produced through the use of an immersion objective.
A substantial increase in Raman intensity is one further advantage of using the oil immersion objective. A comparison of Raman spectra from a location in the middle of the polyvinyl alcohol layer from the two 3-D confocal imaging data sets is shown in Figure 4. The green spectrum represents the oil immersion objective and provides spectra with roughly 3 times the Raman intensity and signal to noise ratio (S/N).
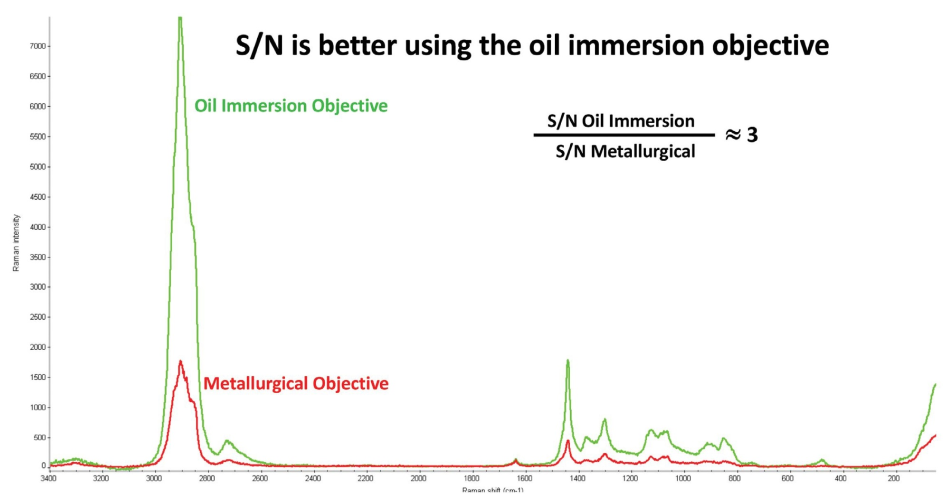
Figure 4. Spectra from the polyvinyl alcohol layer in the layered polymer composite film illustrating at least a 3-fold increase in both Raman intensity and signal to noise ratio (S/N). The S/N ratios were calculated from the intensity of the peak at 1441 cm-1 and the root mean squared noise calculated in the region from 2300-2200 cm-1.
Finally, better spectral separation between the various polymer layers is shown by 3-D chemical images acquired with the immersion objective. The polyvinyl alcohol layer is sandwiched between two layers of polyamide in this sample, which have a strong Raman band at 1635 cm-1. A measure of spectral separation can be made through a comparison between the relative intensity of this spectral feature and that of a polyvinyl alcohol band (1441 cm-1). In Figure 5, the blue trace represents a reasonably pure polyvinyl alcohol spectrum acquired from the cross-section image.
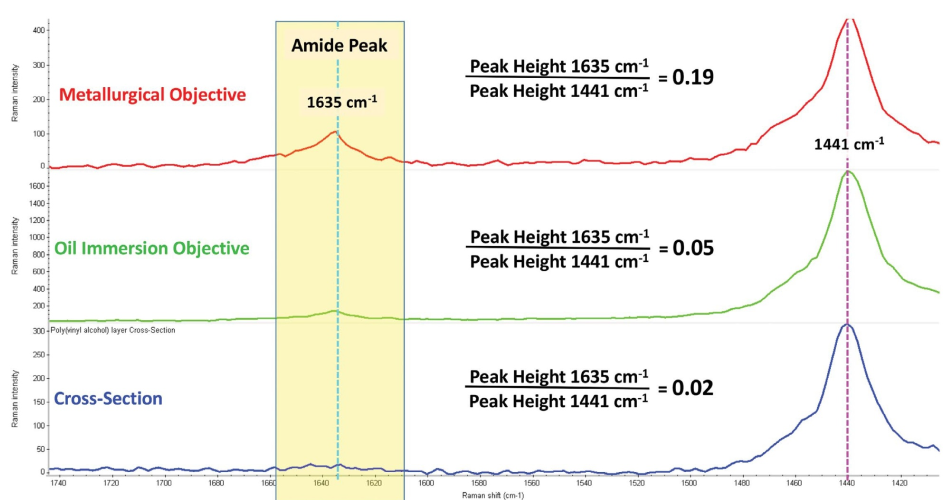
Figure 5. Spectra from the polyvinyl alcohol layer in the layered polymer composite film from the 3-D confocal data sets using both the metallurgical objective (red) and oil immersion objective (green) and from the 2-D image of the physical cross-section (blue). The peak height ratios (1635 cm-1 / 1441 cm-1) give a measurement of the spectral contributions from the neighboring polyamide layers and illustrate the reduced spectral contributions of adjacent layers when using the oil immersion objective for 3-D confocal Raman imaging.
This essentially shows no Raman feature at 1635 cm-1. The red trace in Figure 5 represents a spectrum of polyvinyl alcohol extracted from the 3-D volume using the metallurgical objective. This highlights a small but distinct contribution from polyamide, which will result from spectral mixing between the layers.
However, with the oil immersion objective, represented by the green trace, there is a significant reduction in the relative contribution from the neighboring polyamide layers. This suggests that superior results are achieved with the oil immersion objective for this type of 3-D confocal Raman depth imaging.
In turn, this results in a more precise layer thickness measurement, improved spectral purity from each layer, and an overall increased signal-to-noise for the measurement. There is no need for the additional complexity of cross-sectioning the sample as the results are comparable to the analysis of the cross-section.
The effects of refractive index differences can be exacerbated by non-planar shapes and surfaces. However, in this situation immersion objectives can also be applied. The Raman imaging of polystyrene spheres, approximately 25 microns in diameter (Polysciences, Inc.), are one example that illustrates this. Both a standard metallurgical objective and an oil immersion objective were used to image a polystyrene sphere on a glass microscope slide.
Figure 6 displays the results. In addition to a significant loss of Raman intensity, as shown on images c and d, there is an elongation and distortion along the z-axis with the metallurgical objective for the bottom half of the sphere. This is due to refraction. To a lesser extent, it is also due to reflection effects caused by the curved surfaces of the sphere and the refractive index difference in comparison to the surrounding air.
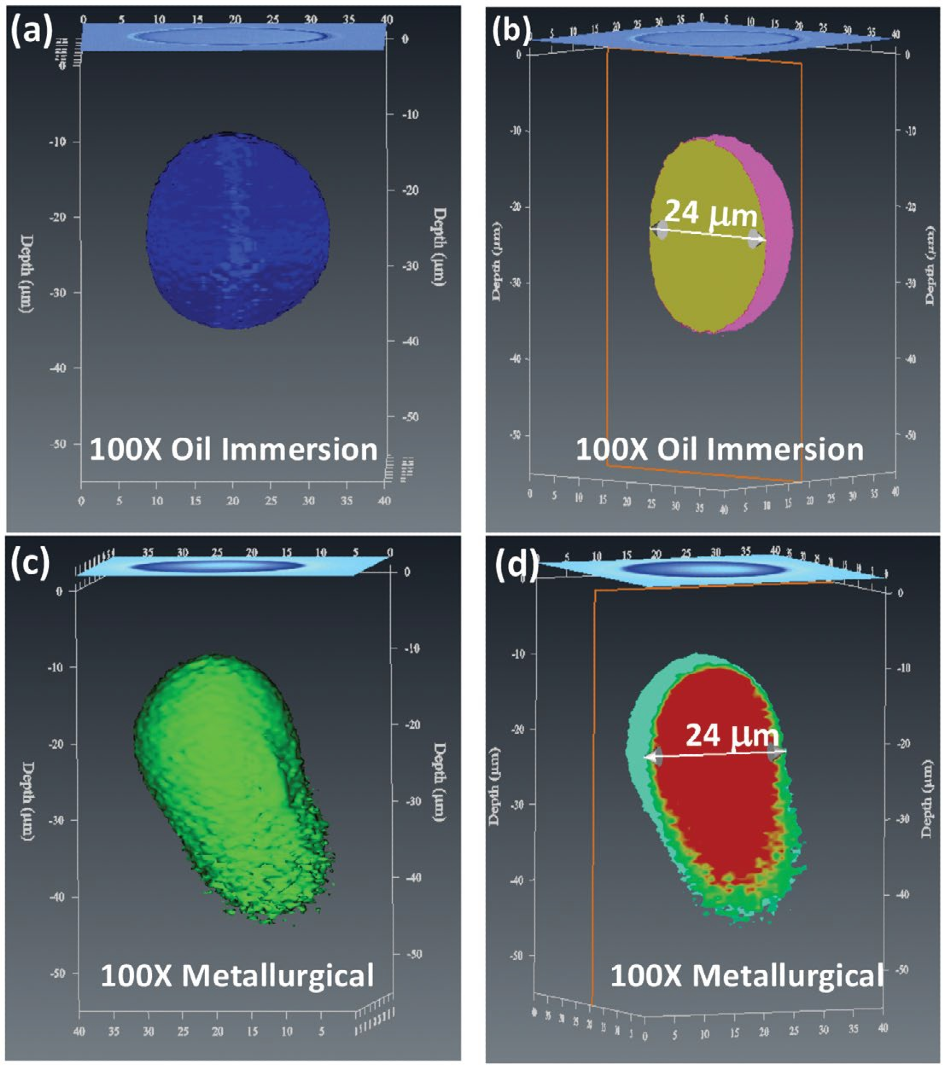
Figure 6. (a) & (b) Raman images of a 25 μm polystyrene sphere collected using an oil immersion objective, (c) & (d) Raman images of the same 25 μm polystyrene sphere collected using a metallurgical objective. The oil immersion images show an accurately reproduced sphere, while the metallurgical objective image shows significant distortion.
As seen in images a and b, a clear sphere without an elongated tail along with a more well-defined edge is shown with the same sphere imaged with an immersion objective. This illustrates that additional complicating factors can be introduced due to the shape of the sample, combined with differences in refractive indexes when performing 3-D Raman imaging. However, once more the use of an oil immersion objective can help to reduce these effects.
These principles also apply to samples that have both distinct layers and non-planar features, such as a bi-component fiber. In bi-component fibers, there are two components that are not mixed together and instead have discrete arrangements within the fiber (for example, side by side, segmented, core-sheath). These are engineered to make the most of different properties of the constituents.
There is a core-sheath arrangement in the bi-component fiber imaged here. The fiber has a diameter of approximately 20 microns and has an outer sheath of Nylon 6 and an inner core of Nylon 6,6. The results of 3-D confocal imaging of the fiber, based on an MCR analysis, are shown in Figure 7. Images d, e and f are those taken using a metallurgical objective and images a, b and c are those taken with an oil immersion objective. Just as in the polystyrene sphere example, the Raman intensity drops significantly toward the bottom of the fiber when the metallurgical objective is used, to the extent that the bottom part of the fiber is not defined at all.
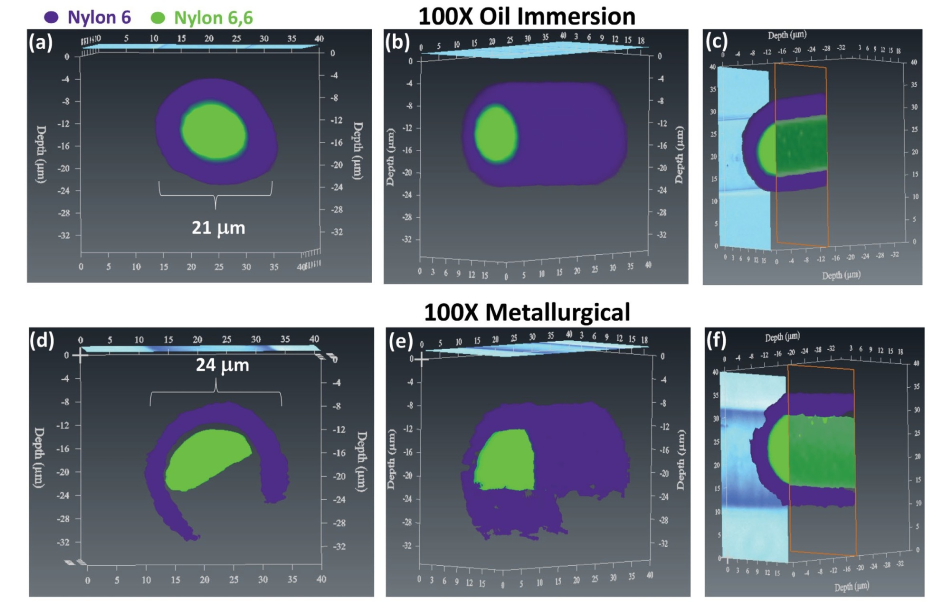
Figure 7. (a), (b), (c) Confocal 3-D Raman MCR images of a bi-component fiber (Nylon 6,6 (green) and Nylon 6 (purple), core-sheath arrangement) collected using an oil immersion objective. (d), (e), (f) Confocal 3-D Raman MCR images of the same bi-component fiber collected using a metallurgical objective. Views (c) and (f) show slices looking up along the z-axis of the 3-D Raman MCR images for the oil and metallurgical objectives respectively.
In the location of the boundary between the core and sheath there is also a clear uncertainty. A well-defined, reasonably symmetric cross-section was revealed through a 3-D image of the same fiber collected using an oil immersion objective.
It proved problematic when attempts were made to physically cross-section this 20-micron fiber in a similar way to what had been done with the layered polymer composite. A physical deformation of the fiber was the result of a straightforward method for mounting and cross-sectioning the fiber. More rigorous mounting techniques, for example resin embedding, would have significantly increased the complexity and the time taken. A nondestructive solution requiring no complex sample preparation was provided by 3-D confocal Raman imaging using the oil immersion objective.
Conclusions
Subsurface imaging of semi-transparent samples without the need to physically expose the interior of the sample is possible with confocal 3-D Raman imaging. Metallurgical objectives may excel at surface analysis, however, when used to probe the interior of samples, they suffer the effects of spherical aberration. Mathematical corrections can be applied to partially account for the effects of spherical aberration, but it is not possible to fully compensate for the loss of spatial resolution and Raman intensity.
Using oil immersion objectives is an effective approach for optically addressing this problem. It can also increase the performance of subsurface imaging for many materials, including most polymers. With DXR3 Raman microscopes, oil immersion objectives are standard accessories and their straightforward implementation has the potential to unlock the power of 3-D Raman imaging in any laboratory.
References and Further Reading
- N.Everall, J. Raman Spectrosc. 2014, 45, 133-138
- M.P. Miguel, J.P. Tomba, J. Raman Spectrosc. 2013, 44, 447-452

This information has been sourced, reviewed and adapted from materials provided by Thermo Fisher Scientific – Materials & Structural Analysis.
For more information on this source, please visit Thermo Fisher Scientific – Materials & Structural Analysis.