The goals and objectives of the experiment were to use FTIR and Raman spectroscopy in the development of a methodology for the isolation and analysis of microplastic particles.
Use filters that allow direct spectroscopic analysis in order to isolate microplastic particles from solutions.
Use image analysis to determine the size and shape of the microplastic particles.
Use FTIR or Raman spectroscopy to identify the type of microplastic through matching to spectral databases.
Experimental
A commercially available 500 ml bottle of drinking water was used as the drinking water sample.
Both the silicon filters and the filtering apparatus were taken from the Thermo Scientific™ Microparticle Sample Preparation Kit.
As shown in Figure 1, a Thermo Scientific™ Nicolet™ iN10 MX FTIR Microscope or a Thermo Scientific™ DXR2 Raman Microscope was used to carry out the particle analysis.
Automated particle analysis was carried out using the Particle Wizard option in the Thermo Scientific™ OMNIC™ Picta™ Software for the iN10 MX FTIR Microscope and the Thermo Scientific™ Altµs Particle Analysis option in the Thermo Scientific™ OMNIC™ for Dispersive Raman Software for the DXR2 Raman Microscope.
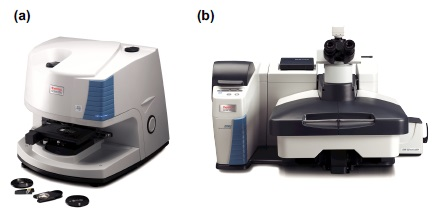
Figure 1. (a) Thermo Scientific Nicolet iN10 MX FTIR Microscope, (b) Thermo Scientific DXR2 Raman Microscope.
Sample Preparation
Filtration is normally used to isolate microplastic particles.
Direct analysis should be enabled with the chosen filter material.
When evaluating the different types of filter materials in Table 1, the following aspects were considered:
- Is it compatible with both FTIR & Raman? (Same type of filter for both)
- Does it give a good visual image? (Crucial for image analysis)
The best overall choice was the silicon filter.
Table 1. Evaluation of common types of filters.
| Filter type |
Advantages |
Disadvantages |
FTIR |
Raman |
|
Gold coated Polycarbonate

|
Readily available |
Does not lay flat
Expensive |
Good choice for reflection |
Possible to see polycarbonate peaks through gold
Some broad baseline offset with some lasers |
|
Silver

|
All metal
Less expensive than gold coated |
More rigid than gold coated PC
More of a textured surface at high magnification
More reactivesurface - reported problems with pH of carbonated water |
Reasonable for reflection – less reflective than gold |
Some spectral artifacts from filters themselves (highest with 20X but less at higher magnification) |
|
Al2O3

|
Readily available
More rigid
Transmitted light possible if intense enough
Less expensive option |
Delicate – easily broken Visual images – contrast an issue – surface not clearly defined. Some features on surface that might be detected as particles |
Can be used in transmission but limited to > 1250 cm-1
Some spectral peaks and some variation in peaks over the filter.
Reflection weak |
Some Raman spectral contributions from the filters – broad features
Baseline offsets
Laser light transmits through |
|
Silicon

|
Rigid
Good visible images |
Square
Needs gasket development
Fragile
Expensive |
Transmission
Some variation across filter (filter background: (Si-O)) – broad baseline offset
Reflection not as good as gold |
Silicon peaks |
Modifications to Filtering Apparatus
- The filtering apparatus required adapting in order to accommodate square silicon filters. As shown in Figure 2, gaskets were added to protect the brittle silicon filters and to modify the shape of the glassware.
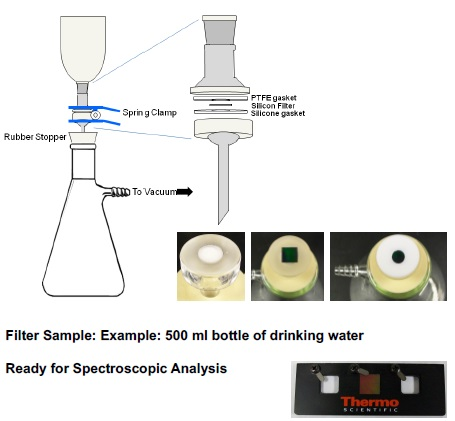
Figure 2. Modifications to the filtering apparatus to support square silicon filters.
Workflow for Spectroscopic Analysis
As shown in Figure 3, FTIR and Raman Analysis had a similar workflow.
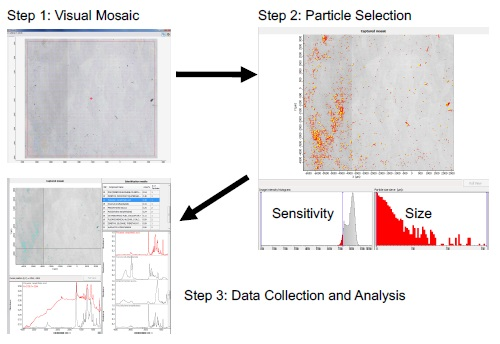
Figure 3. Particle analysis workflow
Step 2: Select the particles
Adjust sensitivity – contrast differences
Adjust size sieve
Step 3: Collect the spectra automatically from targeted particles
Step 4: Report the results in terms of:
The size and shape from image analysis
Identification from FTIR or Raman Spectra
Finally, identify which plastics are not microplastics (protein, minerals, biological, etc.)
Table 2. Summary of Microplastic Results.
| Type of microplastic |
FTIR
(total particles – 801) |
Raman
(total particles 1065) |
| PTFE |
5 |
9 |
| Polyester (PET) |
3 |
3 |
| Polystyrene |
Not observed |
3 |
| Polypropylene |
3 |
3 |
| Unspecific long chain aliphatic hydrocarbon containing materials |
2 |
1 |
| Polyethylene |
2 |
1 |
Conclusions
When identifying different types of polymers, FTIR and Raman spectroscopy are well suited. The analysis of very small particles is possible with micro-spectroscopy. An important aspect to consider for the facilitation of the direct FTIR and Raman analysis of particles on the filter is the selection of an appropriate filter material. Silicon filters provide both good visual properties and suitable spectroscopic properties.
Image analysis of visual images provides a basis for targeting particles and allows the size and shape to be determined. The particles are identified by the FTIR and Raman spectral analysis. In conclusion, this is a good approach for the characterization of microplastic particles.

This information has been sourced, reviewed and adapted from materials provided by Thermo Fisher Scientific – Materials & Structural Analysis.
For more information on this source, please visit Thermo Fisher Scientific – Materials & Structural Analysis.