Key Issues
- Monitoring of a phase transition in a liquid
- Non-contact analysis of a system at elevated temperature and pressure in a diamond anvil cell
Introduction
While it is perhaps the most vital chemical compound in the universe due to its critical role in ecology and biology, there is a lot about water that is not fully understood. This is especially the case for the structural forms of liquid and solid water, which are still being explored and investigated.
Eighteen polymorphs of ice are currently known, including a cubic form found at exceptionally low temperatures, and the hexagonal form generally found at ambient pressures and temperatures.
Liquid water exhibits polymorphism, including when in its glass forms. Neutron-diffraction studies have revealed that a polymorph known as low-density water (LDW) has the tendency to progressively transform into a second polymorph known as high-density water (HDW) as pressure increases.
These studies were conducted at low temperature and pressure (–5 °C and 0.02 to 0.4 GPa), but classical molecular dynamics simulations suggest that this phase transition has the potential to take place at temperatures up to 127 °C.
This article outlines the use of Raman spectroscopy to track a structural change in liquid water, occurring under high pressure and temperature.1
Experiment
Milli-Q water was situated in an externally heated diamond anvil cell fitted with a rhenium gasket. This was continuously compressed in a gearbox, with pressure monitoring achieved through measurements of the fluorescence from small ruby chips located in the gasket alongside the water. These measurements were able to return a precision which was more than 0.1 GPa.
Temperature control was made possible thanks to thermocouples attached to the diamonds. Raman spectra of the water were obtained via a Kaiser Raman analyzer with 532 nm excitation radiation at an exposure time of 15 seconds.
Raman bands corresponding to the O–H stretching of water were analyzed through the subtraction of a linear baseline between 2800 and 3800 cm–1 and fitting the remaining feature to two Gaussian curves that were optimized for position and height by a least-squares method.
Results
Two bands were isolated by the curve fitting. The lower-frequency band was assigned to hydrogen-bonded H2O molecules of an unknown configuration while the higher-frequency band was assigned to less-associated molecules.
As the temperature remained constant, the Raman intensity of the lower-frequency band was found to increase as pressure increased, signifying that hydrogen bonding also increases as pressure increases (Figure 1).
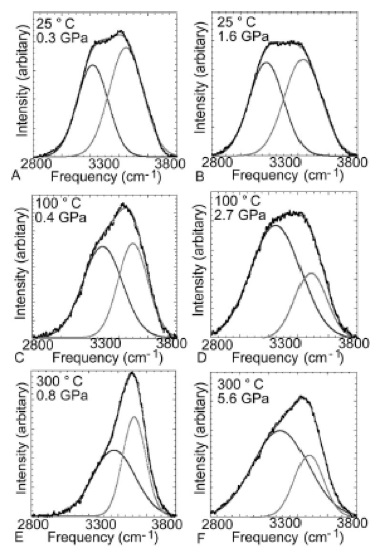
Figure 1. Band analysis of Raman spectra of water. Image Credit: Reprinted with permission from Ref. 1. Copyright © 2004 American Institute of Physics.
The peaks’ frequencies also differ, increasing as temperature increases and decreasing as pressure increases. This confirms that the strength of hydrogen bonding increases as pressure increases and decreases as temperature increases, showing a strong correlation with both the results and interpretation of the Raman intensity data outlined earlier.
It is important to note that discontinuities exist in the plots of Raman frequency versus pressure and Raman frequency versus density (Figure 2). These discontinuities could be understood as a structural change in the water, resulting from what could be described as ‘sparse water’ at higher temperatures/lower pressures and ‘dense water’ at lower temperatures/higher pressures.
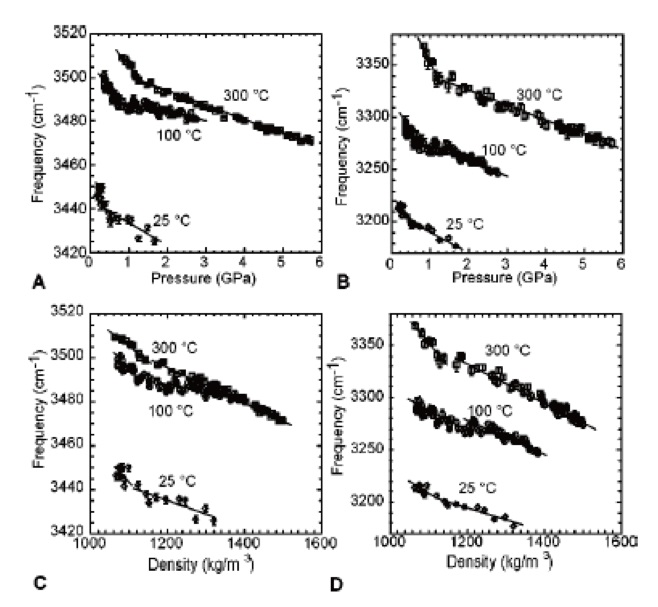
Figure 2. Pressure- and density-dependence of the frequencies of the O–H vibration Raman bands in water. Image Credit: Reprinted with permission from Ref. 1. Copyright © 2004 American Institute of Physics.
It is also possible that this change resulted from Fermi resonance between the stretching vibrational mode and bending overtone, with no structural change.
This explanation does not seem likely, however, because the bands move further apart in the frequency domain along with increases in pressure. Hydrodynamic ultrasonic velocity data was also found to support the structural change theory.1
The phase change seems to take place gradually, meaning that the boundary between sparse water and dense water in the phase diagram is not sharp, as are the boundaries between the various polymorphs of ice, but these are less defined (Figure 3).
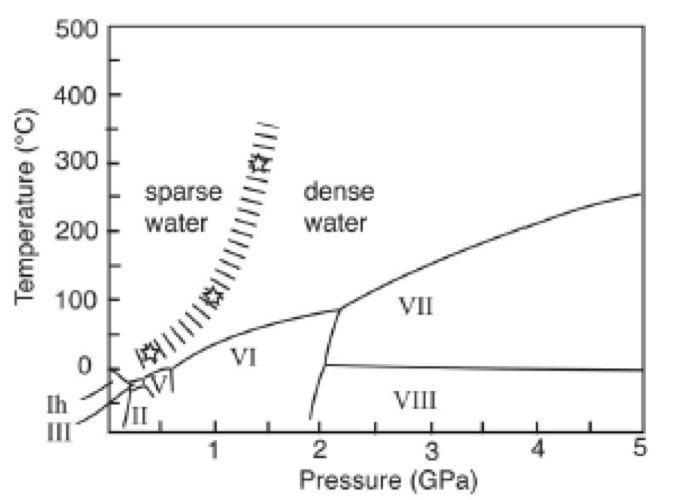
Figure 3. Phase diagram for water showing the boundary between sparse water and dense water. Image Credit: Reprinted with permission from Ref. 1. Copyright © 2004 American Institute of Physics.
Conclusion
Raman is highly regarded due to its ability to operate regardless of water in aqueous solutions. Raman possesses a weak cross-section across most of the useful spectral range, but the O–H stretching bands, found near the high-wavenumber extreme in Raman spectra, provide a great deal of information about the structure of water.
The ratios of the two bands present in the 2800–3800 cm–1 region may be utilized to ascertain the extent of hydrogen bonding in the system. Additionally, since Raman spectroscopy can function in a non-contact mode, data can be obtained with ease when working with a pressurized system in a diamond anvil cell.
References
- Kawamoto, T., Ochiai, S., and Hiroyuki, K. “Changes in the structure of water deduced from the pressure dependence of the Raman OH frequency.” Journal of Chemical Physics, Vol. 120, No. 13, 2004, 5867.

This information has been sourced, reviewed and adapted from materials provided by Kaiser Optical Systems, Inc..
For more information on this source, please visit Kaiser Optical Systems, Inc..