Within the chemical industry, the manufacturing of polymers is one of the largest sectors - the volumes of polystyrene alone produced annually worldwide reaching billions of kilograms.1 Polymerization processes have become more complex as performance demands on polymeric materials have grown exponentially, and therefore often require tighter control of process parameters2,3.
The demand for faster process analytical technologies (PAT) that improve real-time, closed-loop process control has only grown, with mega volume processes that can consistently make a quality product safely.
There are many advantages of using spectroscopic techniques such as ultraviolet-visible (UV/Vis), near-infrared (NIR), infrared (IR), fluorescence and Raman in advanced process control within the hydrocarbon processing industries.
Thanks to these benefits, spectroscopic techniques such as the above have been implemented in a broad spectrum of manufacturing units. Spectroscopic analyzers are useful in that they can make precise and accurate measurements of process chemistries with robust hardware, which (thanks to the small number or absence of moving parts) naturally have lower maintenance demands.
When compared to techniques such as gas chromatography, spectroscopy has impressively fast analysis times. This feature can therefore enhance closed loop control situations, thanks to the fact that it provides faster control response capabilities to upsets.
Considering their speed of response and the fact they are easier to multiplex, spectroscopy techniques offer a great return on investment when compared to other analytical techniques. These are just some of the notable advantages of spectroscopic technologies.
In the polymer processing sector of the chemical industry, the production of polyethylene polypropylene or vinyls often involves slurries of feeds and polymers, highly turbulent gas liquid mixes, or stratified layers of differing densities.
Given the turbidity of these samples, it prohibits the use of IR and NIR spectroscopic techniques because they require a clear transmission or reflectance “path” of the analytical light through the samples to function.
Within the process analytical arena, Raman spectroscopy has risen as a technology famed for overcoming many of the issues that face spectroscopic implementation in the wider polymer processing industries.
Benefits of Raman Spectroscopy
Raman spectroscopy has a huge advantage over other optical techniques in difficult sampling situations, in that it is based on light scattering and does not rely on a specific path for the analytical light.
Retaining all the benefits of multiplexing, Raman is able to go a step further in that the absence of a defined path length naturally eliminates analytical constraints which are commonly found in NIR and IR techniques.
This means that more components can be measured at a single probe point. The user can extract more information with less chemometrically intensive calibration, as the spectrum is well defined on the wavelength axis with excellent peak separation. This latter allows transferability across instruments and operating scales, as well as rapid method development.
It is important to consider how the hardware affects model transfer. Reproducible instrument-to-instrument performance is delivered by optical technologies built with a unified design, which are configurable across a range of installation environments (ranging from general purpose to explosive rated areas).
Cross-scale model transfer is simplified by this feature. The capability of the Raman analyzer is expanded by a variety of interchangeable and process-optimized fiber optic sampling probes, rendering servicing simpler with an easy “plug and play” format.
Therefore, spectral performance is at an advantage too thanks to the inherent reproducibility of the physical design. The user can then undertake seamless calibration transfer from instrument-to-instrument, and prevent calibration rework in the incident of a laser or detector change.
Many successful polymer applications are enabled by Raman spectroscopy, including:
- Avoiding spectral interference from water in aqueous media
- Emulsion polymerizations1
- Precise monitoring of the rate of monomer consumption
- Accurately analyzing chemical microstructure2,3
- Real-time monitoring of a melt composition 4
- Obtained detailed chemical information on the polymer backbone during a curing process5
- Accurate, but flexible monitoring of incredibly high-performance materials6
In this whitepaper, the capabilities of Raman spectroscopy for polymer applications are presented focusing on three specific examples:
- Polystyrene production using homogeneous and heterogeneous processes7
- High-impact polystyrene formation8
- The synthesis of polymer microgels9
The measurement principles can be applied to other polymerization processes, including biopolymer processes, despite the fact that the presented examples focus on polystyrene and related processes.
Raman Spectroscopy of Styrene and Polystyrene
Polystyrene has myriad uses, and is an important polymeric material. Figure 1 shows a type of styrene monomer- a benzene derivative- which polymerizes to a hydrocarbon chain with a phenyl group on every other carbon atom.

Figure 1. This displays the chemical structure of styrene, with two important Raman bands emphasised. The vinyl bond stretch within styrene is at ~ 1630 cm-1 and the benzene ring breathing mode at 1000 cm-1. The 1630 cm-1 band shows a reduced intensity as styreme polymerizes. The 1000 cm-1 band can be used as a reference peak and is not affected by the polymerization. A straightforward univariate approach to tracking monomer consumption is an intensity or area ratio of these bands. Image Credit: Kaiser Optical Systems, Inc.
Figure 2 displays a Raman spectrum of polystyrene. It is important to note that this spectrum’s peaks correspond to known chemical moieties, in addition to presenting as sharp, identifiable, and quantifiable. This, therefore, allows for robust process monitoring and control.
In Figure 2, the band at 1000 cm−1 corresponds to a ring breathing mode of the benzene ring. This peak serves as a useful reference for concentration measurements of reactants and polystyrene product, thanks to the fact that the aromatic ring is not affected by the polymerization reaction.
To take a concentration measurement, the user must calculate the area or intensity ratio of distinctive reactant or product bands, which are relative to the 1000 cm-1 band. The area or intensity ratio of the styrene vinyl bond at 1630 cm−1 to the 1000-cm−1 reference band is used to quantify styrene polymerization. Raman-derived concentration predictions are a close match for measurements carried out by gravimetry, but eliminate the need for sample extraction.

Figure 2. Figure 2 shows the chemical structure of polystyrene (insert) and its Raman spectrum. The sharp Raman bands of polystyrene correspond to specific chemical structures and can therefore be used to identify, monitor, and quantify the polymer. Image Credit: Kaiser Optical Systems, Inc.
Polystyrene Production with Homogeneous and Heterogeneous Processes
In the production of polystyrene, the most common of the available methods is free-radical polymerization. In this process, a low-temperature initiator is added to the styrene monomer in an organic solvent. The polymerization process is initiated by the initiator cleaving the monomer and opening up the vinyl bone. The reactor must be maintained within a tight temperature range to prevent auto-acceleration as the polymerization is highly exothermic.
Autoacceleration, known as the gel effect or the Trommsdorf–Norrish effect, refers to the uncontrolled acceleration of a polymerization process.
Typically, this acceleration is initiated by the rapid heating of the reaction vessel, in a polymerization which is highly exothermic. Increases in local viscosity slow termination reactions, which causes an uncontrollable acceleration of the polymerization.
Auto-acceleration has safety and process efficiency consequences. One such outcome may be that the mixture congeals into a solid mass, which then requires cutting out of the reactor – a result of wasted product and process down time.
Temperature control, the concentration of styrene monomer and the amount of solvent present in the reaction vessel are the keys to avoiding auto-acceleration and other process deviations. These elements can be controlled with predetermined parameters. However, if the physical parameters and chemical contents of the reaction vessel are known throughout the process, the process can be more consistently controlled.
To avoid process upsets, real-time process knowledge also enables in-process corrections to be made. Raman spectroscopy simultaneously produces molecular information on monomers, solvents, and polymer products in a quantifiable form, which renders it exceptionally well-suited for this task.
Intervention prior to gel formation is facilitated by monitoring the polymerization process in real time. The work of Brun et al indicates that Raman spectroscopy could be used as part of a control strategy to circumvent process upsets and maintain consistent quality of the polymer product.7
The report specifically demonstrates the viability and utility of Raman spectroscopy in monitoring the polymerization of styrene into polystyrene. The data was generated in a matter of seconds and the data corresponded well with data obtained through time-consuming and cumbersome gravimetric methods, but widely considered to provide good results.
High-Impact Polystyrene Formation
One powerful technique is coupling multiple probes with different sampling volumes to a single Kaiser Raman Rxn Hybrid analyzer- an appropach which offers a multi-scale examination of the process.
Understanding was improved by Raman hybrid sampling during polymerization of a spatially heterogeneous material.8 There are multiple steps involved in the high-impact polystyrene (HIPS) preparation, as shown in Figure 3, and the resulting product is a spatially heterogeneous graft copolymer.

Figure 3. This figure displays a cartoon representation of the formation of high-impact polystyrene (HIPS). The blue color represents styrene/polystyrene (PS) and yellow color represents polybutadiene (PB). Reaction steps are shown from top left. Styrene and PB commence as miscible phases (top left). As styrene begins to polymerize, styrene/PS is immiscible and styrene/PS forms disperse nodules in a PB continuous phase (top right). Disperse styrene/PS nodules increase in volume as styrene polymerizes (bottom left) until phase inversion occurs (bottom right). The resulting product is a disperse phase which contains PB nodules incorporated with PS inclusions, and a PS continuous phase. This morphology, named “salami morphology”, is affected by reaction physical and chemical parameters. Image Credit: Kaiser Optical Systems, Inc.
As part of the polymerization process, both micro-scale and macro-scale Raman measurements were collected. A fiber-optic probe equipped with an immersion optic measured an approximate volume of 1 µm3.
This tool was then used to measure styrene polymerization on the micro-scale. A non-contact sampling probe measured an approximate volume of 100 µm3 and was sensitive to macro-scale changes in the morphology of the copolymer, which arose from phase changes and formation of nodules.
Rheometry results correlated to Raman measurements and offered a molecular understanding to changes found in the reaction medium viscosity.
Raman data offered real-time process feedback on reactant addition rate, stirring rate, and temperature, to consistently achieve the target copolymer morphology. Though the report created by Brun et al gives insight into a laboratory application of a Raman hybrid sampling approach, these principles can be embodied and incorporated into a process environment when using the commercially available Raman Rxn2 Hybrid system.
Polymer Microgels
Polymer microgels is the name given to tiny colloidal particles (size: 50 nm to 1 µm) which are made of cross-linked polymers that respond to external stimuli, including pH or temperature.10
The responsiveness is crucial to the success of many external applications, including water treatment, painting, ink-jet printing, catalysis, and myriad pharmaceutical and medical applications.
Microgels are currently produced at laboratory-scale, and commercial interest is growing in developing industrial-scale processes to produce large quantities. However, microgels have various properties critical for proper functioning, including (co-)polymer composition, cross-linking density, particle size, and degree of swelling.
A process analytical technology (PAT) is vital for controlling these properties to the target specifications, which additionally must produce enough process knowledge quickly enough to facilitate real-time control.
There are common techniques for the monitoring of microgel synthesis, such as offline gas chromatography (GC) and nuclear magnetic resonance (NMR) spectroscopy. However, these techniques have several disadvantages. Crucially, both techniques require sample extraction and preparation, which means both result in long offset times that stand in the way of their frequent use in real-time process analysis and control.
In this manner, infrared spectroscopy has also been used, but MIR often obscures polymer signal thanks to its large water background signal. By enabling fast, non-invasive sampling and minimal water signal, Ramen spectroscopy avoids these limitations. Meyer-Kirschner et al report on using Raman spectroscopy in the real-time monitoring of microgel formation.9
Figure 5 displays the laboratory scale reaction configuration. Within the reaction, two Raman probes were inserted: one with a long focal length and one with a short focal length. These were then coupled to a Raman Rxn2 analyzer. Direct measurements in the reaction mixture were enabled by immersion probes. Standard process-analytical software was used to input Raman data in a chemometric model.
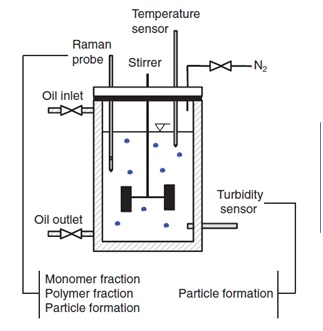
Figure 4 shows a schematic diagram of a basic system for monitoring and controlling the production of a polymer microgel. Image Credit: Reprinted from J. Meyer-Kirschner, et al. Appl. Spectrosc. 2016. 70(3): 416–426 ©2016 by SAGE Publications. Reprinted by permission of SAGE Publications, Ltd.
Important issues were addressed in developing models of reactions, which incorporate turbid media and non-linear kinetics.
Styrene polymerization, as with some other polymerization reactions, follows linear reaction kinetics, which can be tracked by following the change in the area for the monomer or normalized peak intensity. It must be noted, however, that a linear kinetic model does not always apply to continuous processes or fed-batch. Processes in which monomer is added continuously, incomplete polymerizations, or side reactions all fall under the umbrella term of non-linear polymerizations, in addition to microgel syntheses.
Linear regression methods face certain obstacles when modelling other reaction attributes. The monomer and polymer display very similar spectral characteristics, and the turbidity increases which are associated with microgel formation can result in loss of signal intensity and a lower signal-to-noise ratio.
Model robustness and performance can improve with modeling for overlapping spectral features and non-linear changes.
A hybrid model called Indirect Hard Modeling (IHM) was incorporated by Meyer-Kirschner et al., which incorporated spectral profiles, modeled using a “hard” model of mass balance and optical absorptivity coupled with a “soft” model.
Simultaneous prediction of monomer concentration and microgel formation was enabled by use of the IHM model enabled, as depicted by Figure 6, which additionally reduced model error by a factor of two when compared to a classical least squares regression. This IHM model was also able to avoid variations in temperature microgel particle size.

Figure 5. Raman-predicted monomer conversion and polymer formation from three replicates of a microgel reaction performed at 60 °C. The colors on the chart of red, blue, and green represent data for an individual experiment. Image Credit: Reprinted from J. Meyer-Kirschner, et al. Appl. Spectrosc. 2016. 70(3): 416–426 ©2016 by SAGE Publications. Reprinted by permission of SAGE Publications, Ltd.
Conclusions
For those seeking a fast, non-invasive method of generating process knowledge, Raman spectroscopy provides the answer – offering data which can be used for real-time control of polymer processes, ranging from large-scale polystyrene manufacturing.
It can be used for a range of processes, from in-process laboratory synthesis of polymer microgels to real-time measurements with a pinpoint precision and accuracy.
Raman spectroscopy is a hugely powerful tool for reactor feedback and closed-loop control within myriad chemical processes, which includes polymer reaction measurement, such as the experiment demonstrated in this report.�
References
(1) Al-Khanbashi, A.; Dhamdhere, M.; Hansen, M. Application of In-Line Fiber-Optic Raman Spectroscopy to Monitoring Emulsion Polymerization Reactions. Appl. Spectrosc. Rev. 1998, 33 (1–2), 115–131. https://doi.org/10.1080/05704929808002627.
(2) Everall, N.; Davis, K.; Owen, H.; Pelletier, M. J.; Slater, J. Density Mapping in Poly(Ethylene Terephthalate) Using a Fiber-Coupled Raman Microprobe and Partial Least-Squares Calibration. Appl. Spectrosc. 1996, 50 (3), 388–393. https://doi.org/10.1366/0003702963906258.
(3) Kaiser Optical Systems Inc. Kaiser Application Note 403: Microstructural Analysis of Polybutadienes.
(4) Kaiser Optical Systems Inc. Kaiser Application Note 404: In-Line Monitoring of Ethylene Vinyl Acetate Copolymer with Raman Spectroscopy.
(5) Kaiser Optical Systems Inc. Kaiser Application Note 405: Simultaneous DSC–Raman Analysis of the Curing of an Epoxy Thermoset.
(6) Kaiser Optical Systems Inc. Kaiser Application Note 406: Monitoring and Control of a Semi-Batch Polymerization with Raman Spectroscopy.
(7) Brun, N.; Youssef, I.; Chevrel, M.-C.; Chapron, D.; Schrauwen, C.; Hoppe, S.; Bourson, P.; Durand, A. In Situ Monitoring of Styrene Polymerization Using Raman Spectroscopy. Multi-Scale Approach of Homogeneous and Heterogeneous Polymerization Processes. J. Raman Spectrosc. 2013, 44 (6), 909–915.
(8) Brun, N.; Chevrel, M.-C.; Falk, L.; Hoppe, S.; Durand, A.; Chapron, D.; Bourson, P. Contribution of Raman Spectroscopy to In Situ Monitoring of a High-Impact Polystyrene Process. Chem. Eng. Technol. 2014, 37 (2), 275–282.
(9) Meyer-Kirschner, J.; Kather, M.; Pich, A.; Engel, D.; Marquardt, W.; Viell, J.; Mitsos, A. In-Line Monitoring of Monomer and Polymer Content During Microgel Synthesis Using Precipitation Polymerization via Raman Spectroscopy and Indirect Hard Modeling. Appl. Spectrosc. 2016, 70 (3), 416–426. https://doi.org/10.1177/0003702815626663.
(10) Thorne, J. B.; Vine, G. J.; Snowden, M. J. Microgel Applications and Commercial Considerations. Colloid Polym. Sci. 2011, 289 (5–6), 625. https://doi.org/10.1007/s00396-010-2369-5.

This information has been sourced, reviewed and adapted from materials provided by Kaiser Optical Systems, Inc.
For more information on this source, please visit Kaiser Optical Systems, Inc.