For the majority of users conducting nuclear magnetic resonance (NMR) spectroscopy today, sample preparation follows a similar path: isolate a compound or compounds from a reaction mixture (or if fortunate, a pure product), dissolve it in a suitable deuterated solvent, mix well, fill a quality NMR tube to the required height, position the sample in a sample changer, and present the sample for the requested analysis.
In most contemporary spectrometers, tasks such as locking, shimming, and tuning occur automatically prior to data acquisition. With these conditions met and the selection of suitable experimental parameters, the chemist has a high probability of acquiring useful information about their sample.
It is not untypical for a reaction to produce unexpected results; this could be down to the reaction completing, or a mixture of products was forming instead. One could carry out isolations to obtain a spectrum of each pure component, or even yield a spectrum of the reaction mixture as it exists at that point in time.
However, without running the reaction in the deuterated analog of the solvent, there could be considerable opposing signals from the solvent itself in the proton spectra. If there is a significant peak overlap between the solvent signals and the signals of the compound(s) of interest, this could cause a situation where no useful information can be extracted from the spectrum to occur.
While running a reaction in a deuterated solvent might be a theoretical possibility, it tends to be impractical due to the expense between the protonated and deuterated version of the solvent being used. However, there are methods available to conquer the restrictions imposed by intense solvent peaks in the proton spectrum. One such method is referred to as No-D NMR, which has been part of JEOL’s Delta software for several years and has been shown to adequately analyze reaction mixtures in the past.1 Here, clarification of how the process works will be presented with workflow-adaptable examples.
Deuterium – Why is it needed?
In contemporary NMR applications, deuterated solvents are applied for the following reasons in addition to dissolving the sample of interest:
- To supply a “lock” signal. The magnetic field strength that the sample encounters can change over time in response to external environmental disturbances, such as changes in temperature, or through the normal process of drift in the magnetic field. Modern spectrometers use a deuterium signal for the purpose of tracking and compensating for these disturbances, such that the frequencies of the signals do not fluctuate over the course of the experiment.
- For lock solvent referencing. If the deuterium signal is not at the standard frequency (i.e., chloroform at 7.26 ppm in either the proton or deuterium spectrum), a shim current is adapted in order to bring the signal to the appropriate frequency. This correction can be converted to the proper correction for other nuclei such as protons (1 H) or carbon (13 C). As long as the lock is well maintained, all following spectra will then be adequately referenced. It is vital to keep in mind that conventional referencing such as “TMS (tetramethylsilane) at 0.00 ppm” is a convention that only holds true in specific circumstances: parameters like concentration, temperature, salt content, pH, and others will indeed influence a chemical shift. Ultimately, lock solvent referencing is appropriate as long as it is clearly and explicitly stated.
- To perform gradient shimming. Necessitates use of the strong deuterium signal of the solvent in order to have the system carry out a technique known as gradient shimming; where imaging processes are used to map the magnetic field in the sample area and then correct for any inhomogeneity by adapting the appropriate shims accordingly. This process is generally fully automated in contemporary spectrometers and is typically repeated until the magnetic field homogeneity is no longer improved.
Without Deuterium
Deuterium is used to perform critical tasks in NMR data acquisition. However, there are alternate methods which may be used to accomplish the same end goal:
- Compensating for magnetic field drift over the course of an experiment (“locking”). Magnetic field drift was more extreme in the early days of NMR, regardless of whether the system had a permanent magnet, electromagnet, or even early versions of superconducting magnets. Contemporary superconducting magnets can have drift rates in the range of 4-15 Hz per hour, but in numerous cases this can be even lower. Moreover, enhanced magnet design has rendered them less susceptible to environmental disturbances. While drift rate might come into play in prolonged experiments, a standard proton detection experiment for small molecule work usually spans just a couple of minutes. Therefore, the drift rate would need to be exceptionally high in order to see a deterioration in the data due to magnetic field drift for typical proton detection experimental time frames.
- Referencing. It is possible to employ the same chemical shift trends to reference data after the fact, a technique chemists use even when deuterated solvents are used (consider TMS at -0.1 ppm instead of 0.0 ppm). TMS can be used as an internal standard, or the proton peaks of the protonated solvent itself could also accomplish this referencing.
- Shimming. Principally, any kind of signal can be used for gradient shimming, whether it is a proton, deuterium, or even fluorine or phosphorus signal. The main restriction of gradient shimming is sensitivity. In the instance of a sample in a protonated solvent, it is possible to use the solvent peak itself for shimming. This is performed by using a selective excitation pulse in order to only excite the solvent peak during the shimming experiment. Therefore, minimizing interference from other peaks in the spectrum. A similar process takes place for multi-line deuterated solvents, such as methanol, tetrahydrofuran (THF), or pyridine – a single resonance is used for shimming. When correctly calibrated, proton gradient shimming can act just as well as deuterium gradient shimming. Of course, manual shimming is also possible on the free induction decay (FID) or use other iterative methods to shim.
Therefore possible to carry out the major “preparation” steps before obtaining NMR data whether the solvent is deuterated or protonated. This leaves one concern, how to approach the large solvent signals in the proton spectra? As detailed in the following example of 3-buten-1-ol in protonated methanol (Figure 1).
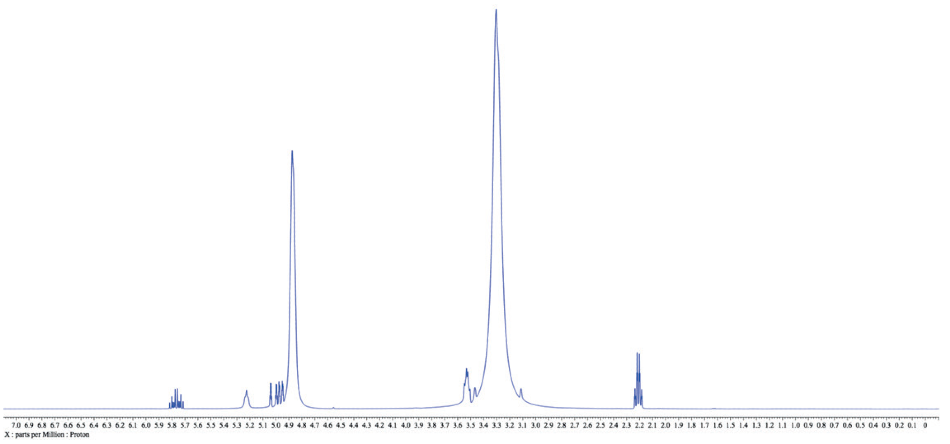
Figure 1.1H NMR spectrum of 3-buten-1-ol in protonated methanol. Relative concentration of the solute is higher than a typical NMR sample for clarity, but this ratio is not uncommon in an actual reaction mixture while using methanol as a solvent.
Solvent Suppression: Reducing the Intensity of Certain Peaks
When gathering NMR data on biological samples, there is a necessity to subdue the large H2O solvent signal in samples with a solvent mixture of 90:10% H2O:D2O. A similar process works for suppressing signals due to organic solvents, besides these additional factors:
- More than one peak may need to be suppressed
- The 13C satellite peaks might require removal if they impede on a signal of interest.
The spectrum in Figure 1 exhibits two large peaks from the methanol solvent, and it is possible to rapidly determine their chemical shifts by acquiring a conventional 1-scan spectrum. Employing an experiment known as WET (water suppression enhanced through T1 effects), it is possible to optionally suppress those two peaks and carry out 13C decoupling at the suitable chemical shift of the methyl carbons. The outcome of this experiment can be seen in Figure 2.
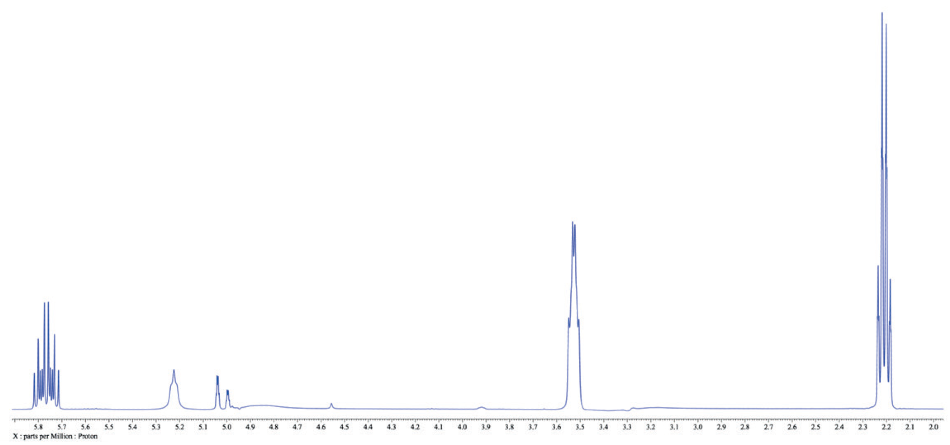
Figure 2. 1D WET spectrum of 3-buten-1-ol in methanol.
Throughout this example, the system was coded to simply locate the two tallest peaks in the 1H spectrum, subdue them, perform 13C decoupling at the suitable chemical shift, and then set the placement of the tallest peak to that of appropriate chemical shift of that peak for methanol, so that the spectrum is adequately referenced.
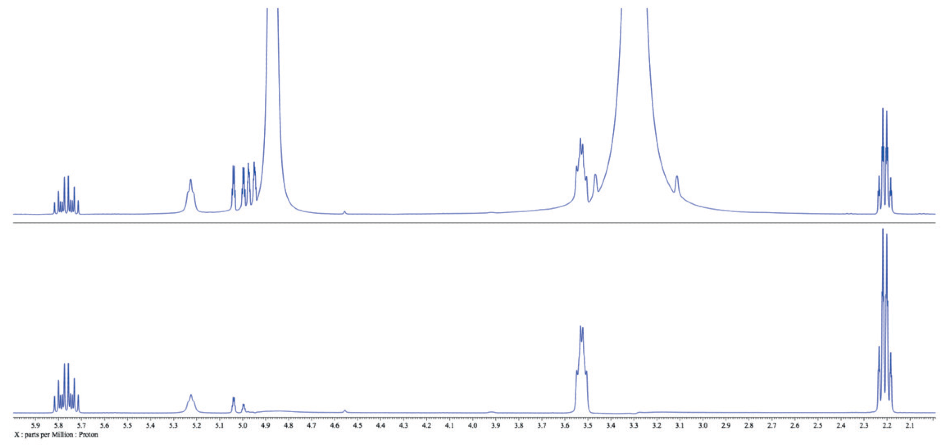
Figure 3. Comparison of the traditional 1H spectrum of 3-buten-1-ol in methanol (top) with the WET spectrum with methanol peaks suppressed (bottom)..
There is a series of phenomena to carefully consider when comparing the two spectra (Figure 3). First of all, peaks ~1 ppm away from the solvent peaks are untouched, which is advantageous. Yet, solvent suppression may induce a compromise. Note that a number of the peaks around 5.0 ppm are weakened in the WET spectrum (bottom) compared with the traditional spectrum (top).
A Practical Example: Monitoring a Reaction Mixture
Of course, acquiring a spectrum of “pure” starting material in the reaction solvent can produce helpful information, such as evidence that the starting material is indeed pure, verifying that there are no contaminants present in the solvent, or that the starting material does not react when combined with the solvent.
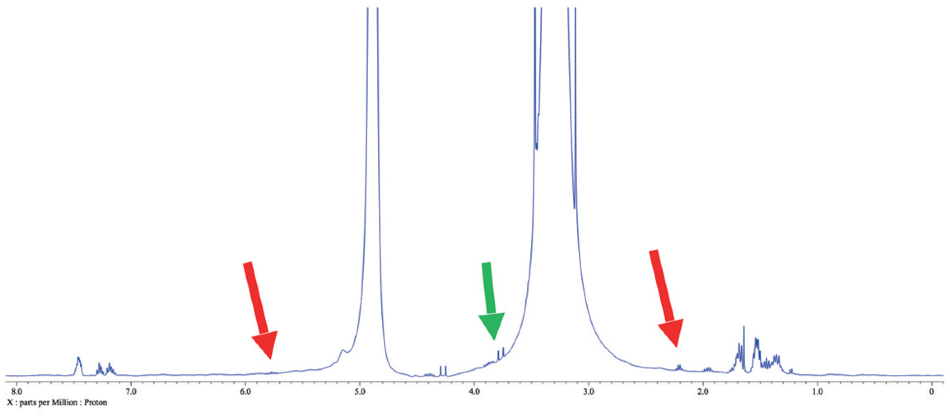
Figure 4. 1H spectrum of a reaction mixture in methanol. Red arrows indicate leftover 3-buten-1-ol peaks, while the green arrow points out another peak of interest in this case.
What can be more beneficial is the extraction of an aliquot of the reaction mixture at specific points to control the reaction’s progress. Figure 4 shows the 1H spectrum of an aliquot of a reaction mixture containing 3-buten-1-ol as well as a variety reactants in protonated methanol after a few hours of stirring. Advantageous information could be obtained from this conventional spectrum but acquiring a spectrum with the methanol peaks suppressed is also useful (Figure 5).
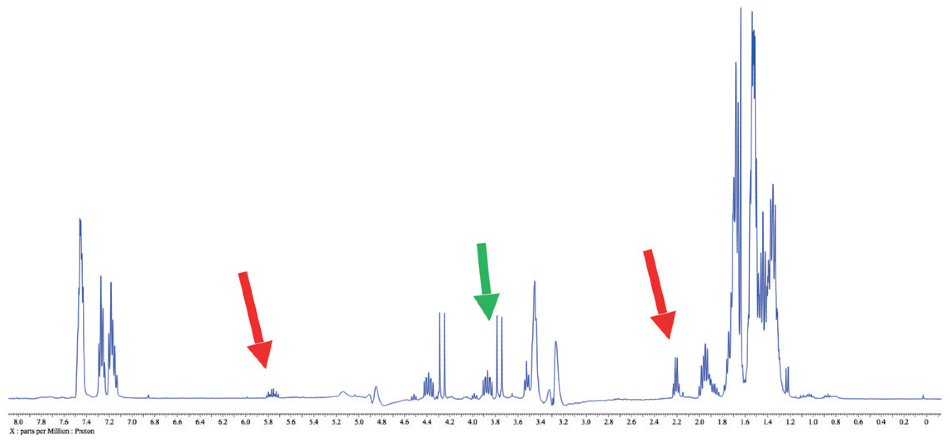
Figure 5. 1H WET spectrum of a reaction mixture. Note the clarity of the peaks of interest compared the spectrum in Figure 4.
The capacity to suppress peaks automatically with WET suppression is crucial in this case, as to be able to perform a conventional integration of the peaks indicated by the green arrow. Integration would be inconceivable if these peaks were still concealed by the “shoulder” of the solvent peak as they are in Figure 4.
Other Possibilities
While making use of the 1H data acquired from this No-D method is perhaps quite useful for observing progress of the reaction, there are several other potential applications concerning this technique.
These include:
- Observing other nuclei, including 31P or 19F, if present. It is possible to use 1H gradient shimming and referencing in these instances, when the gyromagnetic ratios of the nuclei are known and factored into the calculation.
- Obtaining quantitative (qNMR) data sets, as long as the peaks used for quantitation do not experience any weaknesses due to solvent suppression.2
- Obtaining 2-dimensional data, such as heteronuclear single quantum coherence spectroscopy (HSQCs), ¹H-¹H correlation spectroscopy (COSYs), etc., when the total experiment time is not short enough so the data will not experience from drift in the magnetic field.
The capacity to perform these steps without a deuterated solvent can lead to huge cost savings (depending on the solvent) and reduce the need for further purification and workup of samples.
References and Further Reading
- T. Hoye, B. Eklov, T. Ryba, M. Voloshin, L. Yao. Organic Letters 2004, 6 (6), 953-956 DOI: 10.1021/ol049979+
- L. Gama, B. Merlo, V. Lacerda, W. Romão, A. Neto, Microchemical Journal, 2015, 118, 12-18.
Acknowledgments
Produced from materials originally authored by Tim Bergeron from JEOL USA Inc.

This information has been sourced, reviewed and adapted from materials provided by JEOL USA, Inc.
For more information on this source, please visit JEOL USA, Inc.