The efficient and accurate identification of total sulfur is an essential stage of quality and process control in refineries. The most dependable technique to identify this is through sample combustion, followed by the use of UV fluorescence to detect the SO2 created.
Regardless of the sulfur content, most matrices can be investigated with superior results. The presence of interfering factors, for example, nitrogen compounds, can cause some matrices to give sulfur readings that are too high. A cross-sensitivity to NO produces this effect, as it fluoresces in the same wavelength range as SO2.
Subject to the sample’s nitrogen content, this can lead to a too high result of approx. 0.6%–2% of the TN content on the TS result. For example, in a matrix with 500 ppm TN, the TS value will be falsified by around 3–10 ppm.
A range of additives are included in refinery products, and one of these is cetane improvers. They are utilized to increase the ignitability (cetane number) of fuels.
To this end, compounds including nitrogen are proven to be particularly suitable and cost-effective, for example 2-ethylhexyl nitrate, 2-ethoxyethyl nitrate, triethylene glycol dinitrate, cyclohexyl nitrite or amyl nitrate. While these substances produce a positive effect on ignition characteristics, they can also increase the final product’s nitrogen content.
This can have a strong impact on the determination of sulfur depending on the amount of cetane improver. This is a significant challenge, due to the fact that certain fuels already have an “actual” TS content near to the stated maximum limit of 15 ppm resp. 10 ppm (ASTM D4814, D6751//DIN EN 590, DIN EN 14214).
If the content of sulfur is tested after the introduction of these additives, the result can exceed the allowed limits. This will mean that the fuel is greater than the stated threshold (for example ULSD, grade S15) and fails to comply with the standards. In these instances, an expensive and lengthy “after treatment” is required (for example blending with a fuel that is purer).
However, these unnecessary costs and efforts can simply be avoided through the use of interference-free working detection methods. While traditional sulfur analyzers fail to detect the presence of nitrogen-containing additives, the patented Micro Plasma Optimization (= MPO) technology solves this challenge.
Accurate TS readings are acquired, irrespective of the test matrix’s composition. This is achieved by converting interfering components into harmless species through the direct ionization of the reaction gas stream.
Samples and Reagents
Sample Preparation
No additional sample treatment was needed as all provided samples were light volatile liquids with normal viscosity.
Calibration
Various concentrated liquid standards (0–100 ppm) based on dibenzothiophene in iso-octane were used to perform the calibration of the multi EA 5100.
Instrumentation
The multi EA 5100 includes the Micro Plasma Optimizer (MPO) and the HiPerSens UV Fluorescence detector which analyzes a unique wide measurement range from ultra-trace contents (5 ppb) up to the weight percent range (1 wt%).
The user can benefit from the combination of efficient analysis times and high precision as the sample volume (1–100 µL) flexibly adapts based on the predicted sulfur content.
The pioneering MPO technology eliminates the risk of interfering with nitrogen compounds. This provides accurate and correct identification, for even the tiniest sulfur contents. Double furnace technology was used to perform the optimization of the digestion process.
To ensure optimal precision, the combustion stage is perfectly tailored to the special requirements of the sample matrix to be analyzed. Sample dosing was carried out fully automatically through the multi matrix sampler MMS in liquids mode.
A volume of 40 µL for each sample was dosed into the combustion tube’s evaporation zone. The digestion of the sample was performed in a biphasic combustion procedure at 1050 °C with an excess of oxygen.
The reaction gas produced was purified and dried, before the included SO2 was measured using a UV-fluorescence detector, with an MPO module included. The MPO turns all interfering compounds into harmless species through the direct ionization of the reaction gas.
No further auxiliary gases (NO, O2) or auxiliary materials (catalysts) are necessary. A triplicate analysis was adequate to attain dependable results due to superior reproducibility.
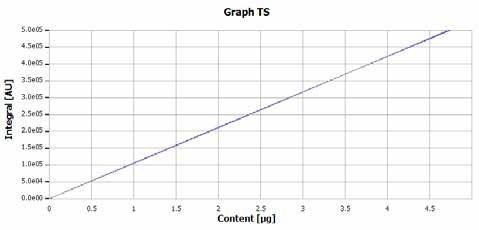
Figure 1. Calibration curve for the determination of sulfur.
Method Parameters
From the method library of multi EA 5100, the method ASTM D5453-V was employed for all analyses. It is appropriate for the measurement of liquid samples with boiling points ≤ 400 °C and viscosities ≤ 10 cSt with a higher nitrogen content. Table 1 displays the parameter settings for the vertical combustion process with a double furnace.
Table 1. Process parameters multi EA 5100 in vertical mode with quartz pyrolyzer.
| Parameter |
Specification |
| Furnace temperature |
1,050 °C |
| Second combustion |
60 s |
| Ar flow (first phase) |
100 mL/min |
| O2 main flow |
200 mL/min |
| O2 flow (second phase) |
100 mL/min |
| Draw up |
2 µL/s |
| Injection volume |
40 µL |
| Injection |
0.5 µL/s |
Evaluation Parameters
The following table presents the standard method settings which were applied.
Table 2. Detection parameters UVFD – vertical mode.
| Parameter |
Specification |
| Max. integration time |
240 s |
| Start |
1.0 ppb |
| Stop |
1.1 ppb |
| Stability |
7 |
Results and Discussion
Table 3 summarizes the results for the TS measurement with and without the use of the MPO technology. The samples were investigated in both modi to show the interfering influence of the N-containing additives resp. to demonstrate the MPO technology’s effectiveness.
The quantity of interfering nitrogen was also measured using a chemiluminescence detector (CLD). Figures 2 to 6 demonstrate the related TS analysis curves.
Table 3. Results of the sulfur determination with and without utilization of MPO technology.
| Sample |
Micro Plasma Optimization |
TN Interference |
| inactive |
active |
| TS ± RSD |
TS ± RSD |
TN ± RSD |
| Diesel fuel 1 |
185 ppb ± 3.41% |
190 ppb ± 2.38% |
373 ppb ± 2.93% |
| Diesel fuel 2 |
10.5 ppm ± 0.24% |
9.8 ppm ± 1.18% |
73 ppm ± 0.13% |
| Additive solution |
12.3 mg/L ± 1.88% |
6.87 mg/L ± 1.99% |
563 mg/L ± 0.16% |
| Standard 100 mg/L N |
1.03 mg/L ± 1.67% |
22.4 µg/L ± 4.81% |
100 mg/L ± 0.56% |
Mix standard 100 mg/L N
+ 1.00 mg/L S |
1.93 mg/L ± 0.85% |
1.02 mg/L ± 0.13% |
100 mg/L ± 0.33% |
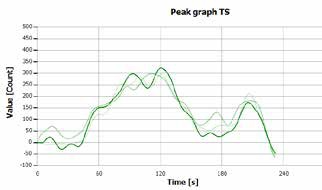
Figure 2. TS determination of “diesel fuel 1” with MPO.
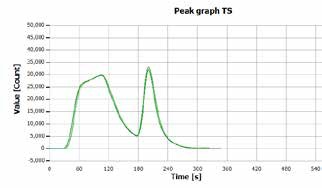
Figure 3. TS determination of “diesel fuel 2” with MPO.
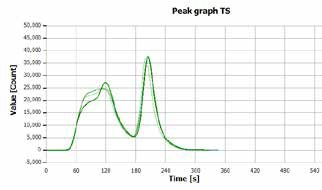
Figure 4. TS determination of “additive solution” with MPO.
The results acquired with and without the use of the MPO technology are identical for samples (diesel fuel 1) which only include nitrogen in the ultra-trace range (such as those from natural origins).
The advantage of the MPO technology can be clearly observed through the analysis of samples (diesel fuel 2, additive solution) containing higher quantities of TN as a result of the inclusion of performance improving agents (such as cetane improver).
Significant and insignificant variations between the two detection technologies can be observed depending on the nitrogen content. Without MPO, the UV-fluorescence provides measurements that are too high for the determination of sulfur as a result of cross-sensitivity for nitrogen monoxide.
Utilizing the MPO technology is the only way to determine the correct and ‘actual’ TS contents of these matrices. The efficiency of this method is clearly demonstrated by analyzing the mixed standard, which includes precisely 1 mg/L S in the presence of 100 mg/L N.
The TS results are falsified and are too high because of the presence of 100 mg/L TN when analyzing the traditional UV-fluorescence without MPO (Figure 5). When the analysis is conducted using UVF with the MPO technology (Figure 6), the same sample provides accurate sulfur content.
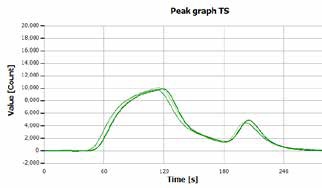
Figure 5. TS determination of the “mix standard” (a.) without MPO.
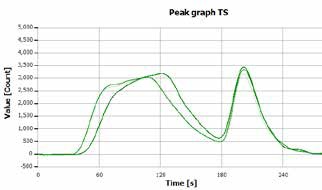
Figure 6. TS determination of the “mix standard” (b.) with MPO.
Conclusion
The multi EA 5100 with Micro Plasma Optimizer delivers accurate results when determining traces of sulfur in the presence of high amounts of nitrogen. This is particularly important in the quality control of diesel fuels and corresponding matrices where additives are included.
Petrochemical applications are not the only field where this technology can be beneficial. It can be employed for all organic solids (such as fats and polymers), liquids (such as lubricating oil and hydraulic oil), and gases/LPG when the accurate sulfur content must be measured in the presence of higher concentrations of nitrogen.
Customized accessory modules are available to upgrade the multi EA 5100 for the automated measurement of Carbon (TC), Chlorine (TX), and Nitrogen (TN) in liquid, gaseous, solid, and LPG sample matrices.

This information has been sourced, reviewed, and adapted from materials provided by Analytik Jena US.
For more information on this source, please visit Analytik Jena US.