Metrohm can help organizations and individuals perform the best possible analysis using Near-Infrared Spectroscopy (NIRS), whether they are new to the technique, an experienced practitioner, or simply curious about NIRS and its applications.

Image Credit: Metrohm AG
What is the Difference Between IR Spectroscopy and NIR Spectroscopy?
IR (infrared) and NIR (near-infrared) spectroscopy make use of different spectral ranges of light. Light in the NIR range possesses higher energy levels than IR light (Figure 1), and this impacts its interaction with a sample’s molecules.
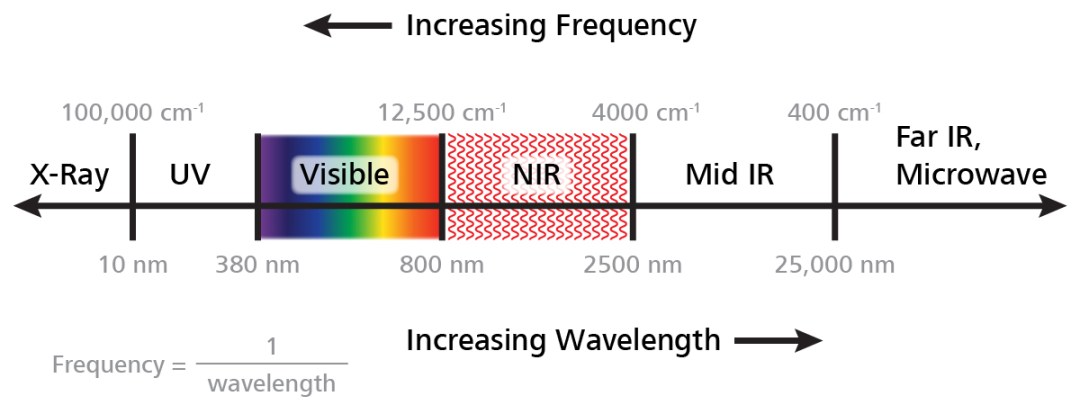
Figure 1. The electromagnetic spectrum. Image Credit: Metrohm AG
This difference in energy is both positive and negative, and generally, the nature of the application itself will determine which is the most ideal technology. Most organic materials will absorb the higher energy NIR light to a lesser degree than IR light; broadening resulting bands and meaning that assigning these to specific functional groups is impossible without further mathematical processing.
This same feature, however, removes the requirement for sample preparation prior to analysis, because there is no longer a need to use ATR (attenuated total reflection) or prepare thin layers of analyte. Furthermore, NIRS can be employed to quantify water content in samples up to 15%.
Weaker absorption of NIR light leads to the use of lengthy pathlengths when conducting liquid measurements - this is especially useful in industrial process settings. NIR spectroscopy applications may employ extended fiber optic cables to connect a measuring probe to an analyzer.
This feature enables ongoing remote measurements to be taken throughout a process, due to low absorbance of NIR light by the fiber (Figure 2) - this feature is also especially useful when working with industrial processes.
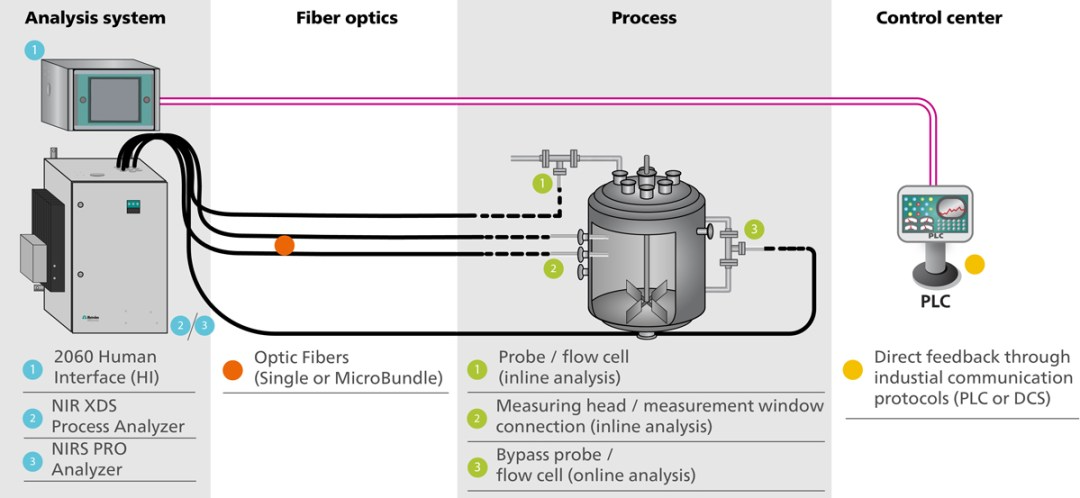
Figure 2. Illustration of the long-distance measurement possibility of a NIRS process analyzer with the use of low-dispersion fiber optic cables. Many sampling options are available for completely automated analysis, allowing users to gather real-time data for immediate process adjustments. Image Credit: Metrohm AG
NIR Spectroscopy is a “Secondary Technology”. What does this Mean?
Creating prediction models in NIR spectroscopy requires NIR spectra to be correlated with parameters of interest; for example, a sample’s water content. These models are then utilized as part of routine quality control checks during sample analysis.
Values determined via a reference (primary) method must be correlated with the NIR spectrum in order to generate prediction models (Figure 3). It is because the results of NIR spectroscopy depend on the availability of these reference values throughout the development of prediction models, that NIR spectroscopy is understood to be a secondary technology.
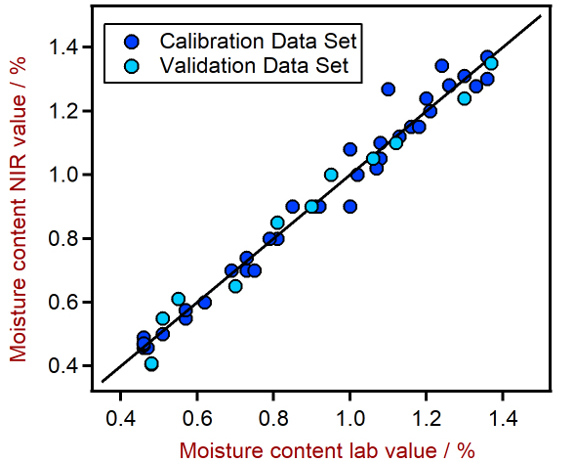
Figure 3. Correlation plot of moisture content in samples measured by NIRS compared to the same samples measured with a primary laboratory method. Image Credit: Metrohm AG
What is a Prediction Model, and How Often Should it be Created or Updated?
Prediction models are used within NIR spectroscopy to interpret a sample’s NIR spectrum, determining values of important quality parameters like density, total acid number or water content. Prediction models are generated using a combination of sample NIR spectra and reference values from established reference methods; for example, Karl Fischer titration for water content (Figure 3).
Generally a prediction model containing appropriate amounts of representative spectra and reference values will be created once, this will only need to be updated if samples start to vary; for example, following a change of production process parameter or equipment, or a change in raw material supplier.
How Many Samples are Required to Develop a Prediction Model?
The number of samples required to develop a good prediction model will very much depend on the molecular absorptivity of the key parameter and the complexity of the sample matrix.
A relatively straightforward matrix, like a halogenated solvent with its water concentration as the measurement parameter, would generally require a sample set of 10–20 spectra covering the whole concentration range of interest. More complex applications would require at least 40–60 spectra in order to ensure that a prediction model is reliable.
Which Norms Describe the Use of NIR in Regulated and Non-Regulated Industries?
USP <856> and USP <1856> outline a standard approach to implementing near-infrared spectroscopy systems in a validated environment. A general norm for non-regulated environments regarding how to create prediction models and basic requirements for near-infrared spectroscopy systems are described in ASTM E1655.
ASTM D6122 and ASTM D6299 provide guidance on method validation and instrument validation respectively, while ASTM D2699 and ASTM D2700 provide useful standards and guidance on specific measurements, such as RON and MON analysis in fuels.
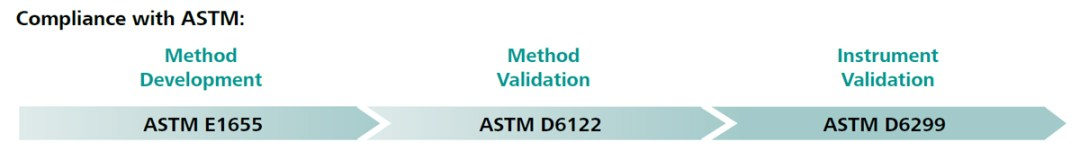
Figure 4. Different steps for the successful development of quantitative methods according to international standards. Image Credit: Metrohm AG
How can NIRS be Implemented in a Production Process?
Undertaking chemical analysis within process streams can be especially challenging. Physical and chemical properties (for example, flammability and viscosity) of sample streams may hinder analysis measurements. Industrial processes are often delicate, and even subtle changes to process parameters can result in significant variability in final products’ properties.
If a consistent and high quality product is to be ensured, it is imperative that the stream’s properties be measured continuously, and that process parameters are adjusted via rapid feedback.
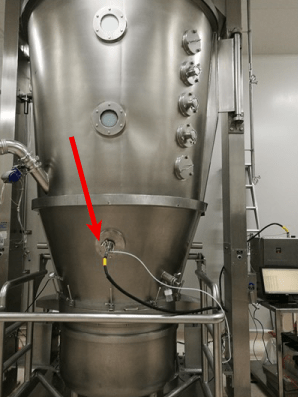
Figure 5. Example of the integration of inline NIRS analysis in a fluid bed dryer of a production plant. Image Credit: Metrohm AG
The utilization of fiber optic probes as part of NIRS systems has resulted in exciting new possibilities in process monitoring. For example, using an appropriate NIR probe and connecting this to the spectrometer via optical fiber can facilitate direct online and inline monitoring, without interfering in the production process itself.
A diverse selection of NIR optical probes are currently available. These range from immersion probes and transmission pair probes to reflectance and transflectance probes, designed for contact and non-contact measurements. The sheer range of options available means that NIR spectroscopy can be used with almost any type of sample composition, including solid powders, solutions, melts, and emulsions.
However, it is important that the right probe or sample interface be selected for use with a NIR process analyzer if process implementation for inline or online process monitoring is to be successful.
Transmission or transflectance probes may be used to measure the sample, depending on whether the sample is in a liquid, solid or gaseous state. Specific fitting attachments will also be used to connect probes to the pipe, reactor or tank, depending on the state of the sample.
Metrohm Process Analytics has over 45 years of experience and can leverage this to design the best solutions for any process.
How can Product Quality be Optimized with Process NIRS?
Routine control of key process parameters is necessary to comply with specific process and product specifications, and this approach will ultimately result in optimal product consistency and quality, regardless of the industry in question.
NIRS analyzers are able to provide data every 30 seconds, allowing production processes to be monitored in near real-time. The use of NIRS process analyzers is ideal for monitoring a manufacturing process 24 hours a day, and it is also exceptionally useful when inspecting raw material and reagent quality.
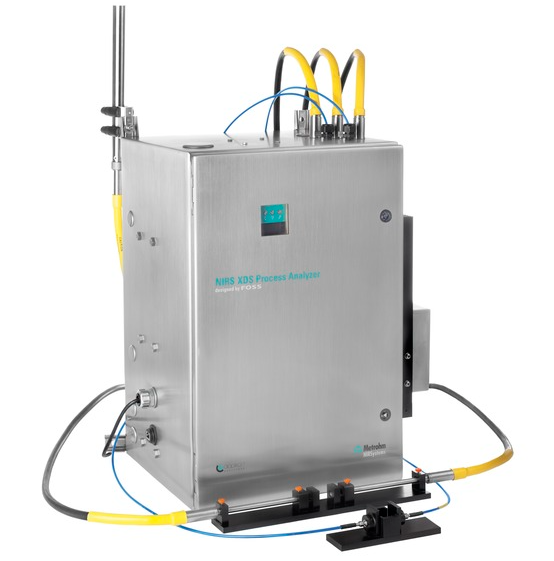
Figure 6. The Metrohm Process Analytics NIRS XDS Process Analyzer, shown here with multiplexer option allowing up to 9 measuring channels. Here, both microbundle (yellow) and single fiber (blue) optical cables are connected, with both a reflectance probe and transmission pair configured. Image Credit: Metrohm AG
Because NIRS data is provided in real-time to an industrial control system (for example, PLC or DCS), this data can be used to automate virtually any process; ultimately resulting in reduced downtime, avoidance of unforeseen circumstances and improved safeguarding of expensive company assets.
Additionally, Metrohm Process Analytics NIRS instruments’ included software includes a built-in chemometric package, allowing effective qualification of a product even while production remains ongoing.
This package will generate a report which can be directly used by the QC manager to monitor and ensure product quality consistency is continually improved, further adding to potential revenues.
Acknowledgments
Produced from materials originally authored by Dr. Nicolas Rühl and Dr. Alexandre Olive from Metrohm.

This information has been sourced, reviewed and adapted from materials provided by Metrohm AG.
For more information on this source, please visit Metrohm AG.