The requirements for dynamic light scattering (DLS) systems are usually dependent on the sample. However, numerous DLS systems require the lower size limit to be either 1 nm or less (0.3 nm). This article provides verification that the Nicomp® DLS system is proficient in taking repeated measurements of particle sizes less than 1 nm and offers specifics on the measurements’ completion.
Introduction
Dynamic light scattering is the ideal method of measurement for particle size analysis of less than 1 µm. The standard dynamic range for this technique is around 1 nm–1 µm; however, the performance at both ends depends on the sample and system. The upper size limit of DLS is subject to the volume and density of the dispersed phase.
Emulsion samples may be achievable at ~10 µm because the density of the dispersed and continuous phase has a level of similarity. However, for a high density solid particle like gold (19.29 g/cc), the upper limit will be significantly less. After the particle motion is dominated by sedimentation, instead of Brownian Motion, the result can no longer be relied upon.
The upper size limit of DLS is also impeded by number fluctuations as the small number of large particles enter and vacate the inspection area. On the small size, the specification relies on the construction and optical quality of the instrument, in addition to the scattering properties and concentration of the sample1. Measurements approaching 1 nm are difficult and need cautious sample preparation.2 This article shows measurements taken at or less than 1 nm using sucrose and the sample. Note: Optimum Nicomp performance close to 1 nm usually needs the 35 mW laser and APD detector.
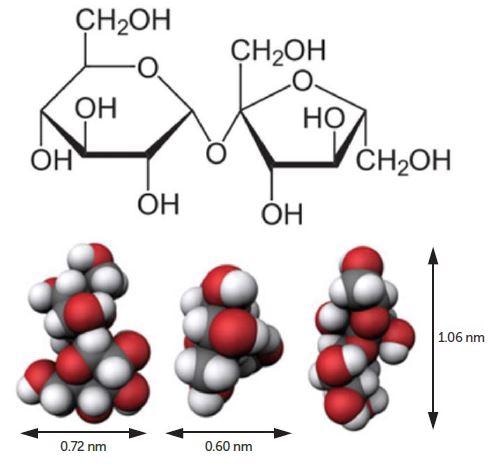
Figure 1. Sucrose molecule. Image Credit: Entegris
Materials
Sucrose (Figure 1) was bought from Fisher Chemical, certified ACS crystalline, S5-500, lot 173322, chemical formula C12H22O11, molecular weight = 342.2965 g/mol. Sucrose solution was readied at 10 volume percent utilizing filtered DI water. All measurements were produced employing the Nicomp Z3000 DLS particle size analyzer (Figure 2) configured with a 35 mW laser diode and APD detector.
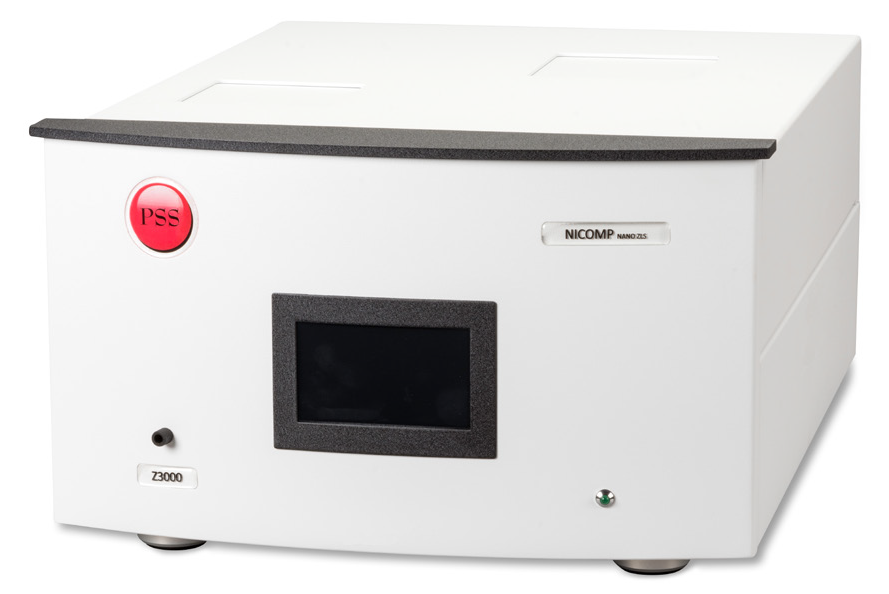
Figure 2. Nicomp Z3000 DLS system. Image Credit: Entegris
Instrument Settings
In Figure 3, the standard measurement settings used in this study can be seen.
| . |
. |
| Refractive index |
1.333 |
| Viscosity |
1.172 cP |
| Auto sensitivity |
Checked |
| Auto baseline adjustment |
Checked |
| Channel width |
5 µsec |
| Temperature |
23 °C |
| Intensity set point |
300 kHz |
| First channel used |
2 |
| Scattering angle |
90° |
| Cell type |
Round |
| Run time |
7 minutes |
Figure 3. Nicomp measurement settings. Image Credit: Entegris
Note: The viscosity data used was 1.172 cP for 10% sucrose. Precise viscosity values are necessary for correct DLS results for non-dilute based measurements.
Results: Gaussian
The Gaussian intensity and volume results3 for 10% sucrose can be seen in Figure 4.
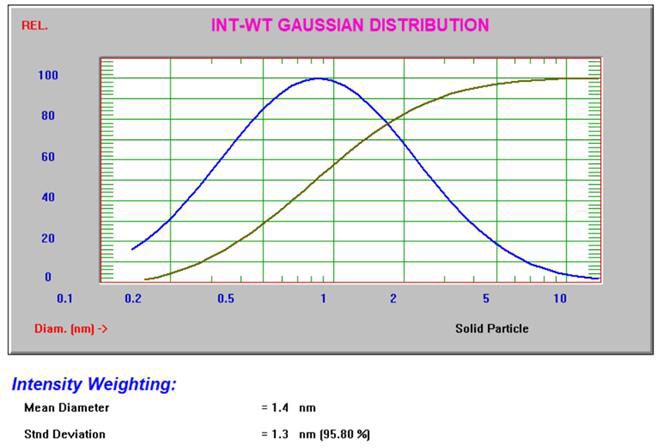
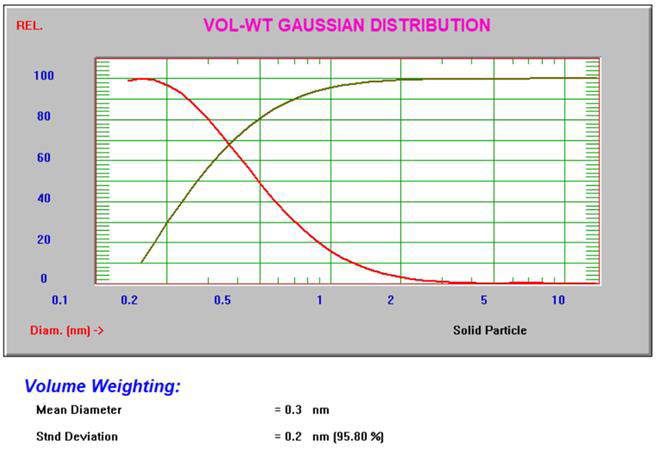
Figure 4. Intensity and volume Gaussian results for 10% sucrose. Image Credit: Entegris
Results: Nicomp
The Nicomp results are established on a non-negative least squares algorithm enhanced to resolve multi-modal distributions. All results in this study produced high Chi-square3 values, suggesting the occurrence of multiple modes. The Nicomp intensity result for the 10% sucrose can be seen in Figure 5.
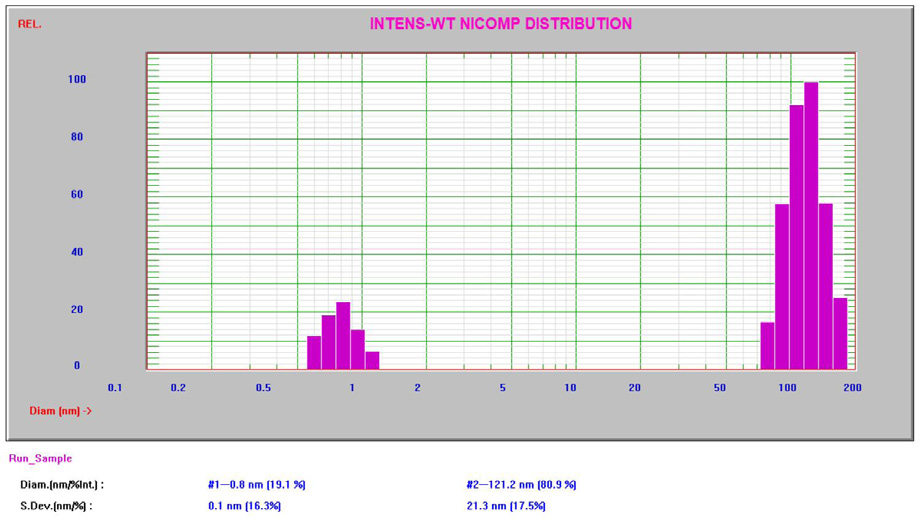
Figure 5. Intensity Nicomp result for 10% sucrose. Image Credit: Entegris
Conclusions
The Nicomp DLS system is well-adept at measuring as low as and lower than 1 nm, strengthening the lower size specification of 0.3 nm. The bigger second peak at approximately 100 – 200 nm has been described in other published literature4 and is considered to be impurities from the raw material and handling.
References
- Entegris Technical Note, 0.1 mg/mL Lysozyme
- Entegris Technical Note, DLS Sample Preparation
- Entegris Technical Note, DLS Data Interpretation
- Weinbuch et al., nanoparticulate impurities in pharmaceutical-grade sugars and their interference with light scattering-based analysis of protein formulations, pharm res (2015) 32:2419–2427

This information has been sourced, reviewed and adapted from materials provided by Entegris.
For more information on this source, please visit Entegris.