One of the most sought after aspects of microanalysis in SEM is the capacity to expand the probe current for quick microanalysis whilst retaining a small spot size and a small volume of excitation for high resolution.
JEOL’s FE SEMs possess the distinctive feature of a patented Aperture Angle Control Lens (ACL). This lens instinctively optimizes for high-resolution imaging at small probe currents and high spatial resolution X-ray analysis at high probe currents with a smooth change from one to the other. This is critical for quick analysis and excellent image quality and is especially true for low kV microanalysis.
The ACL operates by studying the impacts of each aberration (spherical, chromatic, and diffraction limitations) on spot size and instinctively optimizing the convergence angle. There can be beam tailing that generates X-rays from areas “not in the spot” when the SEM is optimized for the smallest spot size (largest convergence angle). For low beam current functions, this is irrelevant.
The greatest analytical data is gathered from the smallest convergence angle. As such, when the ACL is optimized for image resolution, the subsequent high current image (large convergence angle) has a rather ‘hazy’ background but demonstrates good resolution.
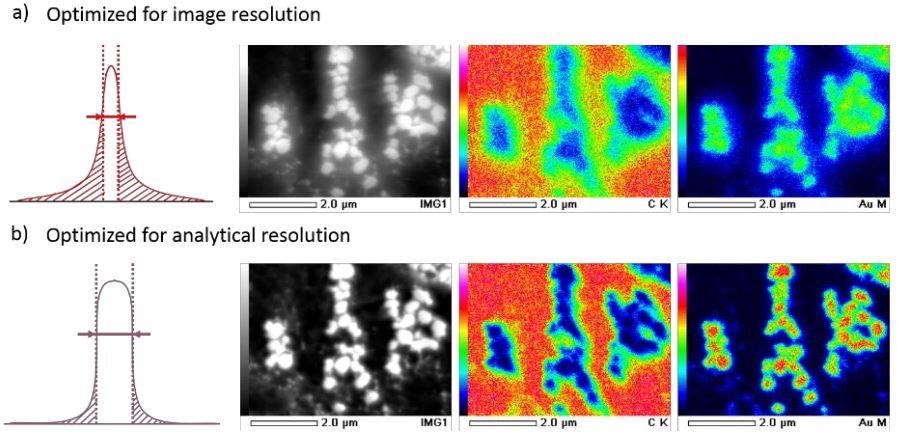
Figure 1. Beam current density on a Gaussian plane. ACL optimization at high beam currents for (a) image resolution, and (b) analytical resolution. Nanogold images and EDS analysis completed at 5 kV, 20 kX, and 73 nA. Image Credit: JEOL USA, Inc.
Despite this, the ultimate resolution decreases slightly when the ACL is optimized for analytical work. However, the analytical signal is not influenced by the beam tailing causing less analytical signal delocalization (Figure 1). The automatic optimization of the ACL retains high-resolution imaging at a wide variety of quickening voltages and probe currents, ranging between a few pA to hundreds of nA.
Chart 1. Spot size versus probe current at analytical WD. Source: JEOL USA, Inc.
| |
15 kV |
5 kV |
| 1 nA |
1.4 nm |
1.5 nm |
| 5 nA |
1.9 nm |
2.0 nm |
| 10 nA |
2.3 nm |
2.5 nm |
| 50 nA |
2.8 nm |
4.1 nm |
| 100 nA |
3.7 nm |
6.0 nm |
Chart 1 displays resolution contrasted with probe current at the analytical WD for 15 kV and 5 kV. Strongly magnified images of gold on carbon at large probe currents are shown in Figure 2. The images are taken at 15 kV, analytical WD, and a beam current of 1 nA (left) and 100 nA (right).
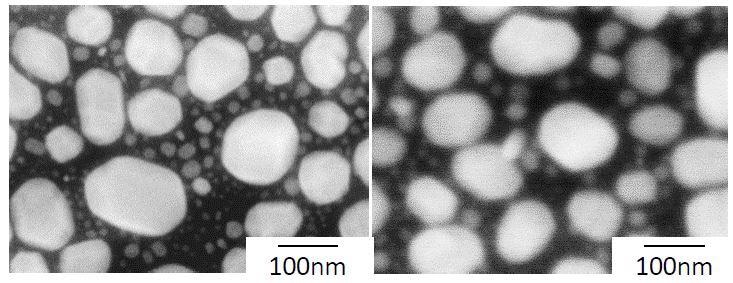
Figure 2. Gold on carbon images taken at 15 kV and analytical WD with 1 nA beam current (left) and 100 nA beam current (right). Image Credit: JEOL USA, Inc.
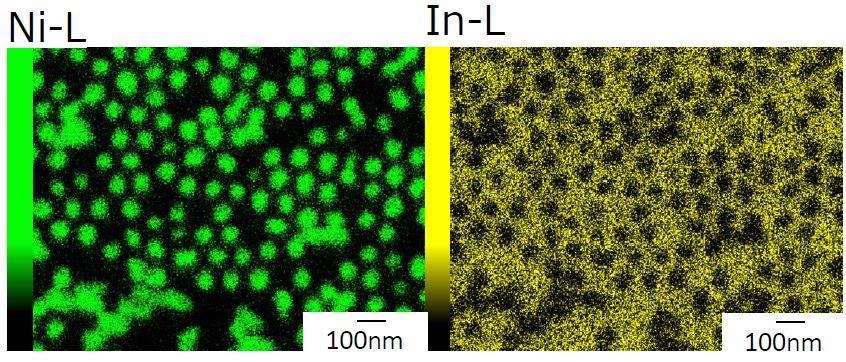
Figure 3. EDS map of nickel pillars on ITO which has sub-25 nm resolution. The map was taken at 6 kV, 4 nA of beam current in 160 s. Image Credit: JEOL USA, Inc.
Application of the ACL function at high beam currents permits retrieval of rapid EDS maps at high spatial resolution employing low kVs. This can be seen in Figure 3, using JEOL integrated EDS detector. This is an EDS map of nickel pillars on ITO with sub-25nm resolution. The map was accumulated at 6 kV employing a beam current of 4 nA in less than three minutes.

This information has been sourced, reviewed and adapted from materials provided by JEOL USA, Inc.
For more information on this source, please visit JEOL USA, Inc.