msFineAnalysis is an automated qualitative analysis software that performs "integrated analysis" by combining two approaches: molecular weight confirmation using soft ionization data, and compound identification through EI mass spectral library searches.
msFineAnalysis iQ is designed for low-resolution integer mass data analysis, while msFineAnalysis AI focuses on high-resolution exact mass data. Both software packages enhance analytical efficiency, reduce time spent on data processing, and improve the accuracy of qualitative results.
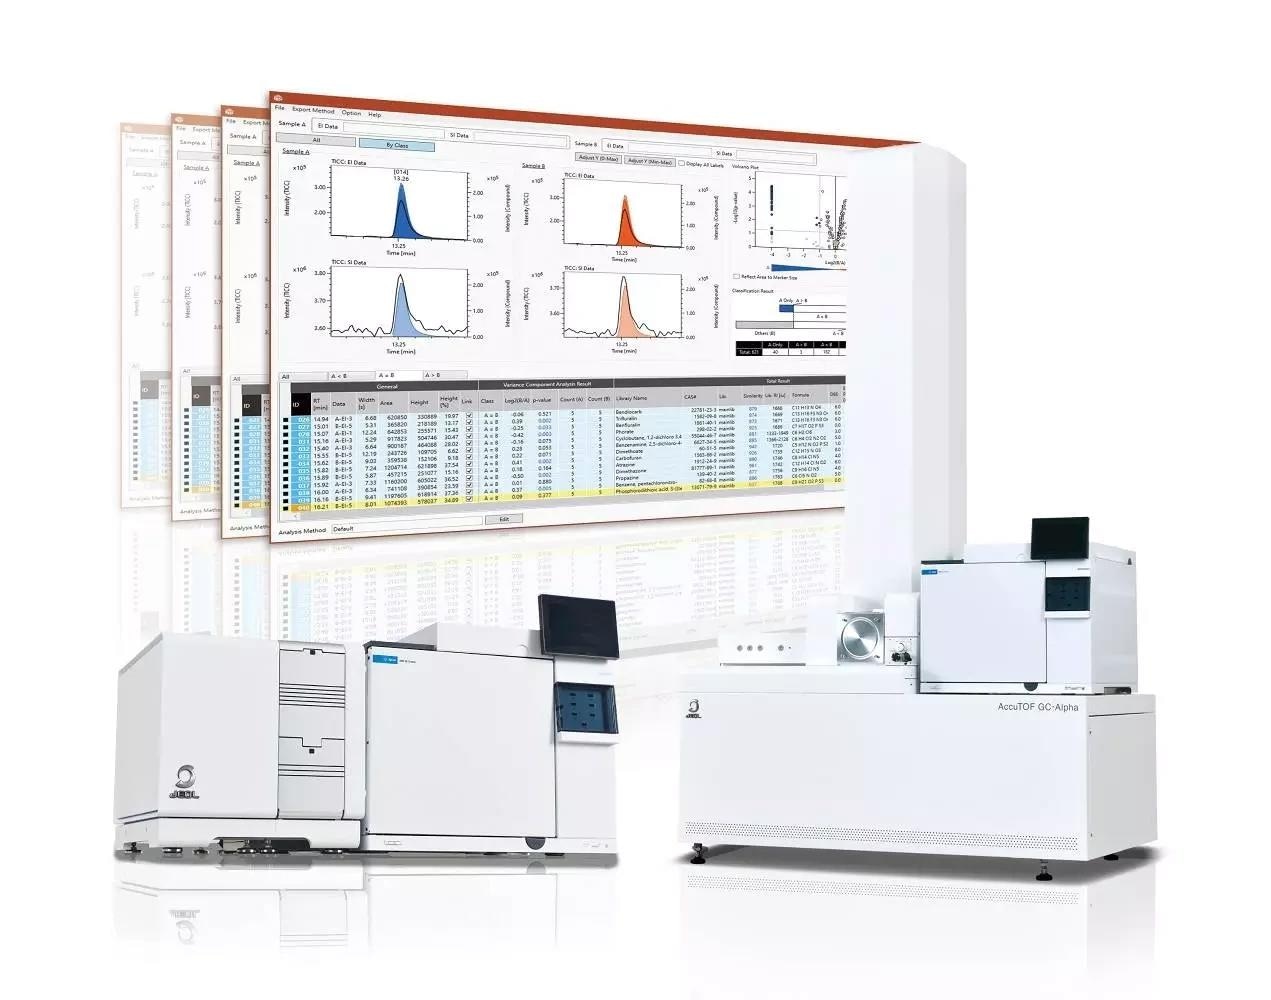
msFineAnalysis iQ, for the single quad and triple quad mass specifications. msFineAnalysis AI, for the AccuTOF GC-Alpha. Image Credit: JEOL USA.
Advanced AI Technologies Enable Structure Analysis of Unknown Compounds
msFineAnalysis AI is a structural analysis tool for unknowns created for the JEOL JMST2000GC AccuTOF™ GC-Alpha. This next-generation software builds on the capabilities of the previous msFineAnalysis by adding automated structural analysis to enhance overall qualitative analysis performance.
msFineAnalysis AI integrates high-resolution GC/EI and GC/soft ionization data through combined “integrated analysis” and “structure analysis” features, powered by two artificial intelligence engines: Main AI and Support AI.
These advanced AI technologies enable automated structural interpretation in GC-MS qualitative analysis that was not previously achievable.
Features
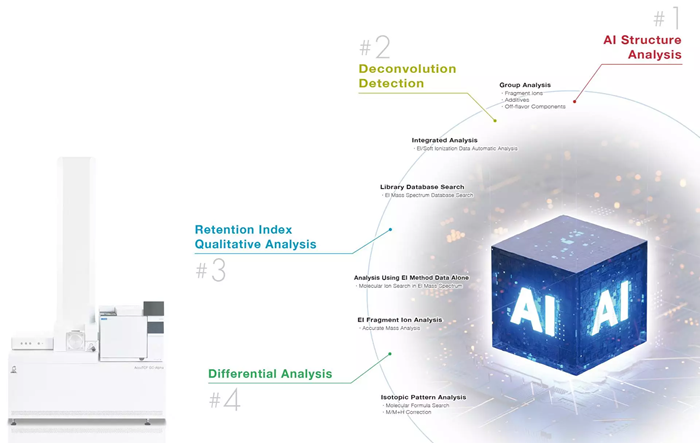
Image Credit: JEOL USA, Inc.
AI Structure Analysis
Evolving Innovative Solutions: From Molecular Formula Estimation to Structural Formula Prediction for Unknown Compounds
The msFineAnalysis algorithms automatically suggest a molecular formula for unknown compounds not registered in a library database (▼). Taking it a step further, msFineAnalysis AI can automatically predict molecular structures for all detected components in the sample.
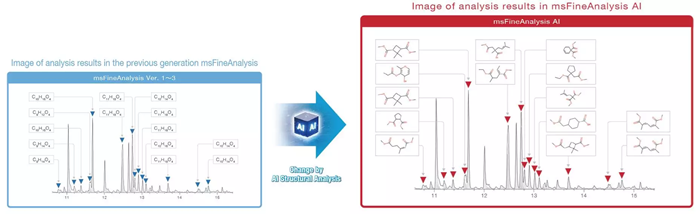
Image Credit: JEOL USA, Inc.
The Necessity for Soft Ionization: Reliable Acquisition of Molecular Formula Information is the First Step in Structure Analysis!
EI mass spectral data is employed in most library databases, and so EI is the most common qualitative analysis method of GC-MS materials. However, EI is a harsh ionization method, and many fragment ions are detected using this technique. As a result, it is not uncommon to see little to no signal for molecular ions.
When analyzing substances that have not been previously registered in library databases, it is difficult to determine whether the biggest measured m/z is the molecular ion or a fragment ion using only EI mass spectra. In these instances, the soft ionization approach is an effective instrument for obtaining this information.
The AccuTOF™ GC-Alpha system offers optional soft ionization methods like FI, PI, and CI. These approaches can help identify ions (for example, molecular ions and protonated molecules) and offer molecular weight information, allowing the molecular formula of unknown components to be precisely determined.
Soft ionization is crucial for detecting unknown compounds, as molecular formula information is an essential foundation for AI structure analysis.
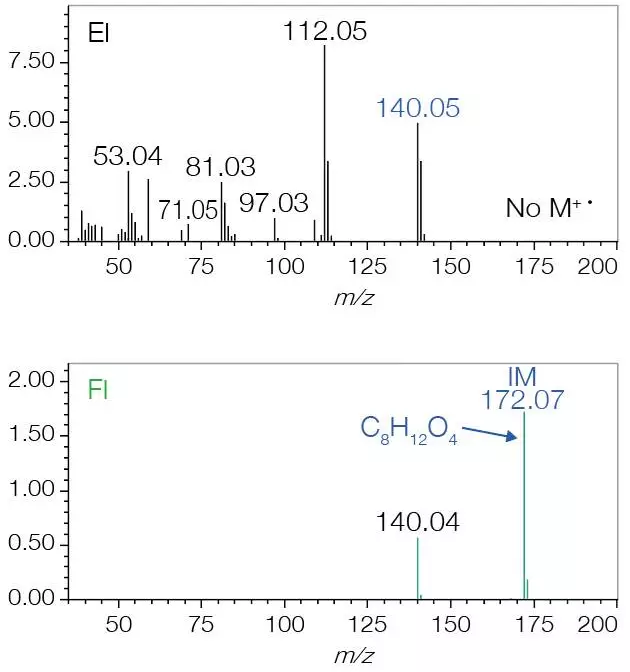
Mass spectrum of component not registered in library. Image Credit: JEOL USA, Inc.
Manual Structure Analysis by Skilled Analyst vs. AI Automatic Structure Analysis
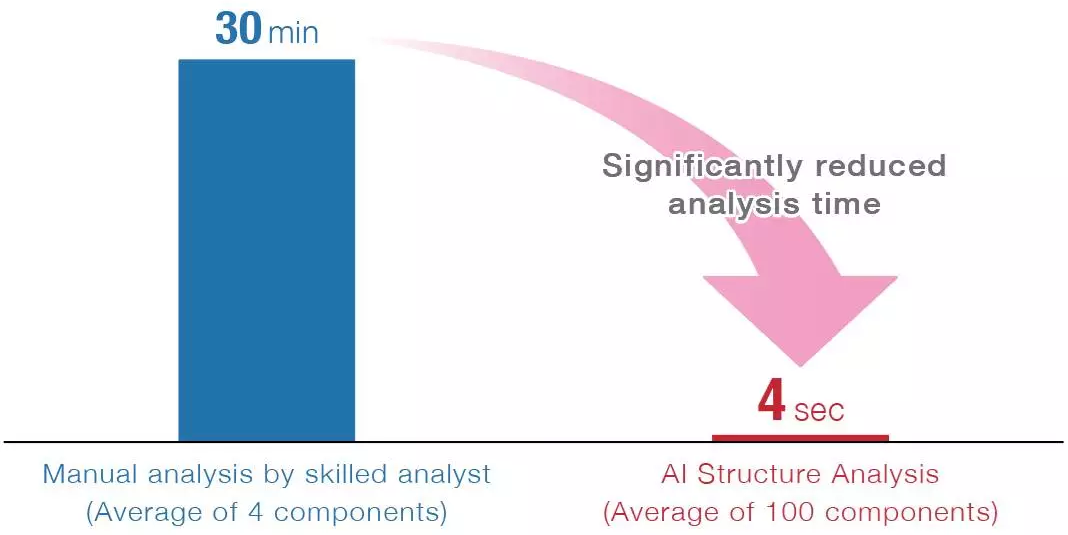
Image Credit: JEOL USA, Inc.
The time required for structure analysis was compared for compounds detected in an acrylic resin using Py-GC-TOFMS that were not registered in the NIST library database.
Even an analyst with over 30 years of mass spectrometry experience took over two hours to analyze the structure of four components, or 30 minutes for each component. On the other hand, AI structure analysis completed 100 components in less than seven minutes, averaging four seconds for each component.
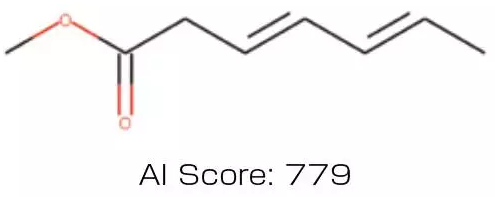
The AI structure analysis score similarity between the structural formula calculated by a trained analyst and the accurate structural formula, indicating that the structural formula is predicted with high similarity. Image Credit: JEOL USA, Inc.
Automatic Structure Analysis Using Two AIs: Stable Structure Analysis Without the Need for an Online Environment
msFineAnalysis AI provides an automated structure analysis function.
The software generates candidate structural formulae for components not found in library databases using information from a database of over 100 million known organic compounds. Two newly developed AI models power these predictions, designed to enhance structural inference accuracy.
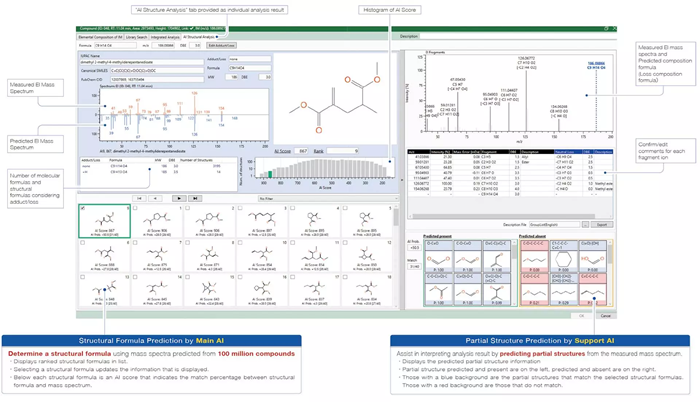
Image Credit: JEOL USA, Inc.
AI Structure Analysis Prediction Accuracy
The Main AI in AI structure analysis learns and evaluates using the NIST20 library database.
The prediction accuracy tests revealed that the right structure was in the top 1 % for 73 % of the compounds and the top 10 % for 93 % of the compounds.

Correct structural formula ranking in 14681 compounds. Image Credit: JEOL USA, Inc.
PubChem produces structures with an identical composition formula as the target compounds (14,581 compounds). The rank order of the correct structure is confirmed among them.
Of the 14,581 compounds verified, 73 % (10,644 compounds) had the right structure within the top 1 % rank order.
Next, six known compounds not registered in the NIST20 library database were evaluated, with three compounds having the highest accurate structure ranking. The top structures indicated in the structure analysis results all have similar characteristics to the correct formula for the remaining compounds.
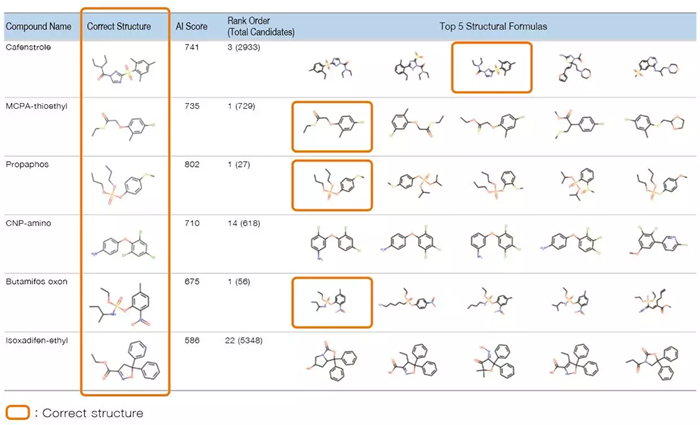
Image Credit: JEOL USA, Inc.
AI Structure Analysis Application
The AI structure analysis results for an acrylic resin evaluated using Py-GC-HRTOFMS are provided below. After identifying their molecular formula via integrated analysis, 20 compounds with structures that could not be validated with the NIST20 library database underwent AI structural analysis.
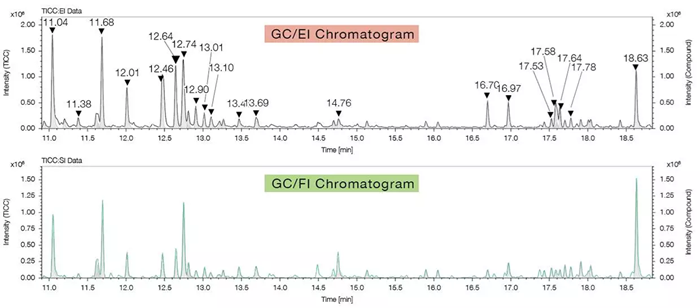
Image Credit: JEOL USA, Inc.
All of these compounds had structures containing methyl esters (reflecting the acrylic resin monomer structure), as demonstrated for the higher-ranked possibilities. Based on this information, it was estimated that all compounds selected for structure analysis were products formed by the thermal decomposition of acrylic resin.
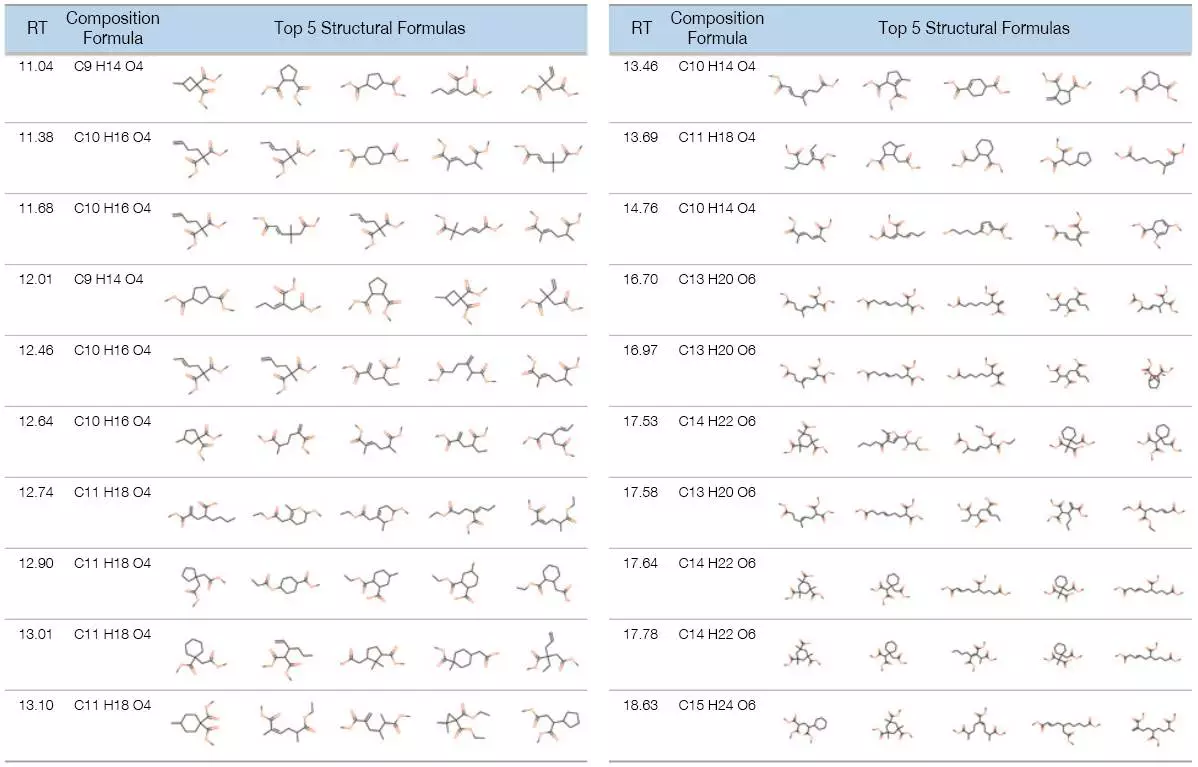
Image Credit: JEOL USA, Inc.
Deconvolution Detection
Chromatographic peak deconvolution can discover trace components that may have been missed in the TICC, due to the co-elution of several different components.
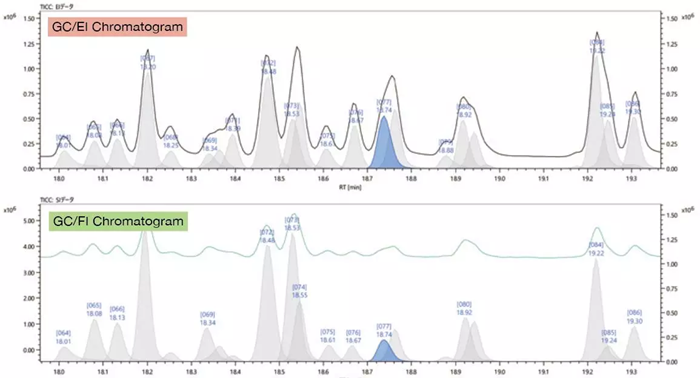
EI: black solid line: TICC, gray peaks: deconvolution peak (blue: currently selected). FI: green solid line: TICC, gray peaks: deconvolution peak (blue: currently selected). Image Credit: JEOL USA, Inc.
This step simplifies the data processing process by determining which ions are associated with each compound, eliminating the requirement to generate extracted ion chromatograms (EICs).
Retention Index Qualitative Analysis
The retention index (RI) is a relative index value calculated using the retention times (RT) of an n-alkane standard mixture.
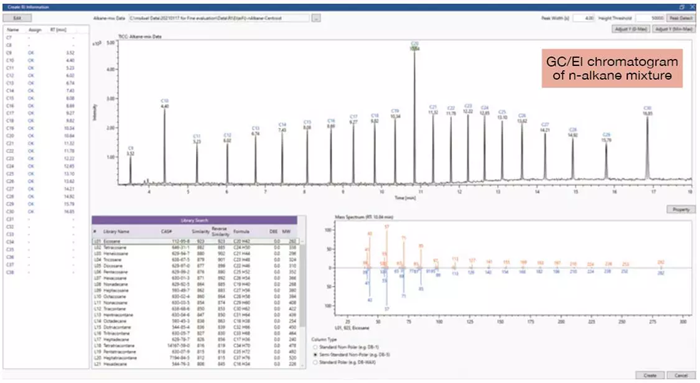
Retention Index Creation Screen. Image Credit: JEOL USA, Inc.
This qualitative analysis function is carried out by transforming the target component's RT into an RI and then comparing it to the RI values recorded in databases, and so on. Using the RI, msFineAnalysis AI can narrow down the qualitative analysis results even further.
Two Sample Comparison (Differential Analysis)
This function uses a volcano plot, which shows the intensity ratio between two samples on the horizontal axis and the reproducibility of the p-value on the vertical axis.
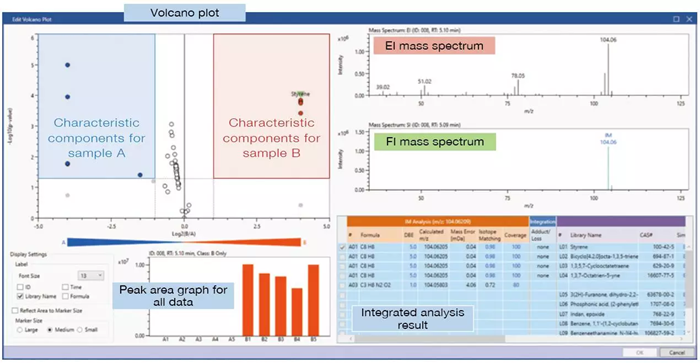
Detailed analysis – Volcano plot (A: Reference product, B: Defective product). Image Credit: JEOL USA, Inc.
This information enables visual identification of compositional differences between two samples. For example, comparing a reference product with a defective one can reveal whether certain components have increased or decreased.
Similarly, comparing a new material to an existing one can highlight characteristic components unique to the new formulation. The number of replicate measurements per sample in a two-sample comparison can be set to n = 1, 3, or 5, depending on the desired level of statistical confidence.
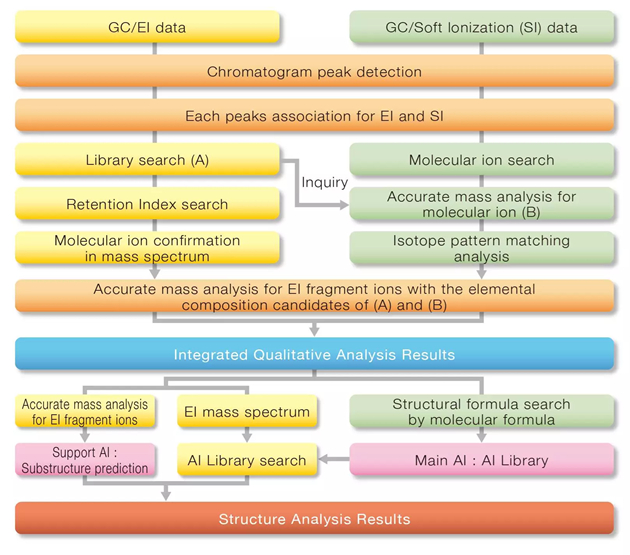
Image Credit: JEOL USA, Inc.
Specifications
For Use with the Following Instrument
AccuTOF™ GC-Alpha
- Displaying analytical results using retention indices
- Displaying NIST database search results
- Displaying exact mass calculation results
- Displaying isotope pattern analysis results
- Displaying measurement conditions
- User interface: English
- AI Structure analysis
- Finding peaks and generating mass spectra automatically
- Using manual peak detection to create mass spectra
- Mass spectra creation via deconvolution processing
- Analyze identical components of two measurement data items
- Analyze molecular ions using two mass spectra
- Variance component analysis