Image Credit: Thermo Fisher Scientific – Environmental and Process Monitoring Instruments
In a number of pharmaceutical processes, one of the key stages is the partial or complete removal of a solvent, or solvents, from an intermediate or product. The drying process needed can happen in a number of process vessels, including tray dryers, vacuum dryers, and rotary dryers.
The success of the drying process was measured upon conclusion by simply taking a sample for laboratory analysis until now.
Organic solvent concentrations in the active pharmaceutical ingredient (API), or intermediate, were measured by gas chromatography; residual water levels were usually investigated by carrying out a Karl Fischer titration.
The quantity of residual solvent was determined by the loss on drying (LOD). The drying process had to be restarted if the sample failed the LOD test for one or more of the solvents. Further complications in terms of both sampling the API and restarting the dryer were likely to happen if the drying was performed under a vacuum.
This risk resulted in a tendency to heighten drying times in order to avoid a failed LOD test, but more process challenges were then created. A longer drying time had an adverse effect on production lead times as the drying stage is usually a rate-limiting step during the manufacturing.
In a number of instances, the only way to avoid this bottleneck was to lengthen drying capacity at a huge expense. There were also numerous instances when the product was over-dried. The results of this were a higher chance of damaging influences on the polymorphic form of the final product and production problems downstream.
The PAT Initiative
The Federal Drug Administration’s Process Analytical Technology (PAT) initiative in 2004 outlined the implementation of process analytical methods to enhance process understanding in the pharmaceutical industry.
For the investigation, the drying process was the ideal candidate and PAT teams started the search for suitable methods for continuous process analysis.
Disadvantages of Spectroscopic Techniques
A number of PAT teams initially explored spectroscopic methods like near infra-red (NIR) technology for product drying. Superficially, as they sampled directly in the bulk API, these methods were attractive. Yet, there were a number of drawbacks to this approach. These included:
- A number of API drying processes involve the removal of two or more solvents from a potential list of over 30 compounds, needing complex chemometric modeling to turn the spectroscopic data into process-friendly concentration data.
- The sampling probes become coated by the API.
- The probe only supplies a ‘spot’ sample and is not representative of the total residual solvent in the product.
- Retractable probes are required to avoid probe damage by the rotating paddles in the case of paddle dryers.
Advantages of Mass Spectrometry Techniques
Gas analysis that utilizes process mass spectrometry provides benefits of simplicity in both data manipulation and sampling, including:
- Able to simplify the analysis of even complex mixtures by utilizing the fragmentation patterns of the molecules in the mass spectrometer’s ion source, which are effective ‘fingerprints’; for instance, figure 1 exhibits the fragmentation pattern for n-propanol while figure 2 exhibits that of isopropanol.
- Gathering samples at the dryer outlet, either in the outlet air line or vacuum suction line, is a straightforward and simple procedure that only requires a heated sample line, a Swagelok™ type connection and a basic particulate filter with a disposable element.
- Collecting samples from the headspace above the product to ensure effective measurement of the bulk product in the dryer and to help to circumvent problems from a lack of homogeneity in the product.
- Confirming vacuum integrity, either by helium leak checking or by looking for air leaks.
- Making sampling from vacuum drying processes quite practical by operating at high vacuum, usually 10-5 to 10-6 mbar.
Although a lot of useful understanding and data was gathered by implementing gas analysis mass spectrometers on drying processes, a number of users experienced problems over time, which were in three key categories:
- Converting mass spectrometry data into concentration data
- Contamination of the mass spectrometry analyzer
- Problems of sampling over wide pressure ranges
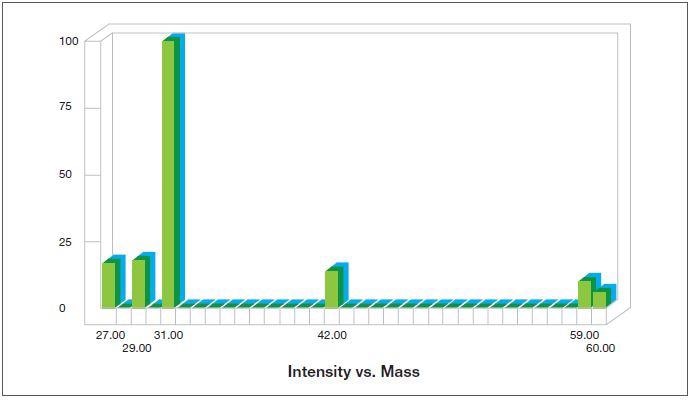
Figure 1. Fragmentation pattern for n-propanol as generated by the Thermo Scientific™ GasWorks Software. Image Credit: Thermo Fisher Scientific – Environmental and Process Monitoring Instruments
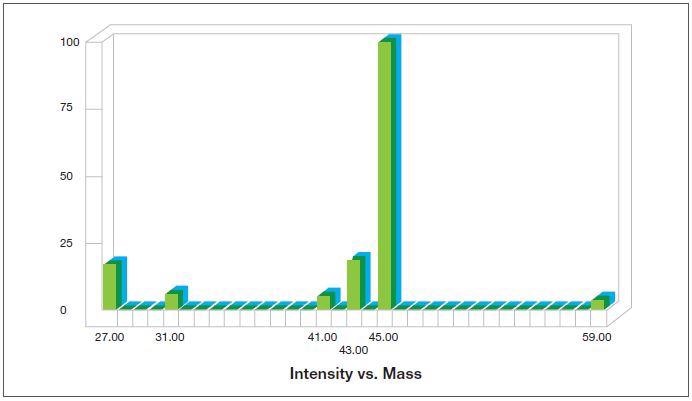
Figure 2. Fragmentation pattern for isopropanol as generated by the Thermo Scientific™ GasWork Software. Image Credit: Thermo Fisher Scientific – Environmental and Process Monitoring Instruments
Analyzer Contamination
The early mass spectrometers that were utilized during solvent drying were invariably based on quadrupole analyzers. This variety of analyzers is notoriously prone to contamination by hydrocarbons that cause analyzer drift and need the mass spectrometer to be taken offline for cleaning.
The Thermo Scientific™ Prima™ PRO Process Mass Spectrometer is a highly reliable and precise alternative that features a magnetic sector analyzer, as seen in Figure 3.
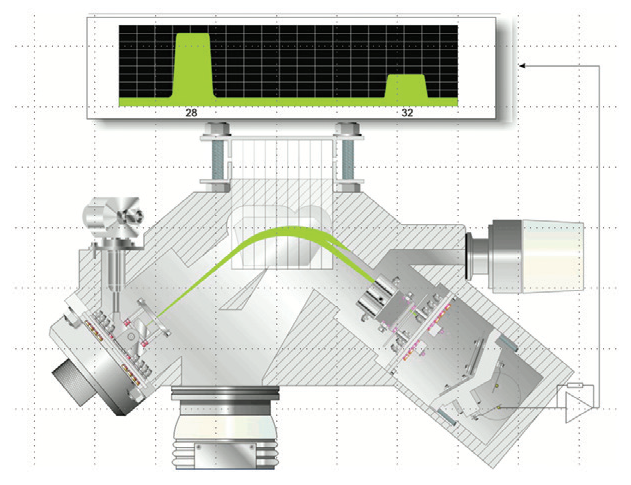
Figure 3. The magnetic sector analyzer within the Prima PRO Process Mass Spectrometer. Image Credit: Thermo Fisher Scientific – Environmental and Process Monitoring Instruments
The magnetic sector analyzer is based on thirty years of industrial mass spectrometry experience and has proven to provide unrivaled performance for industrial online gas analysis.
Some key benefits of the magnetic sector analyzer include enhanced accuracy and precision, resistance to contamination, and long intervals between calibrations. Usually, analytical precision is between 2 and 10 times better than a quadrupole analyzer, depending on the complexity of the mixture and the gases analyzed.
A unique feature of the analyzer’s magnet is that it is laminated and its scanning speed is equivalent to that of quadrupole analyzers, providing the unique combination of high stability and fast analysis.
This combination enables fast, extremely stable analysis of an unlimited amount of user-defined gases.
To attain extremely stable mass alignment, the scanning magnetic sector is controlled with 24-bit precision via a magnetic flux measuring device. The enclosed ion source within the analyzer also ensures minimum background interference, high sensitivity, and maximum contamination resistance.
This high-energy (1000 eV) analyzer has a proven track record of monitoring high percent level concentrations of organic compounds without experiencing drift or contamination and provides extremely rugged performance in the presence of vapors and gases, which have the potential for contaminating the internal vacuum components.
Sampling from Vacuum Drying Processes
In principle, as the analyzer itself is operating at a high vacuum, the mass spectrometer is perfect for monitoring vacuum processes.
Yet, it is crucial that the pressure in the mass spectrometer stays constant as the process pressure changes from atmospheric down to the vacuum levels needed in order to dry the product.
The signals will rise and fall in line with the sample pressure if the pressure within the mass spectrometer is not controlled, resulting in the output data being useless.
Early mass spectrometry vacuum drying systems employed a single control valve, usually a voltage-sensitive orifice (VSO) valve, which was linked to a gauge monitoring the sample pressure.
The VSO valve opened and closed as the sample pressure altered in order to maintain constant pressure in the mass spectrometer. It worked sufficiently for simple vacuum processes, but it suffered from various serious limitations, these included:
- For users who needed to monitor numerous dryers, the mass spectrometer was required to switch between a dryer at high pressure at the beginning of the drying cycle and a dryer at low pressure at the end of its cycle. The control valve was forced to adjust to these pressure swings as fast as possible, but the response characteristics of a single valve are inadequate for this type of duty; long delays have to be built into the stream switching times, especially as the solvents are at opposite extremes of the concentration range.
- The valve was almost fully open at low pressures, typically lower than 10 mbar, which restricted the amount of control available. The valve was 100% open at approximately 5 mbar, meaning there was no control of the mass spectrometer pressure at all below this point.
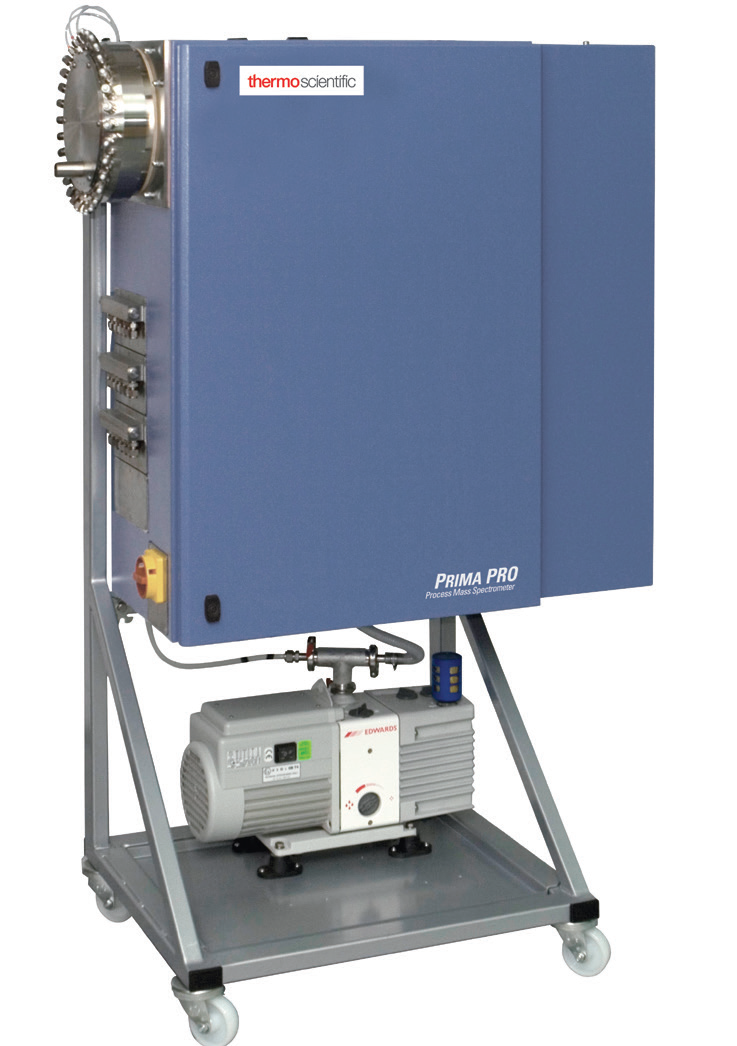
Thermo Scientific Prima PRO Process Mass Spectrometer. Image Credit: Thermo Fisher Scientific – Environmental and Process Monitoring Instruments
Variable Pressure Inlet
Within the Prima PRO mass spectrometer analyzer, the variable pressure inlet contains two control valves that work in opposition; one valve opens as the other closes. This combination supplies fast, precise control and a wide dynamic range.
The inlet controls the analyzer pressure at just 0.1 mbar, so it can handle sample pressures down to 0.3 mbar.
Figure 4 shows the variable pressure inlet is in schematic form and Figure 5 demonstrates the Prima PRO mass spectrometer fitted with the multipoint inlet that is capable of sampling from up to 10 dryers. For R&D and pilot plant users, a single point inlet is also available.
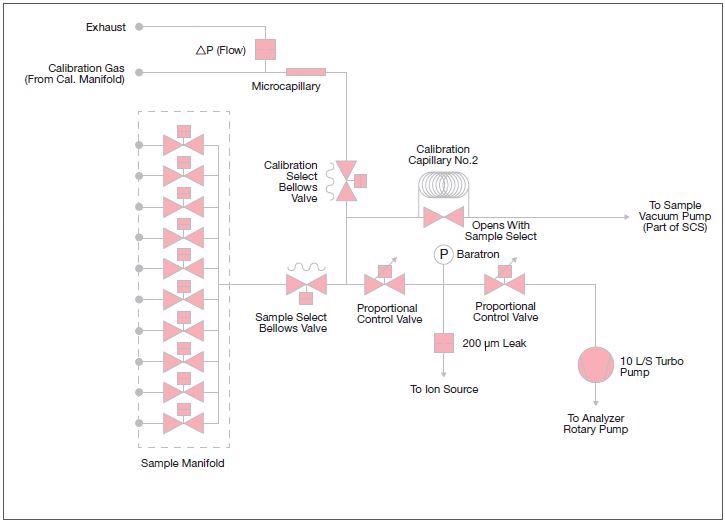
Figure 4. A schematic diagram of the variable pressure inlet within the Prima PRO Process Mass Spectrometer. Image Credit: Thermo Fisher Scientific – Environmental and Process Monitoring Instruments
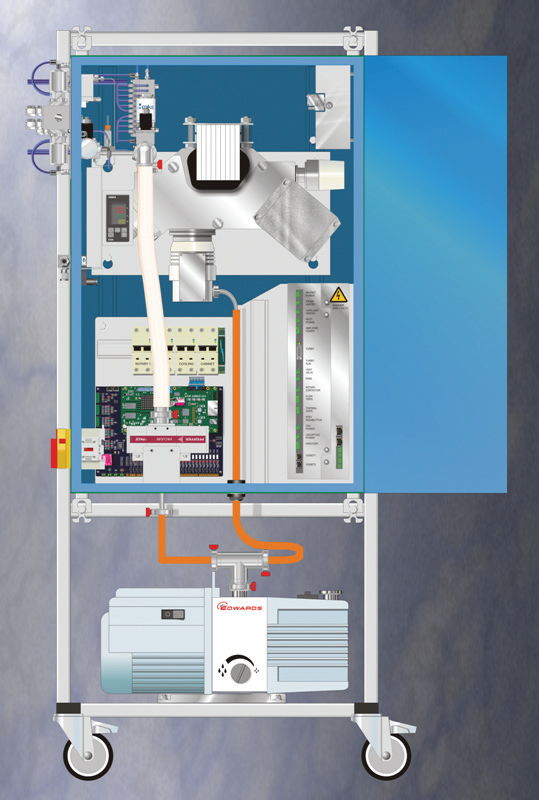
Figure 5. The Prima PRO Process Mass Spectrometer with the multipoint variable pressure inlet attached. Image Credit: Thermo Fisher Scientific – Environmental and Process Monitoring Instruments
Using Mass Spectrometry Data to Control the Drying Process
By monitoring ion currents from the principal peaks of the solvents of interest, early mass spectrometers utilized for solvent drying only gave qualitative information.
While this information aided users in starting to understand the dynamics of the drying process, the analyzer drift and consequent lack of repeatability between drying runs limited the suitability of the method for process control.
In some instances, the nitrogen signal at mass 28 was utilized as an internal standard to produce a ‘relative response,’ but this data was not always available. It also did not help in instances where one peak could not be uniquely assigned to one solvent as there was significant overlap between the solvent fingerprints.
When utilizing the Prima PRO mass spectrometer, the variable pressure inlet enables the introduction of calibration gases under software control, allowing the Thermo Scientific GasWorks software to supply solvent concentrations instead of solvent ion currents.
The unique combination of precise inlet pressure control, magnetic sector stability, and GasWorks quantitative software ensures the process data supplied by the Prima PRO mass spectrometer is reliable and accurate.
There are a variety of industry-standard communication protocols that enable the transfer of this data to process control systems to enhance drying processes and GasWorks software is fully CFR 21 Part11 compliant.
Figure 6 shows an example of a typical two-solvent drying curve. It exhibits the removal of water and isopropanol as the pressure drops from atmospheric to 2 mbar. Throughout the process, the inlet pressure stays the same at 0.1 mbar.
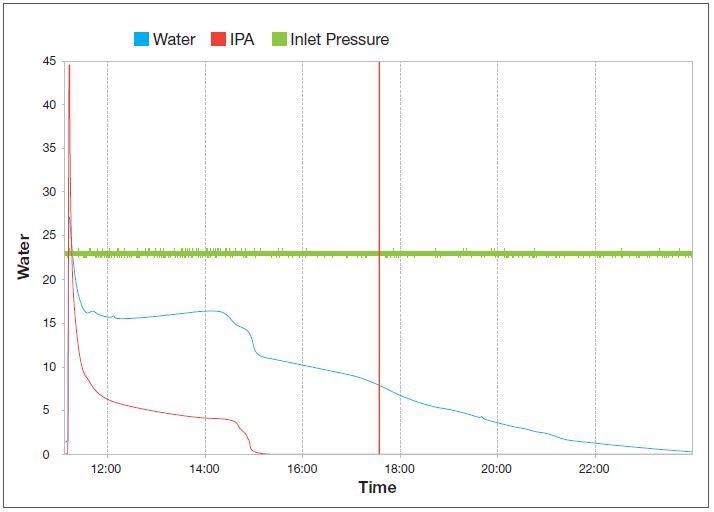
Figure 6. Two-solvent vacuum drying curve indicating the removal of water (blue line) and iso-propanol (red line) as the pressure drops from atmospheric to 2 mbar while the inlet pressure (green line) remains constant at 0.1 mbar. Image Credit: Thermo Fisher Scientific – Environmental and Process Monitoring Instruments
Summary
The Prima PRO process mass spectrometer provides the best available online measurement stability and precision for dryer process monitoring and control. Its fault-tolerant design combined with extended intervals between maintenance and simplified maintenance procedures ensure maximum availability of the analyzer.
Figure 7 shows the plug-n-play standard service kit shipped with each unit. The reliability of the Prima PRO mass spectrometer is demonstrated in its industry-best three-year parts and labor warranty.
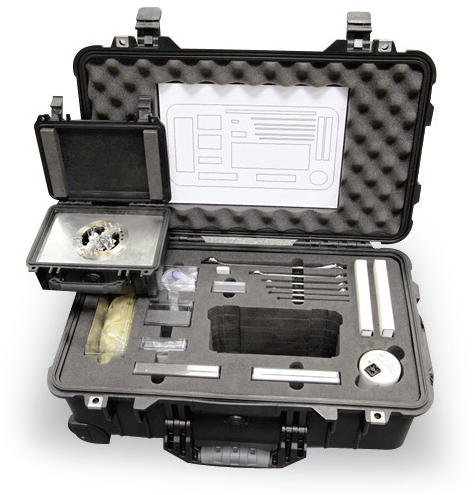
Figure 7. Prima PRO Process Mass Spectrometer service kit. Image Credit: Thermo Fisher Scientific – Environmental and Process Monitoring Instruments
Acknowledgments
Produced from materials originally authored by Graham Lewis from Thermo Fisher Scientific.

This information has been sourced, reviewed and adapted from materials provided by Thermo Fisher Scientific – Environmental and Process Monitoring Instruments.
For more information on this source, please visit Thermo Fisher Scientific – Environmental and Process Monitoring Instruments.