The word 'biotechnology' was first used in 19191 by Hungarian agricultural engineer Karl Ereky. The fermentation process plays a critical part in biotechnology, creating a large variety of key products in a number of industries:
- Biomaterials: energy efficient, biodegradable plastics
- Pharmaceuticals: vaccines, prophylactics, antibiotics, hormones like human insulin
- Animal nutrition: feed supplements, amino acids
- Bioenergy: bioalcohol fuels based on non-food based, low-value feedstocks
The utilization of online process analytical technology (PAT) has become a high-profile endeavor in the biotechnology industry in recent years.
Since the early 1980s, many fermentation scientists have been employing Thermo Scientific™ process mass spectrometers as PAT tools to monitor the composition of gas streams into and out of fermenters and bioreactors with precision and speed. Food additives, industrial enzymes, and vitamins are some other vital fermentation products.
Fermentation
Fermentation is the term which is employed by microbiologists to describe producing a product by means of the mass culture of a microorganism. This product can either be the microorganism’s own metabolite, the cell itself (biomass production), or a foreign product.
Microorganisms that carry out their metabolism via oxygen are known as aerobic microorganisms. A number of microorganisms can substitute sulfate or nitrate for oxygen and so will grow in the absence of oxygen. These microorganisms are known as anaerobic.
Types of Fermentation Process
There are three types of fermentation process:
Batch Fermentation
In the fermenter, a sterilized nutrient solution is inoculated with microorganisms and incubated. Oxygen is added (in case of aerobic microorganisms) together with acid or base to control the pH throughout the fermentation.
The biomass concentration, composition of the culture medium, and metabolite concentration usually constantly change because of cell activity.
Fed-Batch Fermentation
This is an enhancement of the closed batch process, where, as the fermentation progresses, a substrate is added in increments.
Continuous Fermentation
An open system is set up and sterile nutrient solution is continuously added to the bioreactor. At the same time, an equivalent amount of converted nutrient solution with microorganisms is harvested off the system.
Historically, bioreactors and fermenters were designed to be repeatedly utilized. This meant that the vessel had to be carefully sterilized between batches to avoid possible contamination.
‘Single-use’ vessels have become common recently, eradicating the requirement for time-consuming and costly sterilization schedules.
A Thermo Scientific™ HyPerforma™ 50 liter Single-Use Bioreactor (S.U.B.), which is employed in mammalian cell culture fermentation, is shown in Figure 1.
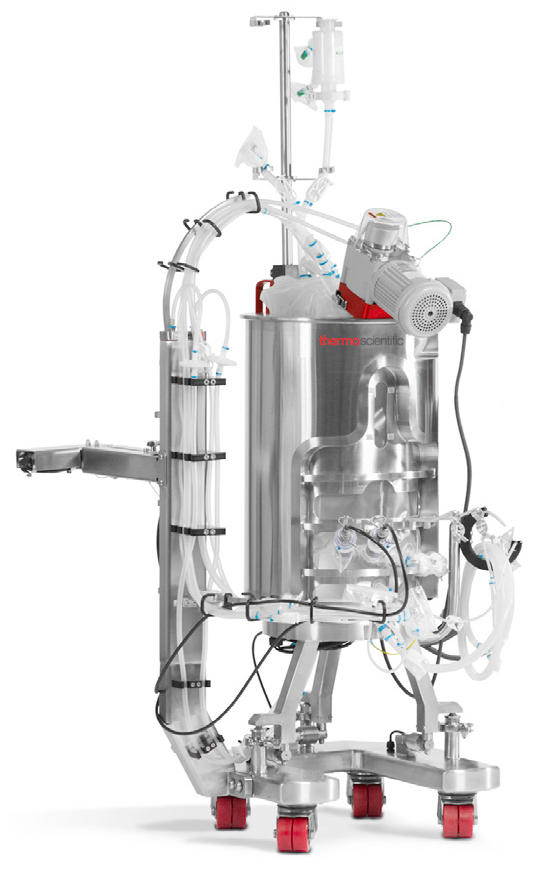
Figure 1. Thermo Scientific™ HyPerforma™ 50 L Single-Use Bioreactor (S.U.B.). Image Credit: Thermo Fisher Scientific – Environmental and Process Monitoring Instruments
The complete line of HyPerforma S.U.B.s includes 50, 100, 250, 500, 1,000, and 2,000-liter sizes, which help to ensure consistent scalability in addition to supplying a large variety of application usages.
Thermo Scientific also supplies SingleUse Fermentors (S.U.F.) of 30 and 300-liter sizes for employment in fungal or bacterial fermentation.
Three types of host organism are available for fermentation processes:
- Microbial: Moulds and yeasts like Saccharomyces cerevisiae (Brewers’ yeast). These are considered safe and have been utilized for a number of years, which makes product approval less challenging. They can produce high product volumes, which are relatively cheap.
- Bacteria: Lactic acid bacteria, Bacillus, and E coli. These provide high cell densities, fast growth, and cheap substrates. They are fairly simple to cultivate and scale up, but many are considered to be unsafe as pathogens. Product recovery can be a lot more challenging.
- Mammalian: Chinese Hamster Ovary (CHO) cells, hybridomas. These generate highly dedicated products in very specific and active forms such as monoclonal antibodies, vaccines, interferons, and recombinant therapeutic proteins. Production routes are more complex than microbial and bacterial processes, and the cell lines are more sensitive to shear and stress and less robust.
For more than 30 years, Thermo Scientific Gas Analysis Mass Spectrometers have been successfully utilized on bacterial and microbial processes. There has been increasing interest in mammalian cell culture more recently as they provide the prospect of radical advances in monoclonal antibodies, vaccines, and gene therapy.
Even though the needs of mammalian cell fermentation processes provide challenges to the off-gas analyzer, Thermo Scientific’s mass spectrometers have already proved invaluable in increasing yields and enhancing the understanding of mammalian cell cultures.
The Need for Gas Analysis
It is vital to monitor the state of the culture in any fermentation since its health determines the formation of unwanted by-products, the conversion rate of nutrients, and, in the worst case, the onset of poisoning. An ideal way of characterizing the fermentation is by analyzing the respiratory gases being fed into and removed from the fermenter.
It enables monitoring of the physiological state of the fermentation, including growth kinetics and substrate consumption, and is non-invasive. It also helps to establish the best point to halt the process for maximum yield.
Why Use Mass Spectrometry for Gas Analysis?
A number of fermentations are characterized by minute alterations in carbon dioxide and oxygen concentrations at critical phases of the fermentation, for instance, during the lag phase when the microorganisms exist in equilibrium with the nutrients. It is crucial that the technique utilized for measuring off-gas is capable of precise, quick analysis.
The speed of MS makes it perfect for the fermentation application, but speed must not be at the expense of accuracy. It is just as vital that precise data is gathered, or small changes in concentration will be lost.
Two common, untrue assumptions are that the quantification of carbon dioxide and oxygen in the off-gas is all that is needed when making the first steps towards process control and that good enough accuracy can be attained by discrete measurement technology.
To begin with, due to external biology, the sparge gas is always variable. There are animals and humans undergoing respiration, consuming O2 and generating CO2, but during daylight hours, there is also plant photosynthesis consuming CO2 and producing O2.
Next, depending on where they are in the regeneration cycle, the ubiquitous twin-tower desiccant dryer systems will either regurgitate or absorb CO2.
These influences can be seen in Figure 2, which shows an example of the day and night variations in sparge gas levels of CO2 and O2 measured over 24 hours with a Prima PRO process mass spectrometer.
It is only the accurate comparison of sparge gas and effluent gas that can give accurate pre-screening for possible contamination. Accurate comparison is also needed to calculate real-time information regarding the availability of nutrients and culture respiration.
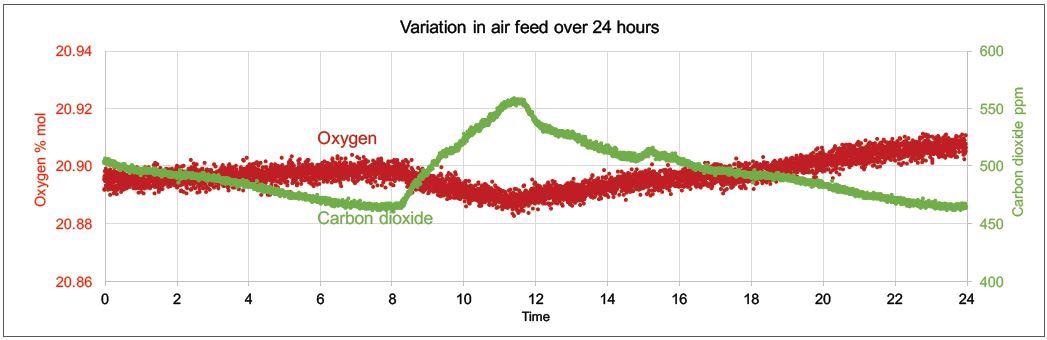
Figure 2. Example of day and night variations in sparge gas levels of CO2 and O2 measured with Prima PRO over 24 hours. Image Credit: Thermo Fisher Scientific – Environmental and Process Monitoring Instruments
Benefits of Magnetic Sector MS
In order to monitor fermentation processes, two types of MS have been utilized: quadrupole, where charged particles are separated in a variable RF field, and magnetic sector, where charged particles are separated in a variable magnetic field.
Thermo Fisher Scientific has over thirty years of industrial experience in producing both quadrupole and magnetic sector mass spectrometers and has demonstrated that the magnetic sector-based analyzer provides the best performance for fermentation off-gas analysis2,3.
Some of the key benefits of magnetic sector analyzers include better accuracy, precision, resistance to contamination, and long intervals between calibrations. Usually, depending on the gases analyzed and the complexity of the mixture, analytical precision is between 2 and 10 times better than a quadrupole analyzer.
At any particular mass position on a magnetic sector analyzer, the signal intensity is shown as a flat top peak, which means that any small drift in the mass scale will not lead to an alteration in signal intensity. With quadrupole mass spectrometers that supply rounded peaks, this is not the case.
The magnetic sector analyzers that are utilized in Thermo Scientific’s Prima family of mass spectrometers are laminated, so they scan at speeds equivalent to that of quadrupole analyzers to provide the unique combination of high stability and fast analysis.
The quick and extremely stable analysis of an unlimited number of user-defined gases is enabled using this method. Table 1 demonstrates the excellent long-term stability provided by the magnetic sector MS.
Table 1. Analysis of compressed air cylinder over 7 days by Prima BT magnetic sector MS. Source: Thermo Fisher Scientific – Environmental and Process Monitoring Instruments
| |
Nitrogen %mol |
Oxygen %mol |
Argon %mol |
Carbon dioxide ppm |
| Mean |
Std dev |
Mean |
Std dev |
Mean |
Std dev |
Mean |
Std dev |
| Day 1 |
78.0807 |
0.0028 |
20.9459 |
0.0026 |
0.9337 |
0.0003 |
396.84 |
1.31 |
| Day 2 |
78.0767 |
0.0023 |
20.9494 |
0.0023 |
0.9342 |
0.0003 |
397.46 |
1.25 |
| Day 3 |
78.0761 |
0.0024 |
20.9500 |
0.0023 |
0.9342 |
0.0003 |
397.34 |
1.28 |
| Day 4 |
78.0798 |
0.0023 |
20.9469 |
0.0023 |
0.9337 |
0.0003 |
396.31 |
1.31 |
| Day 5 |
78.0777 |
0.0030 |
20.9487 |
0.0028 |
0.9339 |
0.0003 |
396.76 |
1.34 |
| Day 6 |
78.0741 |
0.0023 |
20.9518 |
0.0022 |
0.9344 |
0.0003 |
397.47 |
1.27 |
| Day 7 |
78.0750 |
0.0023 |
20.9512 |
0.0022 |
0.9342 |
0.0003 |
397.23 |
1.30 |
A Prima BT benchtop gas analysis mass spectrometer was configured to analyze argon, oxygen, nitrogen and carbon dioxide in a cylinder of compressed air continuously for seven days, without recalibration or interruption.
In order to measure these four components, the analysis cycle time was 5 seconds. Day-to-day mean values for carbon dioxide varied by 1 ppm or less, and day-to-day mean values for nitrogen and oxygen varied by 0.005%.
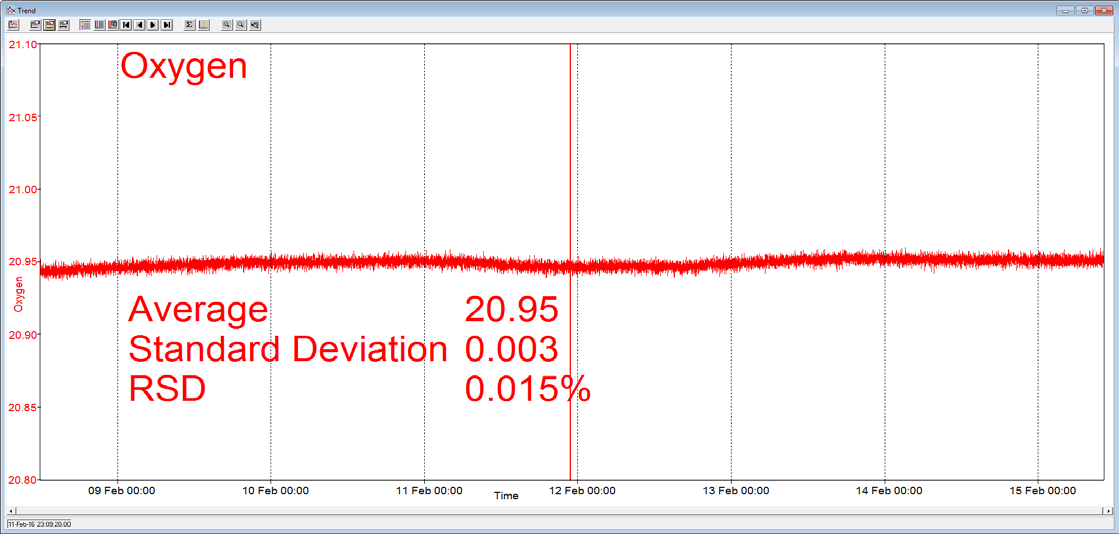
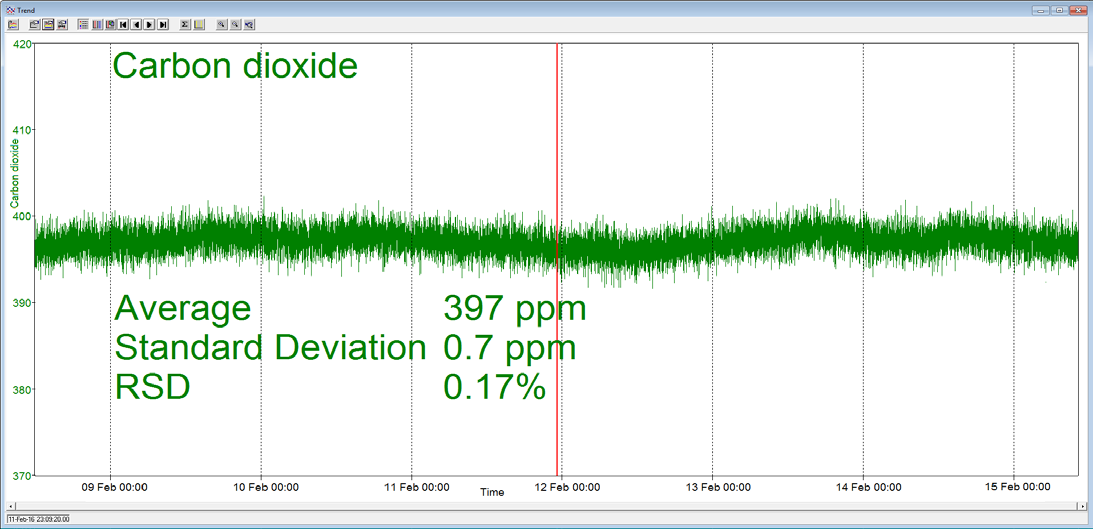
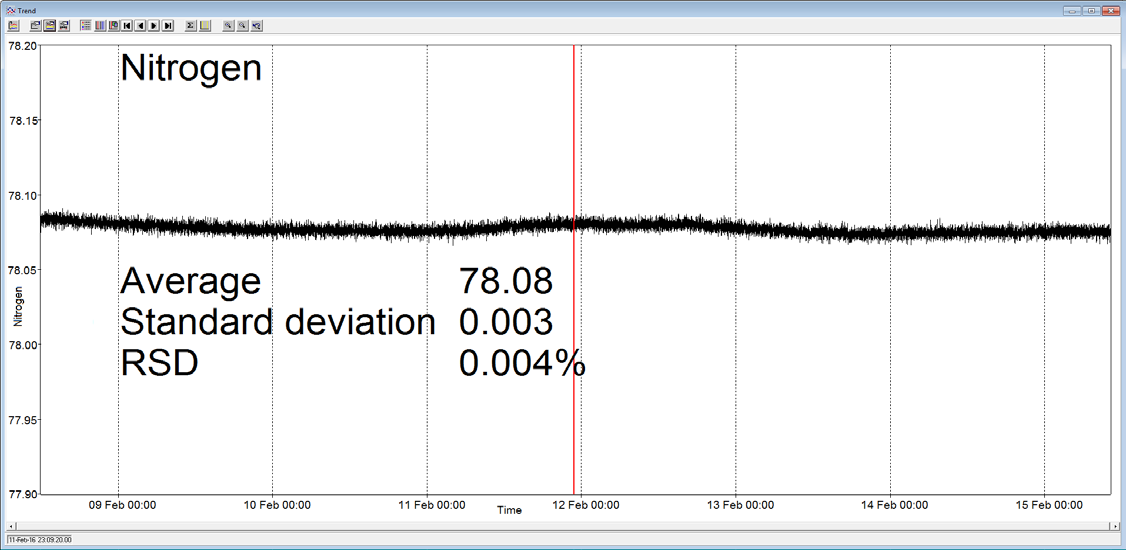
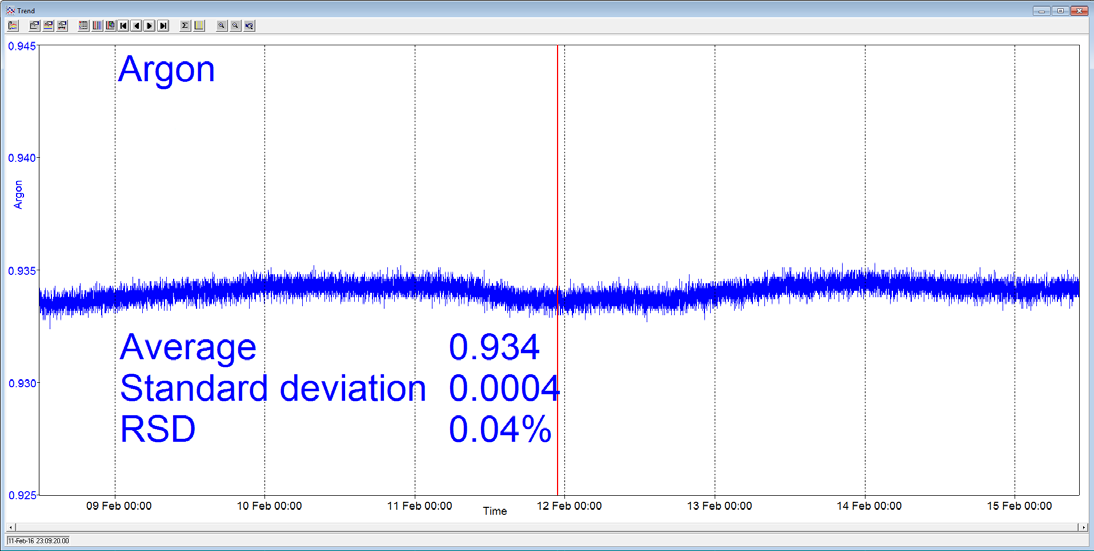
Figure 3. Long-term stability data from Prima BT magnetic sector MS. Image Credit: Thermo Fisher Scientific – Environmental and Process Monitoring Instruments
Rapid Multistream Sampling
In order for MS to monitor multiple bioreactors then a reliable and fast way to switch between streams is needed. Thermo Scientific developed the unique Rapid Multistream Sampler (RMS) because rotary valves suffer from poor reliability and solenoid valve manifolds have too much dead volume.
It provides an unmatched combination of reliability and sampling speed and enables sample selection from up to 64 streams. Stream settling times are fully user-configurable and application-dependent. The RMS includes digital sample flow recording for every stream chosen.
For example, this can be utilized to trigger an alarm if the sample flow drops, such as if a filter in the sample conditioning system becomes blocked. To ensure a fast response to even the most ‘sticky’ of volatiles, the RMS is heated.
Respiratory Quotient
The process whereby an organism oxidizes food to produce energy is known as Respiration. The Respiratory Quotient (RQ) is, therefore, a crucial control parameter in the fermentation process.
This is the ratio of the Carbon Dioxide Evolution Rate (CER) to the Oxygen Uptake Rate (OUR), and the complete calculation of RQ can be seen in Table 2.
Table 2. The respiratory quotient for fermentation off-gas analysis. Source: Thermo Fisher Scientific – Environmental and Process Monitoring Instruments
CER
(CO2 Evolution Rate) |
= |
(%Volume of CO2 out × flow out) |
- |
(%Volume CO2 in × Flow in) |
OUR
(O2 Uptake Rate) |
= |
(%Volume of O2 in × flow in) |
- |
(%Volume O2 out x Flow out) |
RQ
(Respiratory Quotient) |
= |
CER/OUR |
|
|
A high RQ means that high levels of CO2 are being generated, and so the metabolism is working at high efficiency. The RQ is also invaluable for identifying and controlling the carbon source being metabolized. For instance, the RQ will theoretically be 1 if glucose (or other carbohydrates) are the carbon source.
C6H12O6 + 6O2 → 6CO2 + 6H2O
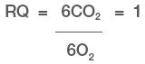
This equation does not cover the production of biomass or product formation; it only relates to combustion. So the RQ for glucose is unlikely to be 1.00; it may actually be around 1.04.
The accurate determination of RQ relies on establishing the ratio of the flows in and out of the bioreactor. This ratio is easily determined by a scanning MS, which is able to measure N2 and Ar in addition to O2 and CO2.
At least one of these two gases will be inert to the process so it can be effectively utilized to correct for the humidity change, which happens when the dry air feed gas is bubbled through the fermentor liquid.
Errors are introduced into the headspace data without this correction because of dilution by the additional water vapor4. Table 3 shows the calculation for RQ utilizing nitrogen as the flow correction. Thermo Scientific’s GasWorks® software calculates RQ as a standard feature for the fermentation application.
Table 3. Respiratory Quotient calculated by MS. Source: Thermo Fisher Scientific – Environmental and Process Monitoring Instruments
| = |
{CO2out |
x |
(N2in / N2out)} |
– |
CO2in |
| _________________________________________________________________________________________________________ |
| |
O2in |
– |
{O2out |
x |
(N2in / N2out )} |
Data from an E. coli fed-batch fermentation is shown in Figure 4. Thermo Scientific’s MS measures carbon dioxide, oxygen, nitrogen, and argon in both inlet and outlet and calculates RQ. A reagent is introduced to induce cells at temperature To, to change from multiplying to expressing the desired product.
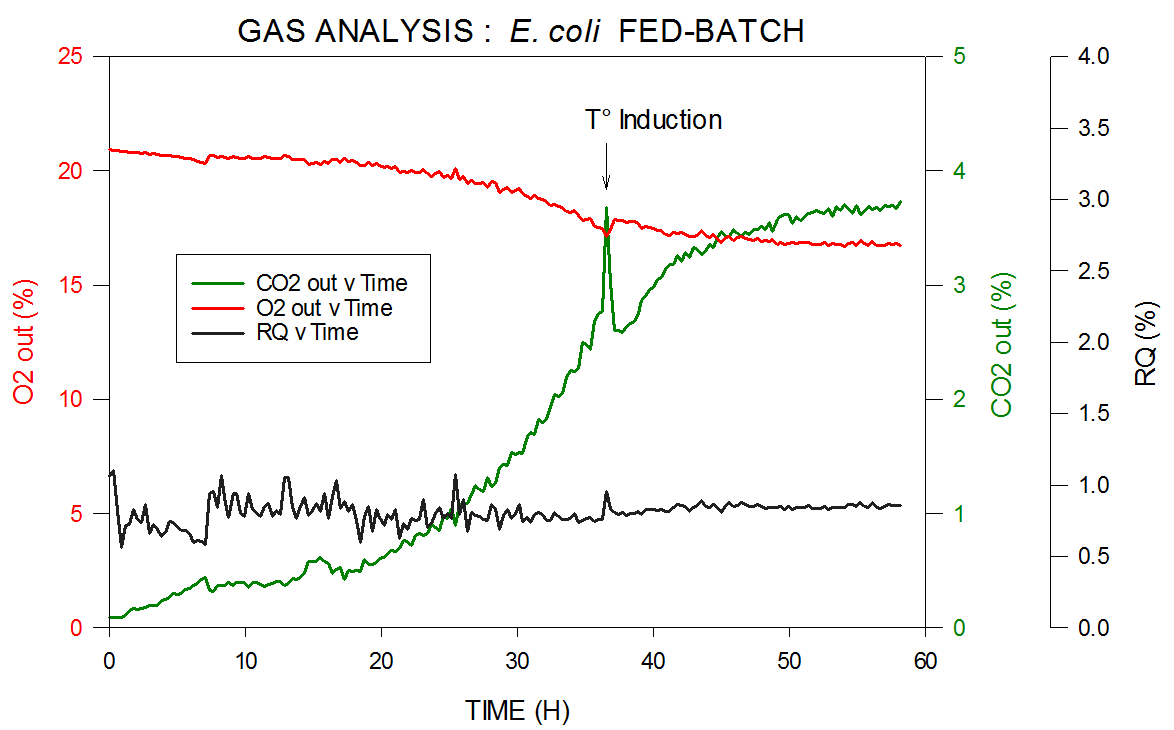
Figure 4. Off-gas and RQ data generated by MS from E. coli fed-batch fermentation. Image Credit: Thermo Fisher Scientific – Environmental and Process Monitoring Instruments
Analysis of Volatiles
In the off-gas, respiratory gases are not the only species of interest. In the headspace, volatile organics like ethyl acetate, methanol, ethanol, and even hydrogen sulfide can be found at ppm levels and their analysis can supply the user with vital information on the well-being of the fermentation.
Their analysis brings about some technical problems which must be overcome if the analytical data is to be meaningful. For instance, the measurement of trace levels of ethanol and methanol requires the measurement of the CH2OH+ fragment at mass 31.
The presence of an extremely large peak at mass 32 from the percentage levels of O2 in the vent gas must be considered. The tail from the 32 peak must be corrected to make an accurate measurement of trace alcohol levels.
The intensity of the tail from O2 at mass 31 compared with the intensity of the peak at mass 32 is around 0.02%. When the concentration of O2 is around 20%, this means the signal at mass 31 is equivalent to approximately 40 ppm. This interference is recorded during calibration so that subsequent analysis is corrected properly.
This interference level is a lot higher and also variable on a quadrupole MS leading to excessive uncertainty in low-level ethanol measurement. A low-level ethanol signal effectively gets ‘buried’ in the noise from the oxygen peak.
The measurement is extremely reproducible using a magnetic sector instrument and ethanol and methanol can be quantified with a precision down to 10 ppm. Data taken from an S. cerevisiae fed-batch fermentation can be seen in Figure 5.
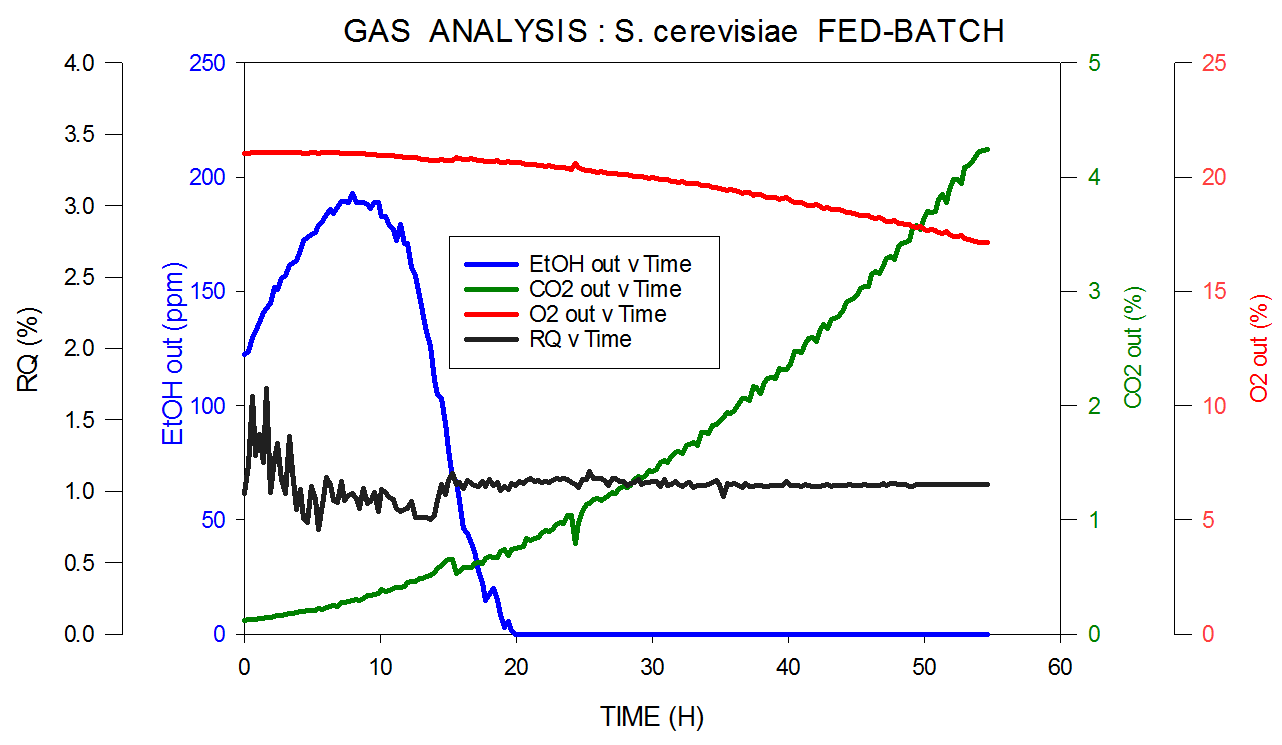
Figure 5. Off-gas and RQ data generated by MS from S. cerevisiae fed-batch fermentation. Image Credit: Thermo Fisher Scientific – Environmental and Process Monitoring Instruments
Thermo Scientific’s MS measures carbon dioxide, oxygen, nitrogen and argon in the inlet and it measures ppm levels of ethanol in the headspace in the outlet and calculates RQ. Ethanol is consumed as the initial carbon source, then to express the desired product, switched over to glucose.
It should be noted that since the volume of oxygen consumption is very low and the signal-to-noise ratio is correspondingly low, the precision is lower at the very beginning of the fermentation. This period where the cell count is extremely low is termed the lag phase. The precision improves quickly when the organisms start to multiply.
Table 4 shows the standard performance specifications for Thermo Scientific’s Prima PRO magnetic sector MS. Over 16 hours, precision is the standard deviation seen. Note the extremely high precision, 0.05% relative over 16 hours for oxygen.
For all six components, the analysis time, including stream switching time, is 30 seconds per stream. If ethanol and methanol are omitted from the analysis, this is decreased to just 10 seconds per stream.
Table 4. Example of a standard performance specification for Prima PRO Process MS. Source: Thermo Fisher Scientific – Environmental and Process Monitoring Instruments
| Component |
Concentration range
%mol |
The precision of analysis by Prima PRO
(single standard deviation) ≤ |
| Nitrogen |
0 – 100 |
0.005 %mol |
| Oxygen |
0 – 100 |
0.005 %mol |
| Argon |
0 – 1 |
0.001 %mol |
| Carbon dioxide |
0 – 10 |
0.1% relative or 0.0003 %mol* |
| Methanol |
0 – 1 |
2% relative or 0.001 %mol* |
| Ethanol |
0 – 1 |
2% relative or 0.001 %mol* |
*-Whichever is greater
Mammalian Cell Culture
The feed gas composition is relatively constant in bacterial and microbial fermentation, either air or air enriched with oxygen. The feed gas composition is an ever-changing mixture of numerous compounds (e.g., oxygen, nitrogen, and carbon dioxide) in mammalian cell fermentation.
The feed gas concentration ranges vary dramatically. For instance, carbon dioxide can vary from tens of parts per million to tens of percent. If an overlay gas is utilized, this introduces more complications as the overall inlet gas composition is a combination of overlay gas and sparge gas.
The employment of sodium bicarbonate as a pH buffer can also contribute to the carbon dioxide level in the outlet. These factors all contribute to a challenging set of needs for the off-gas analyzer if it is to supply meaningful online data to complement off-line data like viable cell count and metabolite concentration data.
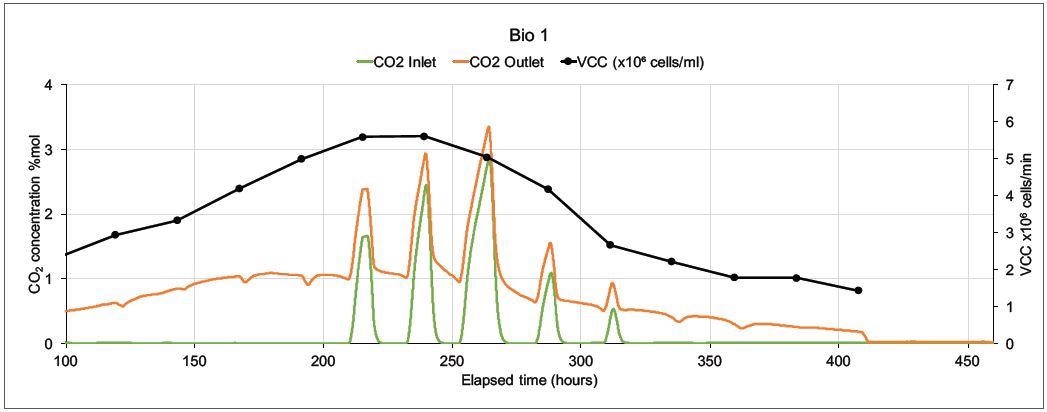
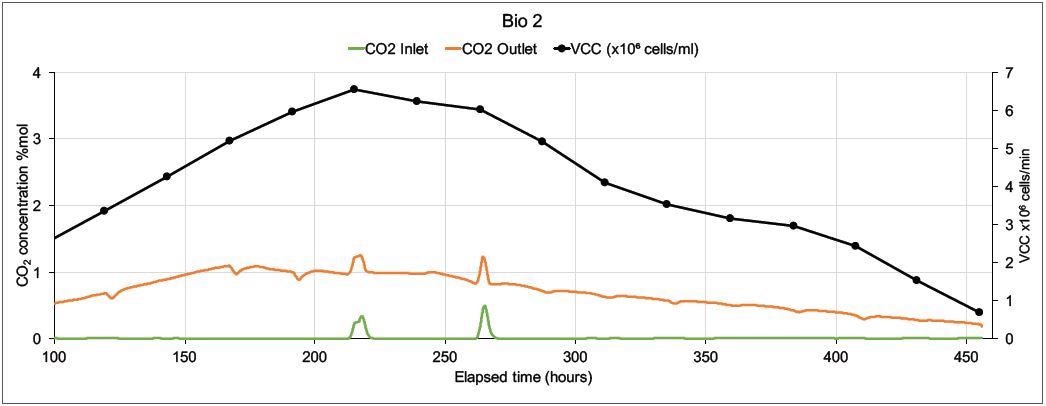
Figure 6. On-line CO2 inlet and outlet data and off-line Viable Cell Count data from two mammalian cell culture bioreactors. Image Credit: Thermo Fisher Scientific – Environmental and Process Monitoring Instruments
How the magnetic sector’s precision and speed can supply this valuable data is demonstrated in Figure 6. A Prima BT monitored two 5 liter bioreactors in which modified Chinese Hamster Ovary (CHO) cells were utilized to express monoclonal antibodies.
On both bioreactors, the MS analyzed inlet and outlet gases for O2, CO2, N2, and Ar. Other than the online MS measurements, cell count (both viable and total), glucose levels and lactate levels were analyzed off-line. There was only one inlet for each bioreactor, the sparge gas, which was a combination of O2, CO2, N2, and Air.
Carbon dioxide was used to control pH and oxygen feed was employed to control the dissolved oxygen. Including settling time, MS cycle time was 15 seconds per point, and to reduce noise caused by perturbations in sparge gas concentrations. The concentrations were averaged over 99 readings.
Figure 6 displays data from 100 hours onwards as there is not much activity at the start of the run. Bio 1 shows a very different inlet CO2 profile even though both bioreactors were controlled by the same controller. This is because significant quantities of CO2 were injected to adjust pH.
The more stable CO2 profile in Bio 2 resulted in a higher Viable Cell Count and an extended culture duration; the control strategy was modified in subsequent runs, resulting in further extensions in culture durations and increased VCC levels.
Scale-Up from Laboratory to Bulk Production
The manufacturing process usually starts with cell cultures grown in the laboratory. Cells are sequentially transferred to larger and larger fermentors next, during the scale-up process and eventually into production vessels, which are able to hold up to 20,000 liters of growth media and cells.
It is crucial to maintain the precise environment that specific cells require to remain healthy and grow – this needs precise off-gas analytical data in every stage of the scale-up process, from laboratory to pilot plant to bulk production.
In some instances, separate MS analyzers must be utilized in the laboratory and on the plant and in other instances, one mass spectrometer fitted with a suitable RMS multi-stream inlet can monitor all of the fermentors. To ensure a smooth transition through the various stages of scale-up, it is vital that results from the two analyzer platforms correlate.
The Prima BT, an example of a mass spectrometer suitable for fermentation process development, is shown in Figure 7. An example of a mass spectrometer suitable for production process monitoring, the Prima PRO, is shown in Figure 8.
Both systems share Thermo Scientific’s magnetic sector analyzer for high precision multi-component gas analysis and both supply the uniquely reliable Rapid Multistream Sampler.
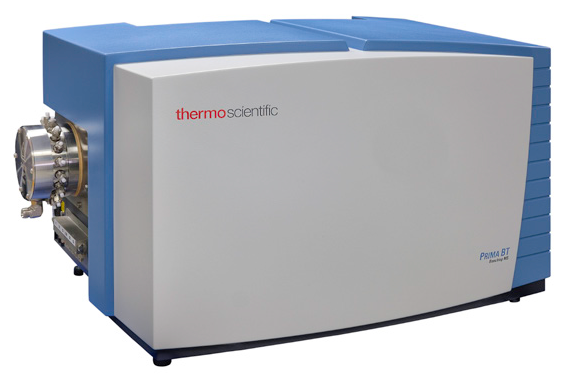
Figure 7. Prima BT process development MS. Image Credit: Thermo Fisher Scientific – Environmental and Process Monitoring Instruments
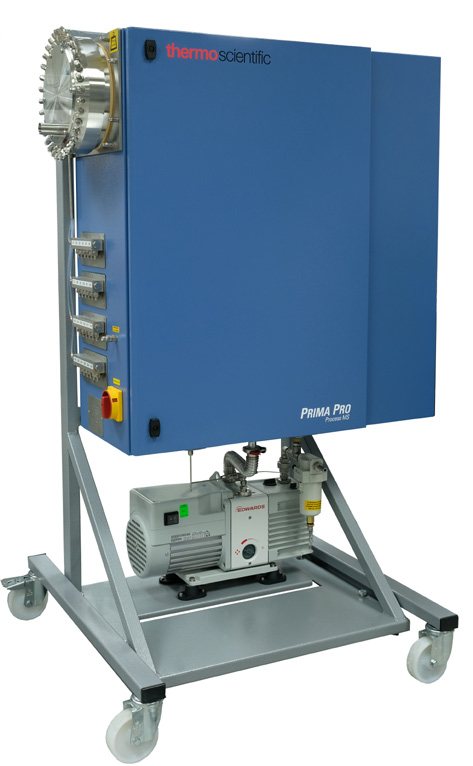
Figure 8. Prima PRO process MS. Image Credit: Thermo Fisher Scientific – Environmental and Process Monitoring Instruments
Summary
Magnetic sector mass spectrometers have shown the highest levels of precision for fermentation off-gas analysis and have been monitoring fermentor off-gas successfully at a number of the world’s leading pharmaceutical and biotechnology companies for many years.
The magnetic sector analyzer lends itself ideally to this demanding application by combining excellent stability with high speed. Thermo Fisher Scientific’s gas analysis MS product range, Prima BT, and Prima PRO provide fast, precise off-gas analysis through every stage of the fermentation and cell culture processes from laboratory to pilot plant to bulk production.
Prima PRO iscan monitor over 60 bioreactors without compromising sterility. Prima BT provides a benchtop solution for smaller-scale bioreactors, being configured with 15 samples and six calibration ports.
The complete, highly precise gas composition measurements supplied by both models are incorporated into the APC system easily. Large improvements in process control can be acquired extremely quickly, usually within a day or two of a start-up.
References and Further Reading
- M.G. Fári, U.P. Kralovánszky, The founding father of biotechnology: Károly (Karl) Ereky. Int. J. Hortic. Sci., Vol 12, n.1, p.9-12, 2006.
- David Pollard, Jens Christensen, Vent Gas Analysis, Encyclopaedia of Industrial Biotechnology: Bioprocess, Bioseparation, and Cell Technology 2010, John Wiley & Sons.
- Joseph S. Alford, Bioprocess control: Advances and challenges, Computers & Chemical Engineering Volume 30, September 2006.
- P.C. van der Aar, A.H. Stouthamer, H.W. van Verseveld, Possible misconceptions about O2 consumption and CO2 production measurements in stirred microbial cultures, Journal of Microbiological Methods Volume 9, Issue 4, June 1989.
Acknowledgments
Produced using materials originally authored by Graham Lewis from Thermo Fisher Scientific

This information has been sourced, reviewed and adapted from materials provided by Thermo Fisher Scientific – Environmental and Process Monitoring Instruments.
For more information on this source, please visit Thermo Fisher Scientific – Environmental and Process Monitoring Instruments.