When discussing the feasibility of a low concentration sensing application with a Raman spectroscopist, they are likely to suggest that Raman may not be sensitive enough, but SERS may work.

Image Credit: Metrohm AG
Yet, that does not get to the core of the actual difference between these two methods, and why SERS (surface-enhanced Raman scattering, or alternatively surface-enhanced Raman spectroscopy) is often recommended for low concentration applications.
Here, the technical differences between Raman and SERS spectroscopies will be explored, as well as some of the practical considerations for how to regard the data for each.
In standard Raman spectroscopy, a laser source is directly focused on to a sample (Fig. 1a). The bonds of the analyte scatter the laser light, and the inelastically scattered light is gathered and processed into a Raman spectrum.
The technique’s non-destructive nature, the selectivity of Raman bands and insensitivity to water make Raman a practical tool for both qualitative and quantitative analysis of organic and inorganic systems.
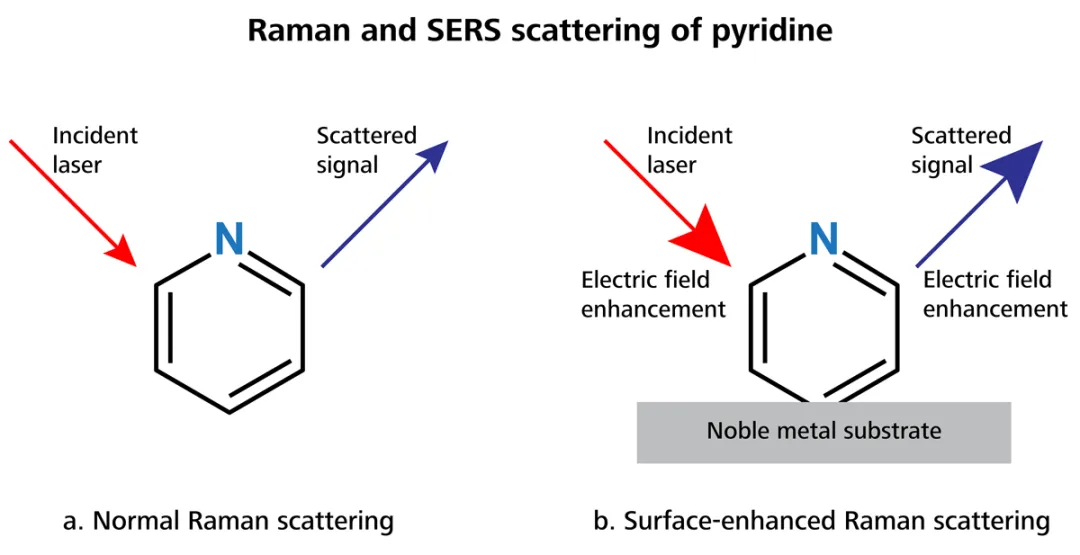
Figure 1. Image Credit: Metrohm AG
For decades, in real-world applications, Raman spectroscopy was an underused technique.
This could be down to two significant limitations: 1) the intrinsic insensitivity of Raman, as only ~1 in 106 incident photons are Raman scattered; and 2) fluorescence emission interference, which is associated with the excitation wavelength and the nature of the analyte molecule used.
Fluorescence is a phenomenon that competes with and is much more efficient than Raman scattering and thereby overwhelms the Raman signal.
Though dependent on the analyte molecule and the sample matrix’s scattering strength in question, standard limits of detection for traditional Raman scattering can range between ~1–10% in concentration.
For precise applications such as the detection of diseases or identification of narcotics, this limit may be many orders of magnitude greater than what is necessary. In this case, an application scientist might advise using a SERS measurement.
The requisite hardware would be identical to a normal Raman measurement, but SERS analysis requires different sampling. To understand this difference, the SERS effect should be considered.
In the 1970s, numerous research groups saw that the Raman signal from organic molecules like pyridine was enhanced substantially when adsorbed to a metallic substrate that had been roughened (Fig. 1b) [1–3].
While several theories surfaced accounting for this observation, it is accepted more generally today that the mechanism for enhancement is two-fold: the electromagnetic enhancement mechanism represents the dominant contribution, while a chemical mechanism represents a reduced portion of the enhancement.
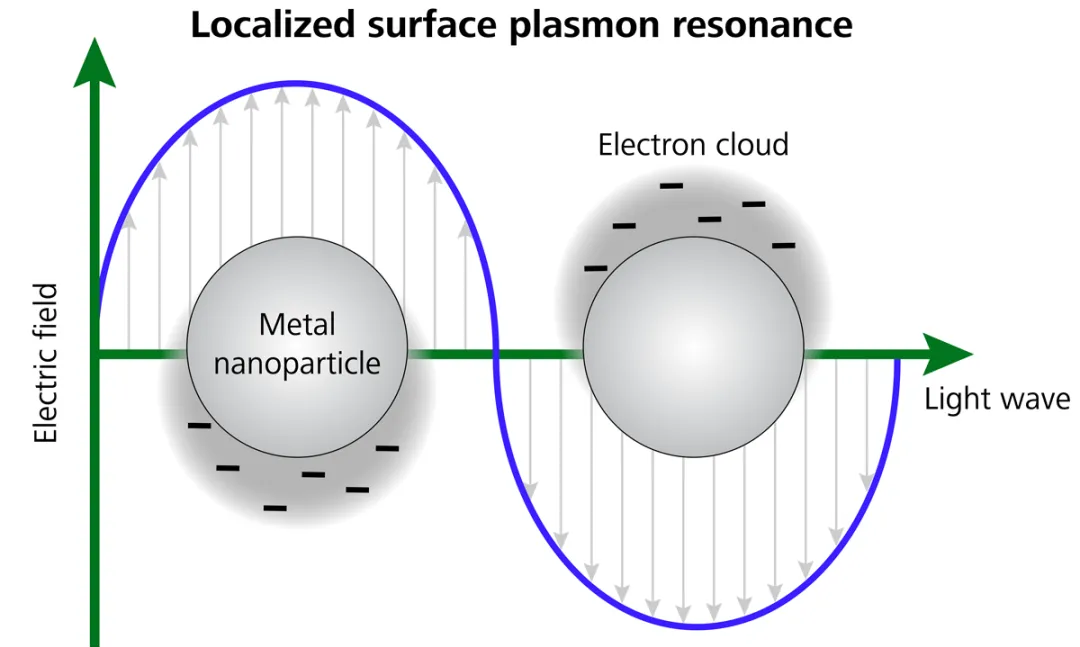
Figure 2. Image Credit: Metrohm AG
The electromagnetic enhancement mechanism is facilitated by utilizing a roughened nanometallic substrate fabricated from a noble metal (usually silver or gold), and the appearance of localized surface plasmons, which are quantized oscillations of the valence electrons of the selected metal.
The laser drives the localized surface plasmons into resonance, or excites the ‘LSPR’ when it excites the sample/nanosubtrate complex (Fig. 2). Thus, amplification occurs in both the laser excitation radiation and the scattered radiation of the sample.
The arrows in Fig. 1b are shown in bold to demonstrate this increase in magnitude. Theoretically, this mechanism can account for signal enhancement by factors as great as 1011 [4].
The chemical mechanism calls for charge-transfers in resonance with the laser excitation wavelength and usually represents a theoretical enhancement factor of up to 104 [5].
Fluorescence that interferes can also be extinguished by these charge transfers. With the enhancement mechanisms combined, it is possible to overcome both the intrinsic insensitivity and fluorescence interference that inhibits conventional Raman scattering.
What is more, is that there are studies that detail the fact SERS has the capacity to detect single molecules [6,7].
In the last two decades, the fabrication of these nanostructures has been an ever-growing area of academic research. SERS substrates can incorporate solid nanospheres, colloidal suspensions and silicon chips coated in metal.
The improvement tends to be at its greatest when the analyte molecule is positioned at a junction of nanostructures (also known as a SERS ‘hotspot’), so researchers can customize the shapes and the plasmonic activity of these substrates to attain even greater levels of amplification for their research purposes.
There are also substrates commercially available for SERS to use for real-world applications. These substrates have been developed with ease-of-use, flexibility and low cost in mind, but they may not be as sensitive as highly ordered substrates.
Metrohm offers both a chip-based SERS substrate and a paper-based SERS substrate mounted to a glass slide.
After consultation with an application scientist, users may decide that a commercial SERS substrate is appropriate for their application. For other applications, enhanced sensitivity may be necessary to meet the limits of detection.
In this instance, it may be possible to collaborate with local university labs that work on nanofabrication measurements.
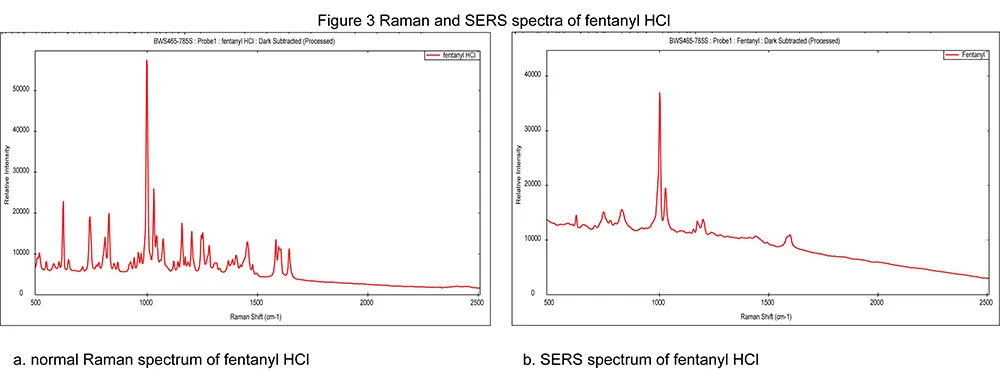
Figure 3. Image Credit: Metrohm AG
Questions often arise, such as, “Can we use our existing Raman reference library to analyze our SERS spectrum?” Figure 3 demonstrates the difference on a commercial SERS substrate between a normal Raman spectrum of fentanyl HCl (Fig. 3a), and a SERS spectrum of a saturated solution of fentanyl HCl (Fig. 3b).
The standard Raman spectrum for fentanyl contains considerably more peaks than the relative SERS spectrum. The SERS bands are also visibly wider than the standard Raman bands.
In the case of the SERS spectra, probing of the vibrational modes of the molecule is conducted parallel to probing the sample as adsorbed to the substrate. Hence, it may be observed that some peaks in a SERS spectrum can be associated purely with the substrate.
Because of the variability between a SERS spectrum and a normal Raman spectrum, it may be tricky in some cases to utilize commercial Raman libraries for the analysis of SERS spectra.
Metrohm recommends that users who need SERS identification generate their own SERS spectral databases using their substrates. SERS-specific narcotics libraries are also included on some TacticID handheld Raman products. For more intricate data analysis, there is also a comprehensive SERS literature base to call upon.
In applications requiring low concentration sensing, or where fluorescence engulfs the Raman signal, SERS is a technique critical for both researchers and real-world problem solvers alike. For further information, visit Metrohm’s website.
References
- D.L. Jeanmaire and R.P. Van Duyne, J. Electroanal, Chem. 84, 1–20 (1977).
- M.Fleischmann, P.J.Hendra, and A.J. McQuillan, Chem. Phys. Lett. 26, 163-166 (1974).
- M.G. Albrecht and J.A. Creighton, J. Am. Chem. Soc. 99, 5215-5217 (1977).
- J.P. Camden , J. A. Dieringer, Y. Wang, D.J. Masiello, L.D. Marks, G.C. Schatz, and R.P. Van Duyne, J. Am. Chem. Soc. 130, 12616–12617 (2008).
- R. Pilot, R. Signorini, and L Fabris, “Surface-Enhanced Raman spectroscopy: Principles, Substrates, and Applications.” In Deepak F.L., editor. Metal Nanoparticles and Clusters: Advances in Synthesis, Properties and Applications. Springer; Cham, Switzerland: 2018. pp. 89–164.
- J.A. Dieringer, R.B. Lettan, K.A. Scheidt, and R.P Van Duyne, J. Am. Chem. Soc.129, 16249–16256 (2007).
- K. Kneipp, Y. Wang, H. Kneipp, L.T. Perelman, I. Itzkan, R.R. Dasari, and M.S. Feld, Phys. Rev. Lett. 78, 1667-1670 (1997).

This information has been sourced, reviewed and adapted from materials provided by Metrohm AG.
For more information on this source, please visit Metrohm AG.