Both AC and DC techniques can be utilized to analyze thermoset and composite cure. AC dielectric cure monitoring, also known as Dielectric Analysis (DEA) agitates a sensor with a sinusoidal signal of a particular frequency and amplitude, applying a DC bias of zero volts. The measured frequency independent resistance, or ion viscosity, corresponds to the cure state of the Material Under Test (MUT). Similarly, DC resistance cure monitoring probes a material but alternatively uses a excitation voltage VDC that remains constant.
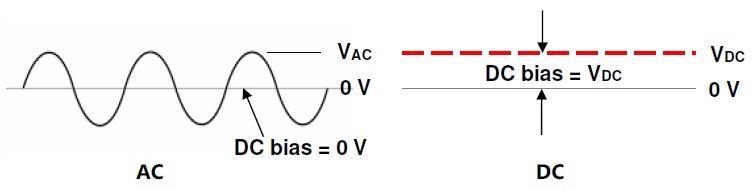
Figure 4-1. AC and DC signals. Image Credit: Lambient Technologies
AC and DC cure monitoring are complimentary, yet electrochemical reactions can influence DC results. Comparatively, AC measurements have no DC bias and zero average current, and do not endure electrochemical effects. While DC techniques can quantify cure state, they must be carefully utilized with a good understanding of their potential.
AC and DC Cure Monitoring
AC dielectric cure monitoring, also referred to as Dielectric Analysis (DEA), measures a polymer’s capacitance and resistance, which are bulk properties utilized in the conventional electrical model of a resin as displayed in Figure 4-2. Capacitance and resistance can be scaled with a sensor’s cell constant to generate the material properties of resistivity (ρ) and permittivity (ε’).
Resistivity possesses a frequency independent (ρFI) component because of the flowing mobile ions and a frequency dependent (ρAC) component as a result of the rotation of stationary dipoles.
While often referred to as DC resistivity, frequency independent resistivity in effect stretches across a range of frequencies that includes DC (0 Hz). The shift in frequency independent resistivity is relative to the change in viscosity prior to gelation and proportional to the shift in modulus post-gelation.
To highlight the relationship with mechanical viscosity; in the early 1980s the term ion viscosity (IV) was conceived as a synonym for frequency independent resistivity. Ion viscosity is defined below:
(Eq. 4-1) IV = ρFI (ohm-cm)
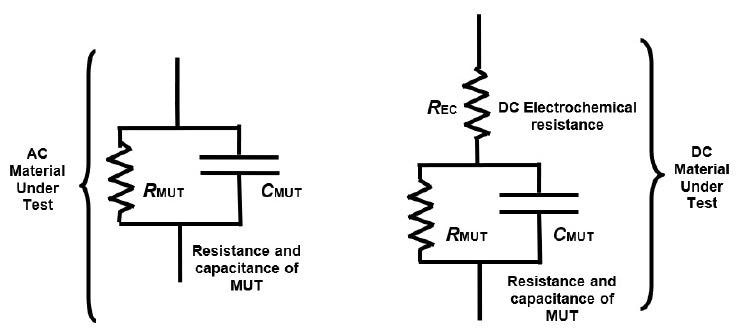
Figure 4-2. AC and DC electrical models of thermoset resins. Image Credit: Lambient Technologies
Throughout the early to mid-cure stages, an electrochemical reaction under DC bias is the probable cause of differences between DC and AC measurements. While the electrochemistry’s nature is not known, the DC response during cure can be replicated by adding a DC electrochemical resistance1 to the standard model of a resin as in Figure 4-2.
Comparison of AC and DC Measurements
By exploiting the wide frequency range, AC measurements can probe material state from the beginning to the end of cure. Comparatively, ordinary DC methods pass a current through the material under test with a constant voltage.
AC and DC techniques are complimentary but the measurement choice necessitates a comprehensive knowledge of their capabilities and limitations:
- DC measurements can only acquire DC resistance
- DC resistance incorporates an additional DC electrochemical resistance
- AC methods measure frequency independent resistance, frequency dependent resistance, and capacitance.
- DC measurements diverge away from AC measurements during early and mid-cure
- As the material cures DC electrochemical resistance decreases, which over time reduces the discrepancy as plotted in the illustration of Figure 4-3
- DC and AC measurements align at the end of cure
- AC ion viscosity avoids the effects of DC electrochemistry
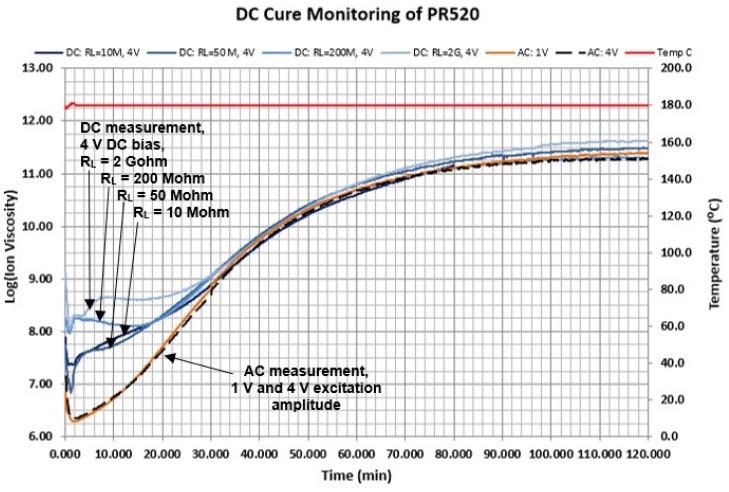
Figure 4-3. AC and DC measurements during cure of PR520 epoxy. Image Credit: Lambient Technologies
- It is not possible to take DC measurements through vacuum bags or release films
- Insulating layers impede DC current and hinders DC resistance measurement
- AC sensors with the appropriate design can measure through release films and vacuum bags2
- Systematic errors are present in DC measurements that may be a result of other DC signals
- Offset voltage drifts, thermal drifts, and leakage currents are DC in nature and cannot be differentiated from the true DC response
- DC sensors with the appropriate design can limit or eradicate systematic errors
- AC measurements are unresponsive to DC systematic errors
- AC measurements may display distortions as a result of electrode polarization
- Electrode polarization may impact AC data at low frequencies throughout the early cure
- Distortion caused by electrode polarization is not observed in AC measurements at high frequencies
- The effects of electrode polarization can be mathematically corrected 3,4,5
- DC measurements experience electrochemical effects that limit electrode polarization
- AC measurements for materials showing exceptional resistance may require prolonged measurement times
- AC measurements at higher frequencies (shorter measurement times) may be utilized for most thermosets at increased temperatures
- Increased temperatures diminish the resistivity of thermosets
- AC measurements possessing extremely low frequencies (long measurement times) may be required if materials demonstrate extreme resistivity
- Extreme resistivity can arise in thermosets at room temperature at the end of cure
- For extremely resistive materials, DC measurements are much faster in contrast to the AC measurement time that may be exceptionally long
Electrode Polarization in AC Measurements
At low frequencies a blocking layer across sensor electrodes can occur as a result of the phenomenon of electrode polarization (EP) during early cure; when the material is most conductive, this leads to unusually high apparent ion viscosities.3,4,5
Figure 4-4 shows a plot of resistivity from AC measurements of five-minute epoxy. All data is plotted against an axis marked ion viscosity and may be called ion viscosity collectively.
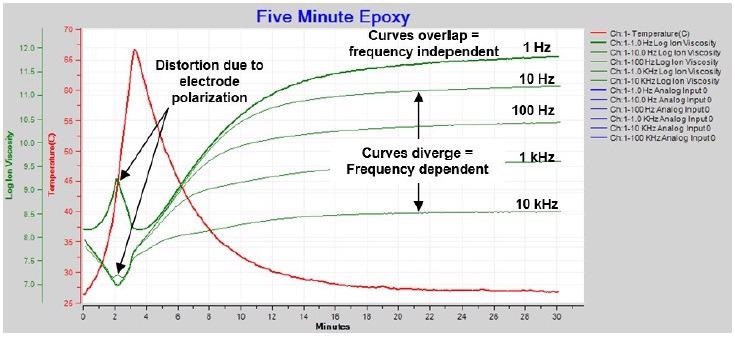
Figure 4-4. Ion viscosity / resistivity during cure of 5-minute epoxy. Image Credit: Lambient Technologies
There are three features that can be seen in Figure 4-4:
- Curves that overlap or nearly overlap, signifying the dominance of frequency independent resistivity, or true ion viscosity
- As a result of the movement of mobile ions
- Corresponds well with cure state
- Curves that diverge, signifying the dominance of frequency dependent resistivity
- As a result of the rotation of dipoles
- Does not correspond well with cure state
- Distortion of 1 Hz and 10 Hz curves after approximately 2 minutes as a result of electrode polarization
At the start of the cure, electrode polarization distorts the 1 Hz data as illustrated in the extended plot of Figure 4-5. Measurements at 10 Hz demonstrate the distortion to a lesser degree due to the boundary layer effect decreasing with increasing frequency. Moreover, measurements at even greater excitation frequencies – 1 kHz to 10 kHz – demonstrate no distortion and properly distinguish the ion viscosity minimum.
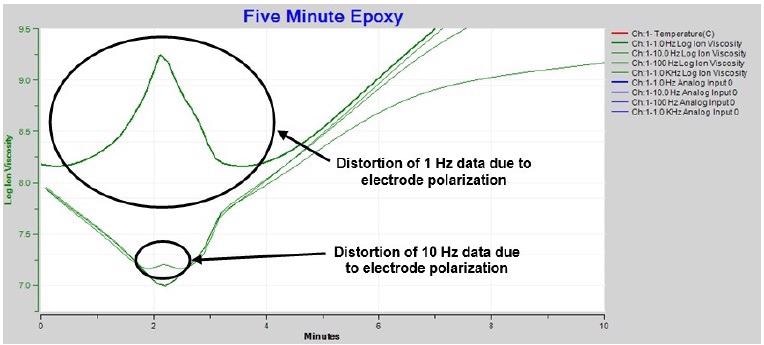
Figure 4-5. Expanded ion viscosity / resistivity around time of minimum viscosity. Image Credit: Lambient Technologies
In several cases it is feasible to mathematically restore information about cure.
Figure 4-6 illustrates how boundary layer correction — also known as electrode polarization (EP) correction — recovers the data affected.
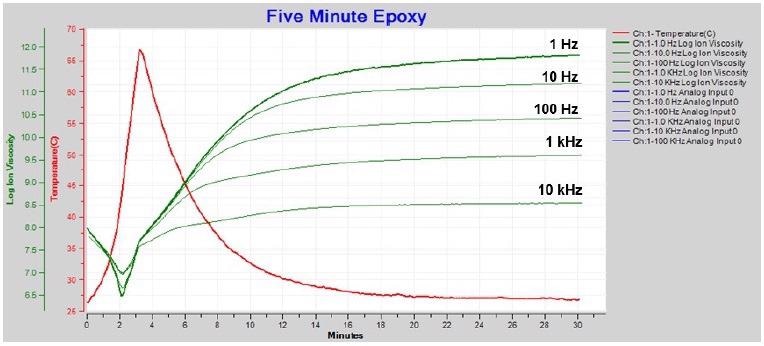
Figure 4-6. Resistivity / ion viscosity with boundary layer (EP) correction. Image Credit: Lambient Technologies
1 Hz and 10 Hz ion viscosity show a proper minimum after boundary layer correction, and are consistent with the higher frequency data. It is also possible to utilize just 1 Hz ion viscosity to follow the whole five-minute epoxy cure as seen in Figure 4-7.
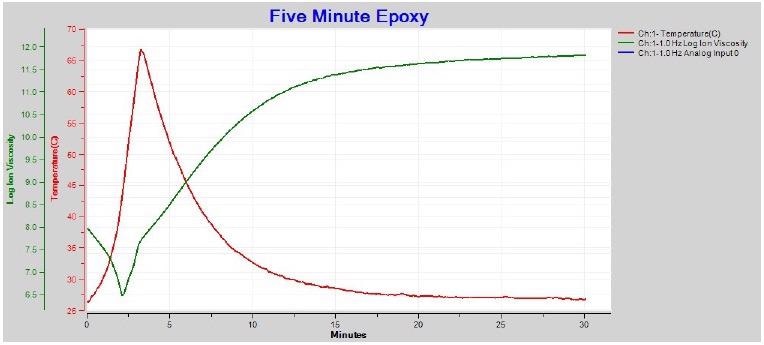
Figure 4-7. 1 Hz ion viscosity with boundary layer (EP) correction. Image Credit: Lambient Technologies
AC and DC Measurements with Release Films and Vacuum Bags
Release films hinder the adhesive qualities of molded parts to a tool, and vacuum bags facilitate atmospheric pressure to compress composites during the Vacuum Assisted Resin Transfer Molding (VARTM) process. Figure 4-8 shows a sensor in a mold with release film, which is usually fabricated using PTFE or another electrically insulating material. As insulators block DC signals, it is not possible to conduct cure monitoring in this situation with DC methods. However, an appropriately designed dielectric sensor, facilitates AC cure monitoring through a vacuum bag or a release film.
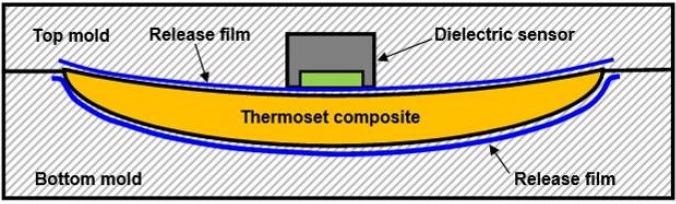
Figure 4-8. Dielectric sensor with release film. Image Credit: Lambient Technologies
Figure 4-9 displays a Lambient Technologies 1” Single-Electrode dielectric sensor6 fitted into a press platen and protected with PTFE-based release film from Northern Composites HTF-6217 that is just 0.001” thick.
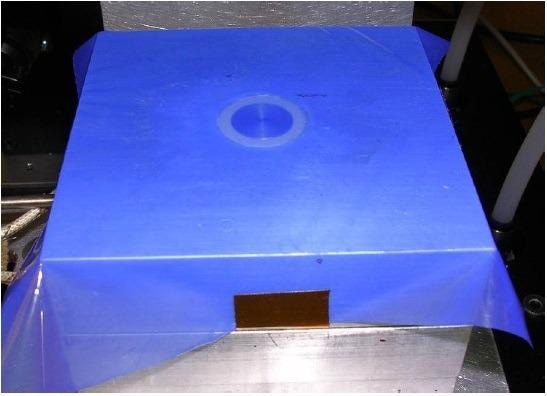
Figure 4-9. 1” Single Electrode Sensor in press platen with HTF-621 release film. Image Credit: Lambient Technologies
Figure 4-10 displays the ion viscosity measured through the release film throughout the cure of PR5208 – a pre-mixed epoxy utilized for resin transfer molding (RTM).
Insulating films produce a boundary layer that influences data in a similar way to how electrode polarization does. The ion viscosity curves are distorted as a result for all but the highest frequency.
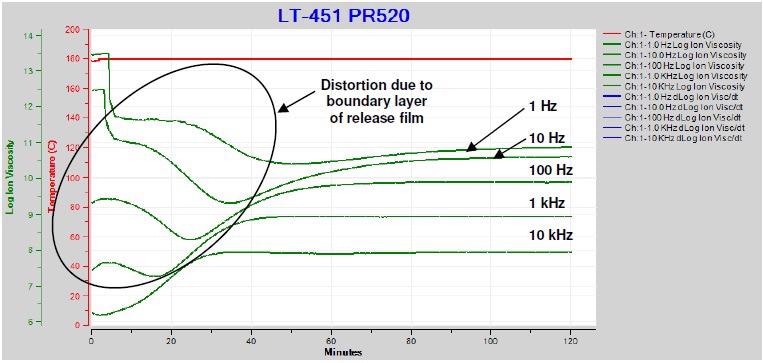
Figure 4-10. Ion viscosity of PR520 during cure with release film. Image Credit: Lambient Technologies
In a number of cases mathematical correction is possible for adjusting the distortion and restoring the information about the cure. Figure 4-11 demonstrates how boundary layer correction recovers the impacted data.
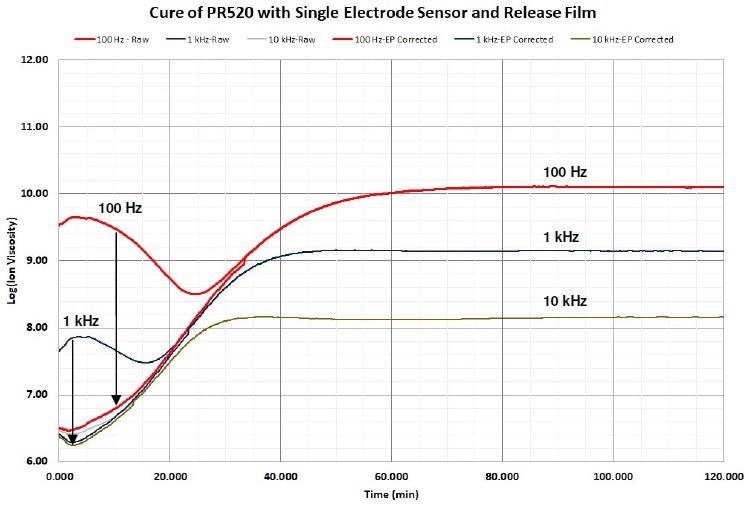
Figure 4-11. Ion viscosity of PR520 before and after EP (boundary layer) correction, 1 Hz and 10 Hz not shown for clarity. Image Credit: Lambient Technologies
Subsequent to the boundary layer correction and after software eliminates any data dominated by a dipolar response (frequency dependent resistivity), ion viscosity measured through the release film follows ion viscosity measured with direct sensor contact, contrasted in Figure 4-12.
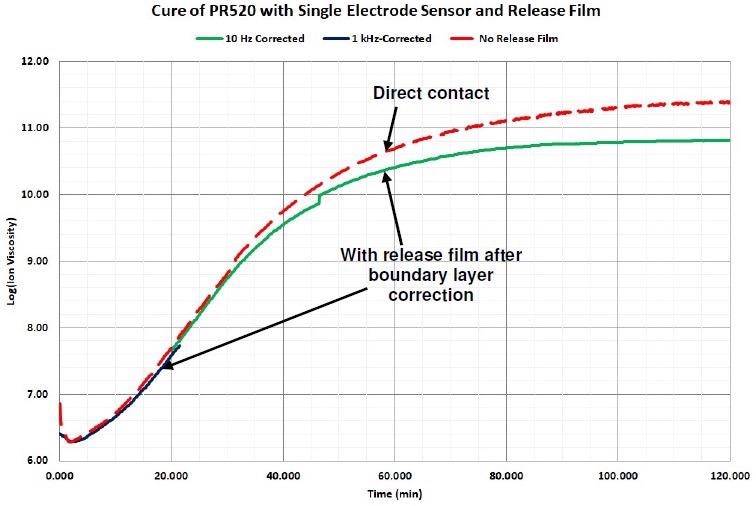
Figure 4-12. Comparison of ion viscosity without release film and with release film after boundary layer correction. Image Credit: Lambient Technologies
Due to the fact that insulators impede DC signals, it is necessary to place the sensor in direct contact with the composite part when taking DC resistance measurements with release films or vacuum bags. It is also necessary for the release film or vacuum bag to have a hole for the sensor and gaskets to seal the hole. A characteristic layup for a DC sensor is shown in the exploded view of Figure 4-13 and the photo seen in Figure 4-14.
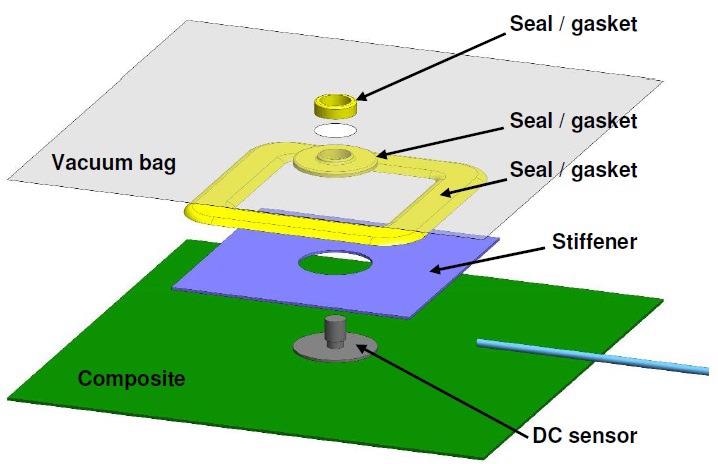
Figure 4-13. Typical layup for cure monitoring with a DC sensor and vacuum bag. Image Credit: Lambient Technologies
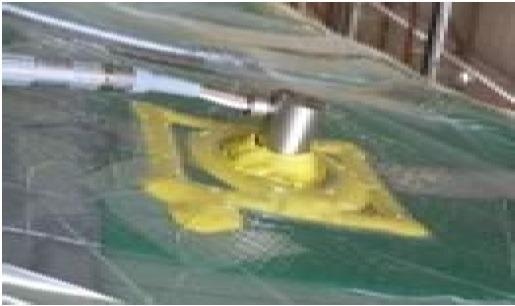
Figure 4-14. Layup for cure monitoring with a DC sensor and vacuum bag9. Image Credit: Lambient Technologies
Comparatively, an AC dielectric sensor may be positioned on top of the release film and vacuum bag, with no hole in the film necessary, as in Figure 4-15.
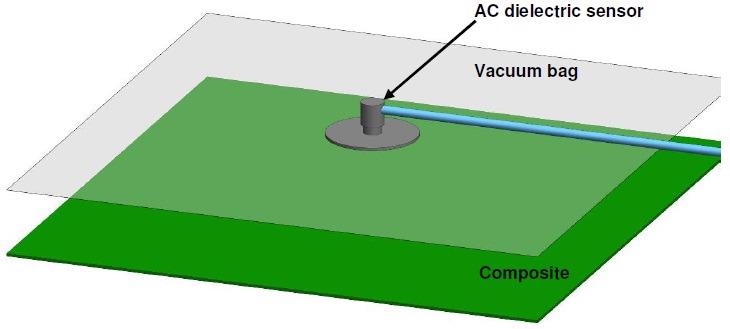
Figure 4-15. Layup for cure monitoring through vacuum bag with an AC sensor. Image Credit: Lambient Technologies
Conclusion
AC and DC measurements can be complimentary and it is crucial to possess an awareness of the respective capabilities of each when determining the best method to use. While AC resistance or ion viscosity can probe the entire cure of thermosets and composites with accuracy, DC resistance demonstrates disparities by way of contrast during early to mid-cure. However, throughout end of cure, the AC and DC results align.
The disparities in DC measurements are a probable result of a current- driven electrochemical reaction. While the nature of the electrochemistry is not known, the DC response during cure can be replicated by adding a DC electrochemical resistance.
For monitoring the thermoset cure, electrode polarization can distort AC data at low frequencies in the early cure. However, it is feasible to mathematically correct the data that has been distorted. DC methods facilitates rapid measurements of excessively resistant materials, while AC measurements for these same materials may necessitate extremely low frequencies and prolonged data acquisition times.
DC methods demand direct contact with the thermoset or composite, and cannot effectively measure through release films and vacuum bags. Thus, AC measurements are specifically useful throughout manufacturing. With the capacity to monitor cure through insulators, AC methods facilitate the convenient use of sensors through a release film, eliminating problems associated with the adhesion of a material to the sensor. Moreover, AC measurements through the vacuum bag prevent the introduction of breakages in the bag that could become a potential source of leakage in vacuum assisted resin transfer molding (VARTM) and other similar processes.
References
- Lambient Technologies application note AN3.33, “Electrochemical Effects in AC and DC Cure Monitoring”
- Lambient Technologies application note AN3.20, “Cure Monitoring Through Release Films and Vacuum Bags”
- Day, D.R.; Lewis, J.; Lee, H.L. and Senturia, S.D., Journal of Adhesion, V18, p.73 (1985)
- Lambient Technologies application note AN3.29, “Electrode Polarization and Boundary Layer Effects”
- Lambient Technologies application note AN3.19, “Electrode Polarization with AC and DC Cure Monitoring”
- 1” Single-Electrode sensor, manufactured by Lambient Technologies, Cambridge, MA USA. https://lambient.com
- HTF-621 manufactured by Northern Composites, Greensboro, NC USA. https://northerncomposites.com
- Cycom PR520N RTM manufactured by Solvay, Brussels, Belgium
- Gardiner, Ginger, “DC Dielectric Sensors for Industrial Composites Production, Composites World, (Feb. 24, 2020). https://www.compositesworld.com/

This information has been sourced, reviewed and adapted from materials provided by Lambient Technologies.
For more information on this source, please visit Lambient Technologies.