A range of plant protection products, such as pesticides, are utilized in the production of crops destined for use in animal feed. Animal feed may be comprised of cereals, fodder crops or silage and manufactured feedstuffs.
These plant protection products – including herbicides, insecticides and fungicides - may be ingested or otherwise absorbed by livestock in three primary ways:
- Direct application of the product to the animal
- Via residues in feeding stuffs
- Treatment of the animal’s accommodation1
The European Commission (EC) has defined maximum residue limits (MRLs) for pesticide residues. These are provided in legislative framework Regulation (EC) 396/2005. A default limit of 0.01 mg/kg is applied to any pesticide not listed in the documentation.2
This framework has historically focused on residues in food products, but new harmonized regulations have come into force which also includes a requirement to monitor pesticides in animal feed and feed ingredients.
MRLs are applied to feeds fed to animals or feeds placed on the market. Animal feed represents a potential indirect route for consumer exposure to pesticide residues, so it is important that these do not exceed levels that present an unacceptable risk to animals or humans.
The European Commission’s General-Directorate for Health and Food Safety (DG SANTE) has published a guidance document on pesticide residue analysis in food and feed.
This document outlines a series of analytical quality control measures, specifying performance requirements that laboratories should adhere to when seeking to validate their analytical methods.
The latest guidance is published under SANTE/12682/2019,3 and provides information on the required ion ratio (quantifier/qualifier) range, retention time deviation and selectivity criteria to ensure consistent and reliable quantification results.
The analytical method’s sample preparation component typically follows the QuEChERS (Quick, Easy, Cheap, Effective, Rugged and Safe) procedure. This procedure is based on extraction with acetonitrile, followed by a dispersive solid phase clean-up step.4
Acetonitrile is suitable for use with high-performance liquid chromatography tandem mass spectrometry (LC/MS/MS), solidifying LC/MS/MS as the method of choice for pesticide analysis.5,6
The study presented here reports on the development of a rapid, sensitive and selective multi-residue method for the analysis of 94 pesticides in animal feeding stuffs.
The goal is to quantify all pesticides below the regulated limit of 0.01 mg/kg. The method employs a PerkinElmer QSight® 220 triple quadrupole mass analyzer.
Table 1. LX50 UHPLC Parameters. Source: PerkinElmer Food Safety and Quality
| . |
. |
| Column |
Quasar SPP Pesticide column, 100x4.6 mm, 2.7 μm (N9306880) |
Mobile
Phase |
Solvent A: 3 mM ammonium formate + 0.1% formic acid in H2O
Solvent B: 3 mM ammonium formate + 0.1% formic acid in Methanol |
| Gradient |
| Step |
Time
[min] |
Flow Rate
[ml/min] |
%A |
%B |
| 1 |
0 |
0.8 |
95 |
5 |
| 2 |
0.5 |
0.8 |
95 |
5 |
| 3 |
4 |
0.8 |
50 |
50 |
| 4 |
12 |
0.8 |
0 |
100 |
| 5 |
15 |
0.8 |
0 |
100 |
| 6 |
15.1 |
0.8 |
95 |
5 |
| 7 |
18 |
0.8 |
95 |
5 |
|
Injection
Volume |
10 μL |
| Temperature |
Oven 40 °C
Autosampler 10 °C |
Table 2. QSight ESI Source Parameters. Source: PerkinElmer Food Safety and Quality
| . |
. |
| Ionization Mode |
ESI with positive and negative polarity switching |
| Drying Gas |
120 |
| HSID Temperature |
200 °C |
| Nebulizer Gas |
350 |
| Spray Voltage |
+5100 V / -4500 V |
| Source Temperature |
315 °C |
| Detection Mode |
Time managed MRM™ with 46 experiments
min. dwell time 5 ms, max. 270 ms |
Experimental
Hardware and Software
A PerkinElmer LX50 UHLC system was used for chromatographic separation of pesticides. A PerkinElmer QSight 220 triple quadrupole mass spectrometer with a dual ionization source was used for subsequent analyte determination.
The Simplicity 3Q™ software was used for all instrument control, data acquisition and data processing.
Instrumental Parameters
Tables 1 and 2 display the UHPLC method and MS source parameters. Table 3 provides a list of multiple reaction monitoring (MRM) mode transitions and parameters of the studied pesticides. These include both the positive and negative analytes.
MS analysis parameters are automatically defined as the pesticides of interest from the built-in compound library in the Simplicity 3Q software’s time-managed-MRM module to facilitate robust method development.
In instances where the pesticide was not found in the library, the MS was autotuned using an infused standard solution - a 1 μg/ml concentration in 0.1% formic acid in methanol.
The instrument’s cycle time was set in line with the anticipated peak width, while dwell times were automatically optimized thanks to the built-in algorithm, ensuring that enough data points were available to ensure reliable quantification.
Table 3. Overview of pesticides retention time, MRM transitions (parent, quantifier, qualifier) and parameters (CE – collision energy; EV – entrance voltage; CCL2 – collision cell lens 2 voltage). Analytes denoted with a * were measured in negative ionization mode. Source: PerkinElmer Food Safety and Quality
| Name |
RT |
Parent
[m/z] |
Quantifier
[m/z] |
CE |
EV |
CCL2 |
Qualifier
[m/z] |
CE |
EV |
CCL2 |
| Mevinphos |
5.77 |
225 |
127 |
-23 |
23 |
-40 |
193 |
-11 |
22 |
-40 |
| Allidochlor |
6.28 |
174 |
98 |
-18 |
11 |
-37 |
41 |
-39 |
8 |
-37 |
| Tricyclazole |
6.28 |
190 |
163 |
-27 |
5 |
-66 |
136 |
-37 |
32 |
-54 |
2-4 Dimethyl-
phenylformamide |
6.38 |
150 |
107 |
-30 |
23 |
-43 |
106 |
-46 |
22 |
-51 |
| Terbacil* |
6.91 |
215.1 |
159.1 |
21 |
-3 |
48 |
161.1 |
22 |
-17 |
48 |
| Hexazinone |
6.96 |
253.2 |
171.1 |
-23 |
27 |
-50 |
71.3 |
-46 |
21 |
-54 |
| Flutriafol |
7.53 |
302 |
123 |
-45 |
19 |
-64 |
95 |
-69 |
30 |
-60 |
| Atrazine |
7.71 |
216 |
174 |
-25 |
29 |
-44 |
176 |
-23 |
8 |
-40 |
| Metazachlor |
7.76 |
278.1 |
134.2 |
-33 |
17 |
-60 |
210.1 |
-11 |
17 |
-48 |
| Lenacil |
7.84 |
235 |
153 |
-24 |
12 |
-40 |
136 |
-44 |
10 |
-60 |
| Norflurazon |
7.85 |
304 |
284 |
-32 |
38 |
-75 |
160 |
-41 |
22 |
-71 |
| Propachlor |
7.90 |
212 |
170 |
-20 |
23 |
-43 |
94 |
-37 |
22 |
-59 |
Azinphos-
Methyl |
8.04 |
318.1 |
260.8 |
-11 |
6 |
-48 |
124.9 |
-30 |
17 |
-52 |
| Phosmet |
8.07 |
318 |
160 |
-34 |
20 |
-56 |
76.9 |
-69 |
5 |
-72 |
| Methacrifos |
8.09 |
241.1 |
125.1 |
-26 |
20 |
-46 |
209 |
-11 |
20 |
-50 |
| Diphenamid |
8.17 |
240.1 |
134 |
-28 |
29 |
-57 |
91 |
-60 |
29 |
-57 |
| Fluridone |
8.19 |
330.1 |
310 |
-40 |
53 |
-96 |
259 |
-66 |
40 |
-116 |
| Iprodione |
8.19 |
330.2 |
259.2 |
-67 |
68 |
-106 |
294.2 |
-57 |
59 |
-150 |
| Dimethachlor |
8.24 |
256 |
224 |
-20 |
7 |
-53 |
148 |
-35 |
8 |
-61 |
| Pyrmethanil |
8.27 |
200.1 |
107.1 |
-33 |
31 |
-54 |
183.1 |
-30 |
8 |
-62 |
| Linuron |
8.35 |
249 |
159.9 |
-24 |
22 |
-59 |
182 |
-21 |
22 |
-51 |
| Clomazone |
8.38 |
240.1 |
125 |
-28 |
28 |
-45 |
127 |
-28 |
27 |
-49 |
| Propanil |
8.38 |
218 |
162.1 |
-18 |
28 |
-44 |
127.1 |
-35 |
26 |
-56 |
| Fludioxonil* |
8.54 |
247.1 |
180 |
37 |
-39 |
80 |
126.1 |
42 |
-39 |
76 |
| Flutolanil |
8.71 |
324 |
262 |
-26 |
21 |
-67 |
242 |
-35 |
22 |
-71 |
| Terbuthylazine |
8.75 |
230.1 |
96 |
-37 |
29 |
-70 |
174.1 |
-25 |
28 |
-54 |
| Malathion |
8.80 |
331.2 |
127.1 |
-16 |
25 |
-60 |
285.2 |
-11 |
24 |
-60 |
| Paclobutrazol |
8.80 |
294.1 |
125.1 |
-59 |
25 |
-86 |
70.1 |
-30 |
29 |
-50 |
| Propyzamide |
8.84 |
256 |
190 |
-20 |
22 |
-51 |
173 |
-30 |
22 |
-51 |
| Myclobutanyl |
8.97 |
289 |
70 |
-27 |
7 |
-56 |
125 |
-47 |
32 |
-60 |
| Isazophos |
9.04 |
314 |
120 |
-37 |
28 |
-68 |
162 |
-23 |
28 |
-56 |
| Pyridaphenthion |
9.05 |
341.1 |
189 |
-29 |
36 |
-68 |
92 |
-55 |
32 |
-76 |
| Triadimefon |
9.10 |
294.1 |
197.1 |
-20 |
9 |
-58 |
225.1 |
-17 |
21 |
-62 |
| Triazophos |
9.10 |
314 |
162 |
-25 |
29 |
-56 |
119 |
-48 |
18 |
-68 |
| Triadimenol |
9.11 |
296.1 |
70 |
-33 |
5 |
-50 |
70 |
-74 |
17 |
-70 |
| Folpet |
9.13 |
296.2 |
227.2 |
-17 |
12 |
-60 |
199.2 |
-21 |
12 |
-56 |
| Azinphos-ethyl |
9.19 |
346.1 |
132.2 |
-30 |
4 |
-56 |
77.2 |
-67 |
4 |
-72 |
| Fluquinconazole |
9.24 |
376 |
349 |
-27 |
27 |
-81 |
307 |
-36 |
35 |
-105 |
| Bupirimate |
9.35 |
317 |
166 |
-30 |
26 |
-60 |
108 |
-37 |
39 |
-80 |
| Fipronil* |
9.44 |
435 |
250 |
39 |
-22 |
84 |
330 |
23 |
-1 |
80 |
| Acetochlor |
9.57 |
270 |
148 |
-25 |
8 |
-49 |
133.1 |
-45 |
14 |
-49 |
| Alachlor |
9.60 |
270.1 |
162.2 |
-35 |
7 |
-60 |
238.2 |
-16 |
14 |
-52 |
| Cyprodinil |
9.64 |
226 |
93 |
-47 |
31 |
-64 |
77 |
-57 |
2 |
-72 |
| Etridiazole |
9.64 |
247.1 |
165.1 |
-30 |
61 |
-50 |
167.1 |
-21 |
57 |
-66 |
| Flusilazole |
9.64 |
316 |
247 |
-25 |
22 |
-72 |
165 |
-36 |
22 |
-64 |
| Fenamiphos |
9.65 |
304.2 |
217.1 |
-30 |
33 |
-66 |
202.1 |
-49 |
30 |
-90 |
| Metolachlor |
9.70 |
284.2 |
176.2 |
-31 |
21 |
-68 |
252.2 |
-18 |
23 |
-56 |
| Parathion |
9.71 |
292.1 |
236 |
-20 |
17 |
-64 |
123.1 |
-47 |
21 |
-68 |
| Tetrachlorvinphos |
9.77 |
365 |
127.1 |
-21 |
29 |
-64 |
204 |
-49 |
30 |
-92 |
| Quinalphos |
9.80 |
299 |
162.9 |
-34 |
35 |
-64 |
96.9 |
-46 |
6 |
-56 |
| Sulfotep |
9.82 |
323 |
97 |
-70 |
22 |
-88 |
171 |
-19 |
22 |
-60 |
| Fenthion |
9.90 |
279 |
169.1 |
-25 |
31 |
-58 |
247 |
-17 |
27 |
-54 |
| Tebuconazole |
9.91 |
308 |
70 |
-27 |
5 |
-54 |
125 |
-61 |
13 |
-102 |
| Penconazole |
9.99 |
284.1 |
70.2 |
-36 |
41 |
-54 |
159 |
-37 |
41 |
-74 |
| Vinclozolin |
9.99 |
286.1 |
161.1 |
-43 |
40 |
-66 |
163.1 |
-33 |
40 |
-62 |
| Edifenphos |
10.06 |
328 |
283 |
-24 |
1 |
-76 |
109 |
-66 |
8 |
-76 |
| Diazinon |
10.07 |
305 |
169 |
-30 |
28 |
-60 |
97 |
-47 |
28 |
-68 |
| Fonofos |
10.07 |
247 |
109 |
-28 |
16 |
-48 |
137 |
-15 |
18 |
-48 |
| Propisochlor |
10.09 |
284 |
224 |
-14 |
22 |
-55 |
212 |
-21 |
21 |
-59 |
| Chlorfenvinphos |
10.11 |
359 |
155.1 |
-18 |
28 |
-62 |
127.1 |
-30 |
25 |
-66 |
| Coumaphos |
10.13 |
363 |
227 |
-33 |
21 |
-80 |
307 |
-23 |
22 |
-72 |
| Phosalone |
10.14 |
368 |
182 |
-25 |
29 |
-60 |
111 |
-57 |
27 |
-64 |
Pirimiphos-
methyl |
10.19 |
306.2 |
108.1 |
-42 |
41 |
-68 |
164.1 |
-29 |
41 |
-68 |
| Pyraclofos |
10.22 |
361 |
111 |
-86 |
36 |
-88 |
138 |
-57 |
37 |
-88 |
| Bromfenvinfos |
10.24 |
405 |
155.1 |
-18 |
26 |
-72 |
99.1 |
-50 |
25 |
-68 |
Tolclophos-
methyl |
10.28 |
301 |
175.1 |
-35 |
24 |
-72 |
269.1 |
-21 |
29 |
-64 |
| Phorate |
10.29 |
261 |
75.3 |
-36 |
9 |
-44 |
97 |
-41 |
7 |
-68 |
| Pyrazophos |
10.31 |
374.2 |
222.2 |
-29 |
37 |
-68 |
194.1 |
-43 |
36 |
-84 |
| Prochloraz |
10.37 |
376.1 |
308.1 |
-12 |
22 |
-64 |
70.2 |
-41 |
21 |
-72 |
Chlorpyriphos-
methyl |
10.42 |
321.7 |
125.2 |
-30 |
15 |
-60 |
290 |
-21 |
27 |
-60 |
| Disulfoton |
10.44 |
275 |
61.2 |
-50 |
10 |
-48 |
89.2 |
-36 |
12 |
-48 |
| EPN |
10.48 |
324 |
157.2 |
-34 |
26 |
-68 |
296.2 |
-19 |
31 |
-60 |
| Pebulate |
10.63 |
204 |
128 |
-16 |
22 |
-39 |
57 |
-25 |
22 |
-43 |
| Di-Allate |
10.75 |
269.9 |
86 |
-21 |
28 |
-49 |
109 |
-40 |
28 |
-65 |
| Triflumizole |
10.75 |
346 |
278 |
-15 |
12 |
-62 |
73 |
-22 |
8 |
-58 |
| Cycloate |
10.81 |
216 |
83 |
-24 |
8 |
-45 |
154 |
-17 |
28 |
-41 |
| Pretilachlor |
10.94 |
312.1 |
176.1 |
-35 |
22 |
-60 |
252.2 |
-23 |
22 |
-64 |
| Profenofos |
11.00 |
373 |
303 |
-25 |
27 |
-82 |
128 |
-59 |
29 |
-94 |
| Terbufos |
11.08 |
289 |
103.2 |
-14 |
5 |
-50 |
57.1 |
-71 |
6 |
-82 |
Pirimiphos-
ethyl |
11.09 |
334.2 |
198.2 |
-28 |
35 |
-68 |
182.1 |
-32 |
25 |
-68 |
| Tebufenpyrad |
11.19 |
334.2 |
117.1 |
-59 |
51 |
-72 |
145 |
-36 |
49 |
-68 |
| Ethion |
11.20 |
385 |
199 |
-15 |
21 |
-72 |
171 |
-26 |
21 |
-64 |
| Methoxychlor |
11.20 |
345.1 |
219.9 |
-24 |
36 |
-72 |
185.1 |
-37 |
38 |
-80 |
| Oxadiazon |
11.20 |
362 |
177 |
-44 |
5 |
-79 |
220 |
-32 |
9 |
-75 |
| Pyriproxyfen |
11.30 |
322 |
96 |
-21 |
3 |
-66 |
185 |
-31 |
5 |
-66 |
Piperonyl-
Butoxide |
11.35 |
356.2 |
177.2 |
-24 |
10 |
-60 |
119 |
-48 |
10 |
-60 |
| Sulprofos |
11.45 |
323 |
219 |
-22 |
22 |
-60 |
247 |
-16 |
16 |
-60 |
| Tri-Allate |
11.53 |
304 |
143 |
-35 |
25 |
-63 |
86 |
-25 |
22 |
-55 |
| Carbophenothion |
11.55 |
343 |
157 |
-25 |
15 |
-60 |
199 |
-12 |
2 |
-64 |
| Chlorthiophos |
11.59 |
361 |
305 |
-21 |
19 |
-72 |
333 |
-16 |
21 |
-68 |
| Propargite |
11.62 |
368.2 |
231.1 |
-16 |
16 |
-62 |
175 |
-23 |
22 |
-58 |
| Prothiofos |
12.16 |
345 |
241 |
-25 |
23 |
-72 |
269 |
-16 |
5 |
-68 |
| Leptophos |
12.23 |
412.8 |
171 |
-32 |
21 |
-84 |
77 |
-99 |
21 |
-108 |
| Pyridaben |
12.23 |
365.2 |
147.1 |
-34 |
19 |
-72 |
309.2 |
-14 |
21 |
-60 |
| Etofenprox |
12.58 |
394.2 |
177.1 |
-21 |
4 |
-60 |
183.1 |
-36 |
22 |
-60 |
Standard Preparation
Pesticide standards were acquired from Restek. These were provided in six prepared mixes at concentrations of 1000 μg/ml. Solvents used were all of MS grade.
Triphenyl phosphate (TPP) was employed as a procedural internal standard (IS) to account for potential matrix effects and numerous sources of errors during every stage of the method. Earlier experiments for TPP have demonstrated extraction efficiencies between 70% and 120%.
Calibration curves were constructed using five levels (0.1, 5, 10, 50 and 100 ng/ml in triplicate) of standards prepared in a neat solution of acetonitrile. These were also constructed in the same concentrations in the sample matrix (matrix-matched calibration).
Initially, matrix effects were assessed via a comparison between slopes of calibration curves from the neat solution and the feed cornmeal sample matrix, with no internal standard correction.
The final quantitative result calculation was completed using IS reprocessed calibration curves. Two MRM transitions were monitored for each individual pesticide. LOQs (limits of quantification) were established based on a signal-to-noise ratio of 1:10 for both the qualifier and quantifier of matrix-matched standards.
Sample Preparation
This study used corn feed meal as the matrix, but other types of animal feed are also routinely analyzed using this method, for example, barley, rye and wheat. It can also be used in the analysis of oils, fats, hydrolysates and additives.
Sample preparation follows a validated protocol is based on a QuEChERS procedure. This process is outlined below.
- An animal feed sample was weighed into a 50 ml extraction tube at a range of quantities based on the matrix – between 2.5 g and 10 g.
- Buffer salts and 20 ml of water were added, except for wet samples. Here, a correction was completed to account for the moisture content already present.
- The mixture was vigorously shaken for 30 minutes to avoid clumping.
- IS solution was added based on sample weight, at volumes between 50 µl and 200 µl.
- A total of 10 ml of acetonitrile was added, the tube was shaken for 30 minutes, and it was then centrifuged for 5 minutes at 5000 rpm.
- The supernatant acetonitrile layer was relocated into a 15 ml centrifugal tube. This was then placed in the freezer for at least 2 hours.
- Additional centrifugation was performed - 2 minutes at 5000 rpm. Next, 5-6 ml of acetonitrile extract was transferred into a dispersive SPE tube.
- The dispersive SPE tube is then shaken for at least 2 minutes and centrifuged for a further 2 minutes at 5000 rpm.
- A 1 ml volume of clear supernatant was transferred into a vial before 10 µl of 5% formic acid (in acetonitrile) was added to ensure stabilization.
- Finally, between 50 µl and 200 µl of sample extract (depending on sample weight) was concentrated under a light stream of nitrogen and resuspended in 50 µl acetonitrile.
Results
Traditional manual input of MRM transitions for method development is both time-consuming and labor-intensive when used to analyze several compounds in a single run (Figure 1). It is also difficult to optimize the dwell time for each transition when using a conventional method.
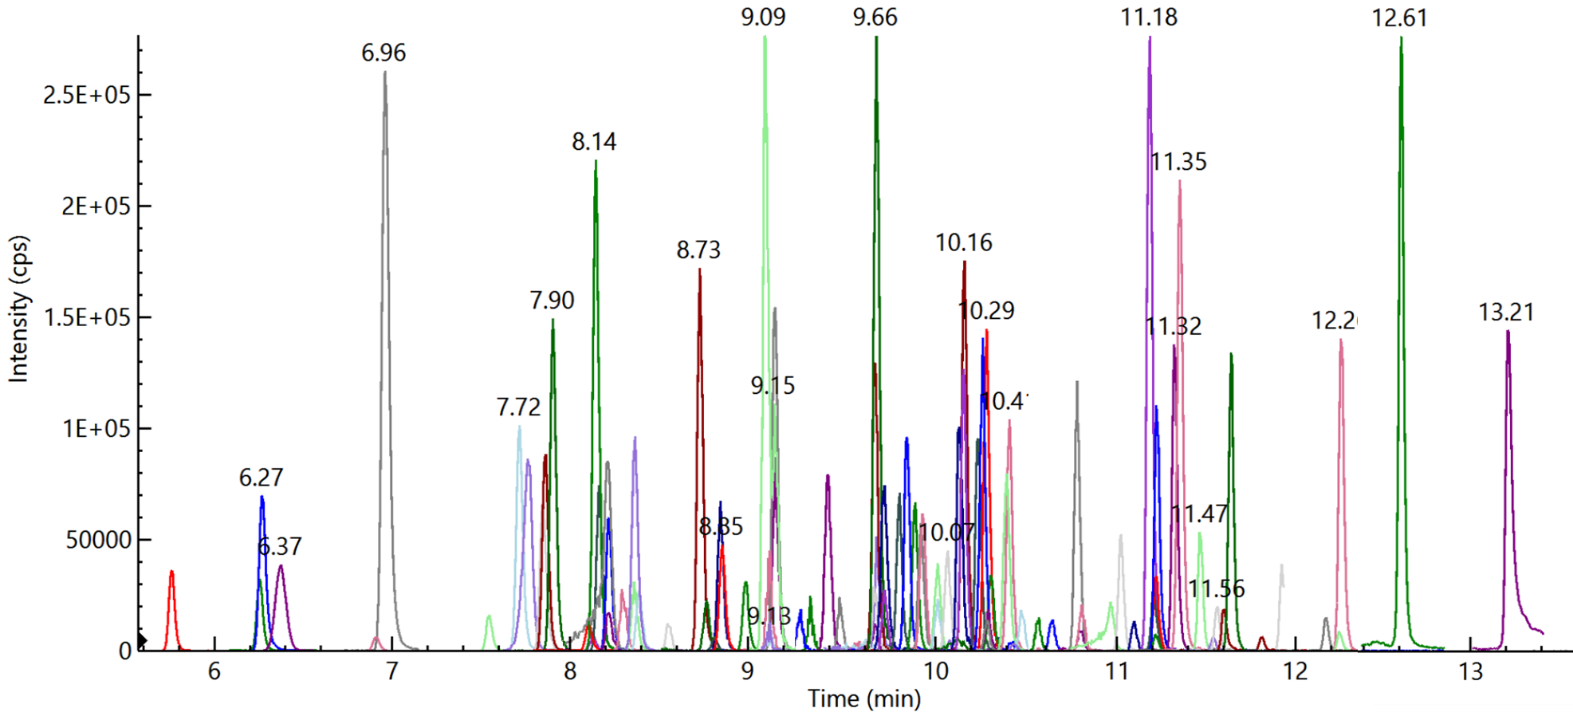
Figure 1. Overlay of 94 pesticides (Quantifier MRM) at 10 ng/ml spiked in feed cornmeal matrix. Image Credit: PerkinElmer Food Safety and Quality
This study opted to employ a time-managed MRM™ for method development to enhance efficiency, data quality and overall method performance.
The built-in algorithm optimized dwell times automatically, based on the input of chromatographic peak width and anticipated cycle time to yield between 12 and 15 data points per peak (Figure 2). This approach helped ensure reliable quantification and a good degree of reproducibility.
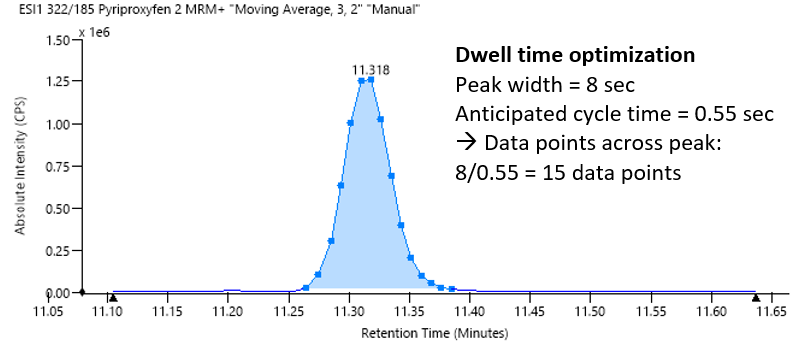
Figure 2. Automatic dwell time optimization based on chromatographic peak width and anticipated cycle time. Image Credit: PerkinElmer Food Safety and Quality
Sample matrix effects remain the primary challenge in LC/MS/MS method development, particularly when working with complex and diverse sample matrices.
In order to investigate these potential matrix effects, slopes (X) of calibration curves acquired from standards prepared in solvent (neat solution) were evaluated against slopes (Y) obtained from standards prepared in feed cornmeal sample matrix.
It is possible to calculate sample matrix effect via the percentage (%) difference between the slopes; for example, (Y-X) × 100/X. A positive percentage difference implies a signal enhancement effect, while a negative value implies a signal suppression effect.
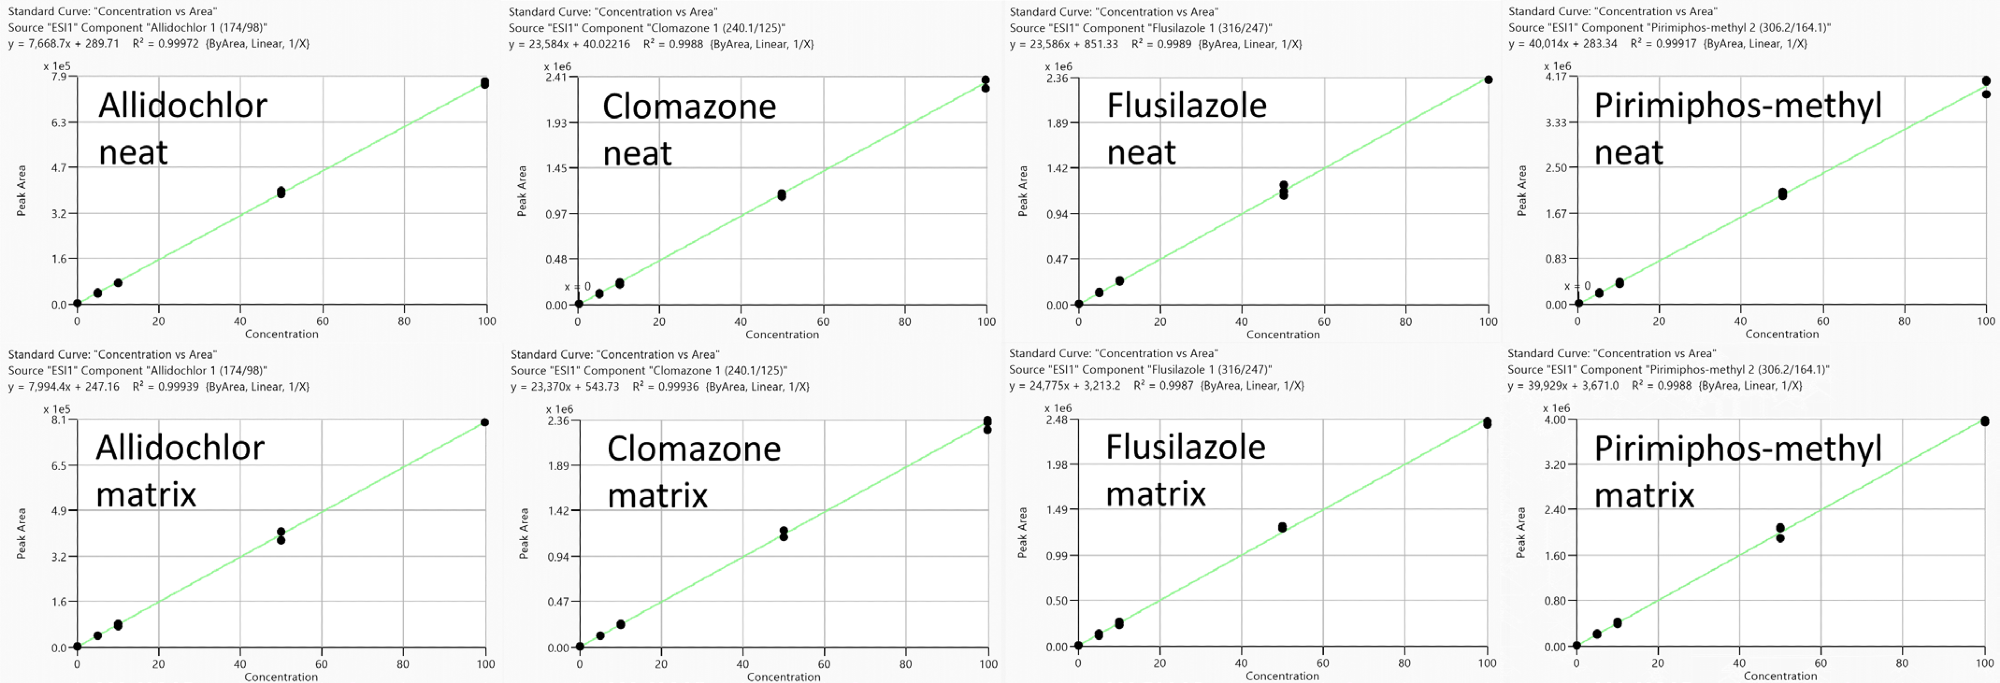
Figure 3. Representative calibration curves (measured in triplicate) to estimate matrix effects (no IS correction): Allidochlor, Flusilazole, Clomazone and Pirimiphos-methyl obtained from standards prepared in neat solutions (top) and feed cornmeal matrix (bottom) with analyte concentration range from 0.1 to 100 ng/ml. Image Credit: PerkinElmer Food Safety and Quality
This effect is compound dependent, however (Figure 3), with pesticides such as allidochlor and flusilazole, demonstrating signal enhancement (positive values), while pesticides such as clomazone and pirimiphos-methyl demonstrate ion suppression (negative values).
Sample matrix effects for the pesticides studied are largely below 10% (Figure 4, Table 4), meaning that calibration curves built from neat solutions could be employed in quantification without any major errors. This is in line with the 20% SANTE signal suppression or enhancement guideline value.
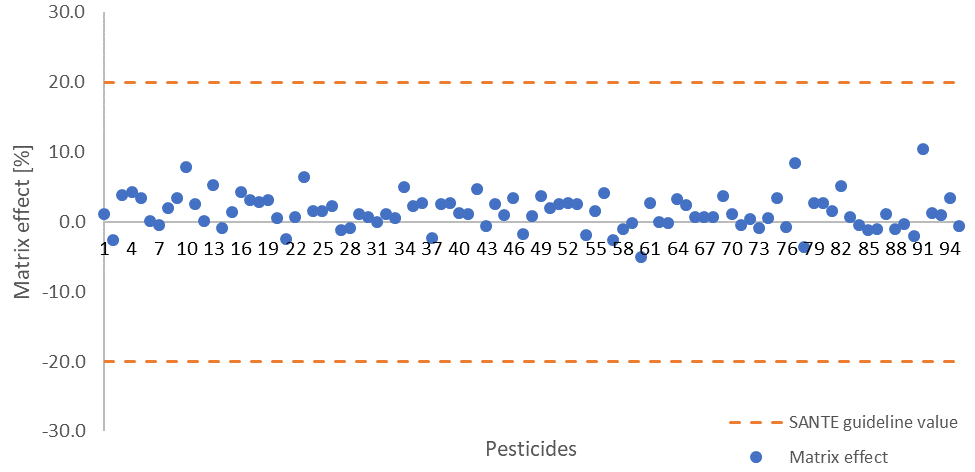
Figure 4. Calculated matrix effects for all measured pesticides, dashed lines indicate the 20% signal suppression or enhancement SANTE guideline value. Image Credit: PerkinElmer Food Safety and Quality
The complexity of different feed sample types commonly analyzed in the laboratory means that it can be challenging to address varying matrix effects while simultaneously ensuring that variations in analytical results are kept to a minimum.
To address this, the internal standard TPP was used for the quantification of all pesticides within this study. Figure 5 displays an example of the reprocessed calibration curves.
Table 4. Method performance parameters for all 94 measured pesticides. Source: PerkinElmer Food Safety and Quality
| Compound |
R2 Neat,
With IS |
Matrix Effect
[%] No IS |
LOQ
[μg/kg] |
Intra-day
Average RSDr |
Inter-day
RSDR |
2-4 Dimethyl-
phenylformamide |
0.9996 |
1.2 |
≤0.5 |
4.6 |
10.2 |
| Acetochlor |
0.9994 |
-2.7 |
≤5 |
10.3 |
12.6 |
| Alachlor |
0.9992 |
3.9 |
≤5 |
6.2 |
8.8 |
| Allidochlor |
0.9998 |
4.2 |
≤0.5 |
4.7 |
16.1 |
| Atrazine |
0.9997 |
3.3 |
≤0.5 |
5.1 |
10.8 |
Azinphos-
ethyl |
0.9998 |
0.1 |
≤1 |
7.5 |
13.9 |
Azinphos-
Methyl |
0.9998 |
-0.5 |
≤0.5 |
6.4 |
16.0 |
| Bromfenvinfos |
0.9988 |
1.9 |
≤0.5 |
2.2 |
10.9 |
| Bupirimate |
0.9994 |
3.4 |
≤0.5 |
7.8 |
14.3 |
| Carbophenothion |
0.9993 |
7.9 |
≤0.5 |
7.5 |
7.3 |
| Chlorfenvinphos |
0.9995 |
2.5 |
≤0.5 |
3.5 |
10.8 |
Chlorpyriphos-
methyl |
0.9996 |
0.2 |
≤0.5 |
5.1 |
6.4 |
| Chlorthiophos |
0.9993 |
5.3 |
≤0.5 |
5.4 |
6.8 |
| Clomazone |
0.9997 |
-0.9 |
≤0.5 |
4.9 |
18.2 |
| Coumaphos |
0.9998 |
1.3 |
≤0.5 |
3.1 |
13.7 |
| Cycloate |
0.9995 |
4.2 |
≤0.5 |
4.8 |
10.4 |
| Cyprodinil |
0.9992 |
3.1 |
≤1 |
6.0 |
8.9 |
| Di-Allate |
0.9991 |
2.8 |
≤1 |
5.4 |
8.9 |
| Diazinon |
0.9997 |
3.1 |
≤0.5 |
2.5 |
11.1 |
| Dimethachlor |
0.9995 |
0.5 |
≤0.5 |
5.2 |
16.8 |
| Diphenamid |
0.9986 |
-2.4 |
≤0.5 |
5.6 |
15.3 |
| Disulfoton |
0.9990 |
0.7 |
≤1 |
7.8 |
18.4 |
| Edifenphos |
0.9997 |
6.4 |
≤5 |
12.1 |
19.6 |
| EPN |
0.9999 |
1.6 |
≤0.5 |
4.4 |
8.0 |
| Ethion |
0.9992 |
1.6 |
≤0.5 |
3.7 |
5.7 |
| Etofenprox |
0.9994 |
2.3 |
≤0.5 |
4.4 |
8.2 |
| Etridiazole |
0.9996 |
-1.3 |
≤1 |
7.0 |
7.6 |
| Fenamiphos |
0.9993 |
-0.9 |
≤0.5 |
4.0 |
6.3 |
| Fenthion |
0.9990 |
1.0 |
≤0.5 |
5.0 |
9.0 |
| Fipronil |
0.9996 |
0.7 |
≤0.5 |
8.6 |
14.1 |
| Fludioxonil |
0.9996 |
-0.1 |
≤0.5 |
5.5 |
19.2 |
| Fluquinconazole |
0.9993 |
1.1 |
≤0.5 |
7.1 |
11.6 |
| Fluridone |
0.9996 |
0.5 |
≤0.5 |
4.9 |
17.9 |
| Flusilazole |
0.9991 |
5.0 |
≤0.5 |
6.1 |
6.0 |
| Flutolanil |
0.9992 |
2.2 |
≤0.5 |
5.3 |
15.5 |
| Flutriafol |
0.9985 |
2.7 |
≤0.5 |
3.8 |
12.6 |
| Folpet |
0.9979 |
-2.4 |
≤1 |
9.9 |
13.1 |
| Fonofos |
0.9982 |
2.5 |
≤1 |
3.7 |
8.3 |
| Hexazinone |
0.9986 |
2.7 |
≤0.5 |
5.7 |
7.9 |
| Iprodione |
0.9990 |
1.3 |
≤0.5 |
5.6 |
17.3 |
| Isazophos |
0.9975 |
1.1 |
≤0.5 |
5.7 |
10.5 |
| Lenacil |
0.9979 |
4.7 |
≤0.5 |
4.6 |
11.9 |
| Leptophos |
0.9900 |
-0.7 |
≤2 |
5.4 |
14.8 |
| Linuron |
0.9993 |
2.5 |
≤0.5 |
5.5 |
18.3 |
| Malathion |
0.9980 |
1.0 |
≤0.5 |
5.6 |
12.9 |
| Metazachlor |
0.9989 |
3.4 |
≤0.5 |
3.6 |
13.1 |
| Methacrifos |
0.9995 |
-1.8 |
≤0.5 |
6.2 |
10.1 |
| Methoxychlor |
0.9978 |
0.8 |
≤0.5 |
4.8 |
6.8 |
| Metolachlor |
0.9992 |
3.7 |
≤0.5 |
4.1 |
5.5 |
| Mevinphos |
0.9988 |
2.0 |
≤0.5 |
4.5 |
4.4 |
| Myclobutanyl |
0.9985 |
2.5 |
≤0.5 |
5.6 |
10.9 |
| Norflurazon |
0.9979 |
2.7 |
≤0.5 |
4.1 |
12.2 |
| Oxadiazon |
0.9972 |
2.6 |
≤0.5 |
4.5 |
7.1 |
| Paclobutrazol |
0.9994 |
-1.9 |
≤0.5 |
4.8 |
10.6 |
| Parathion |
0.9987 |
1.6 |
≤1 |
5.4 |
8.9 |
| Pebulate |
0.9994 |
4.1 |
≤0.5 |
3.5 |
6.9 |
| Phorate |
0.9989 |
-2.6 |
≤0.5 |
4.6 |
12.2 |
| Phosalone |
0.9982 |
-1.1 |
≤2 |
5.5 |
8.0 |
| Phosmet |
0.9986 |
-0.2 |
≤0.5 |
2.3 |
12.5 |
Piperonyl-
butoxide |
0.9983 |
-5.0 |
≤0.5 |
4.5 |
22.0 |
Pirimiphos-
ethyl |
0.9980 |
2.6 |
≤0.5 |
3.6 |
5.5 |
Pirimiphos-
methyl |
0.9999 |
0.0 |
≤0.5 |
4.1 |
5.6 |
| Pretilachlor |
0.9988 |
-0.2 |
≤0.5 |
2.8 |
10.7 |
| Prochloraz |
0.9987 |
3.2 |
≤1 |
4.0 |
6.7 |
| Profenofos |
0.9992 |
2.4 |
≤0.5 |
3.4 |
13.7 |
| Propachlor |
0.9984 |
0.6 |
≤0.5 |
4.1 |
6.8 |
| Propanil |
0.9981 |
0.7 |
≤1 |
3.9 |
13.0 |
| Propargite |
0.9988 |
0.7 |
≤0.5 |
5.7 |
18.7 |
| Propisochlor |
0.9991 |
3.7 |
≤0.5 |
5.3 |
5.2 |
| Propyzamide |
0.9995 |
1.1 |
≤5 |
7.7 |
11.8 |
| Prothiofos |
0.9983 |
-0.4 |
≤0.5 |
5.8 |
11.6 |
| Pyraclofos |
0.9995 |
0.3 |
≤0.5 |
4.4 |
7.0 |
| Pyrazophos |
0.9974 |
-0.9 |
≤0.5 |
3.5 |
14.2 |
| Pyridaben |
0.9981 |
0.5 |
≤0.5 |
2.9 |
11.3 |
| Pyridaphenthion |
0.9986 |
3.4 |
≤0.5 |
4.1 |
6.0 |
| Pyriproxyfen |
0.9988 |
-0.7 |
≤0.5 |
5.6 |
11.1 |
| Pyrmethanil |
0.9975 |
8.4 |
≤0.5 |
5.0 |
6.8 |
| Quinalphos |
0.9981 |
-3.7 |
≤0.5 |
6.1 |
16.8 |
| Sulfotep |
0.9990 |
2.6 |
≤0.5 |
5.8 |
10.9 |
| Sulprofos |
0.9990 |
2.7 |
≤0.5 |
4.1 |
6.6 |
| Tebuconazole |
0.9989 |
1.5 |
≤0.5 |
5.3 |
5.3 |
| Tebufenpyrad |
0.9995 |
5.1 |
≤1 |
6.1 |
14.2 |
| Terbacil |
0.9989 |
0.7 |
≤0.5 |
5.4 |
9.6 |
| Terbufos |
0.9981 |
-0.5 |
≤0.5 |
4.4 |
8.9 |
| Terbuthylazine |
0.9990 |
-1.2 |
≤1 |
9.9 |
14.9 |
| Tetrachlorvinphos |
0.9988 |
-1.1 |
≤0.5 |
5.4 |
11.7 |
Tolclophos-
methyl |
0.9992 |
1.1 |
≤0.5 |
4.0 |
8.3 |
| Triadimefon |
0.9980 |
-1.1 |
≤2 |
5.8 |
13.7 |
| Triadimenol |
0.9988 |
-0.4 |
≤0.5 |
6.8 |
10.3 |
| Tri-Allate |
0.9981 |
-2.1 |
≤1 |
9.6 |
14.8 |
| Triazophos |
0.9988 |
10.4 |
≤0.5 |
6.6 |
6.6 |
| Tricyclazole |
0.9986 |
1.2 |
≤0.5 |
5.5 |
11.1 |
| Triflumizole |
0.9990 |
1.0 |
≤0.5 |
4.5 |
13.5 |
| Vinclozolin |
0.9987 |
3.4 |
≤0.5 |
4.5 |
9.5 |
Method Performance
The information below details a range of method performance parameters, including correlation coefficient, LOQs, matrix effect, intra-day repeatability and inter-day reproducibility.
SANTE/12682/2019 Method Performance
Identification criteria in SANTE/12682/2019 dictate that when conducting pesticide analysis in the EU, the retention time and ion ratio from at least two MRM transitions per compound must be within acceptable tolerance limits.
Two MRM transitions were, therefore, monitored for each individual pesticide studied - one for the qualifier ion and one for the quantifier ion.
These product ion ratios were monitored to confirm that they fell within the required 30% tolerance windows for the comparison of standards in neat solution versus pesticides in the studied matrix.
To evaluate retention times, the difference between compounds in a neat solution was compared against those of pesticides in the studied matrix. These all fell within the limit of 0.1 minutes. The guidance document states that repeatability and reproducibility values must be ≤20%.
Linearity of Calibration Curves (0.1 to 100 ng/ml)
Calibration accuracy was assessed in a neat solution. This was achieved using a linear regression model with a weighting factor or 1/x and TPP IS correction.
A good degree of linearity was observed in the range of 0.1 to 100 ng/ml. Correlation coefficients (R2) were found to be larger than 0.99 for representative compounds (Figure 5).
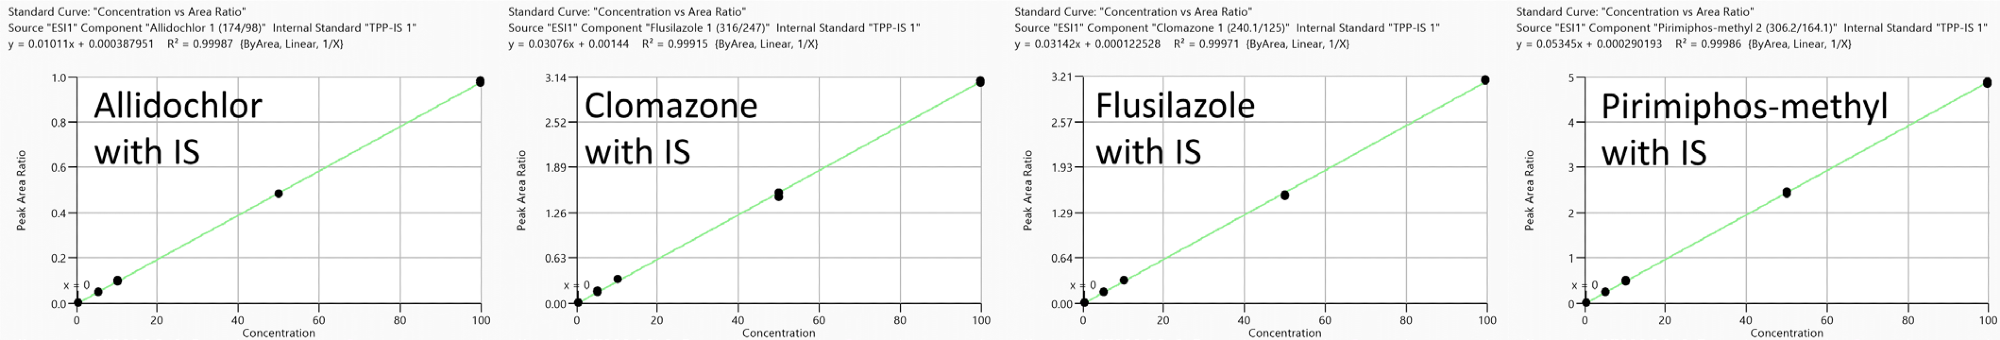
Figure 5. Representative calibration curves (measured in triplicate) in neat solution reprocessed with TPP as IS: Allidochlor, Flusilazole, Clomazone and Pirimiphos-methyl with analyte concentration range from 0.1 to 100 ng/ml. Image Credit: PerkinElmer Food Safety and Quality
Limit of Quantification Based on MRLs
LOQs were calculated by studying the signal of both qualifier and quantifier (S/N > 10 for both) of matrix-matched standards. Overall values fell between 0.01 µg/kg and 3.84 µg/kg, with 88 of the 94 (94%) investigated pesticides demonstrating a LOQ ≤1 µg/kg – confidently below the EU MRL of 10 µg/kg.
Repeatability and Reproducibility
The repeatability and reproducibility of the fortified sample matrix were assessed on 4 different days. This was done by spiking a total of 52 samples at 25 µg/kg in feed cornmeal.
Relative standard deviation values were calculated for both - intra-day repeatability (RSDr) and inter-day reproducibility (RSDR) with values falling below 20% in both cases, in line with SANTE guidelines. These are shown in Figure 6 and Figure 7, respectively.
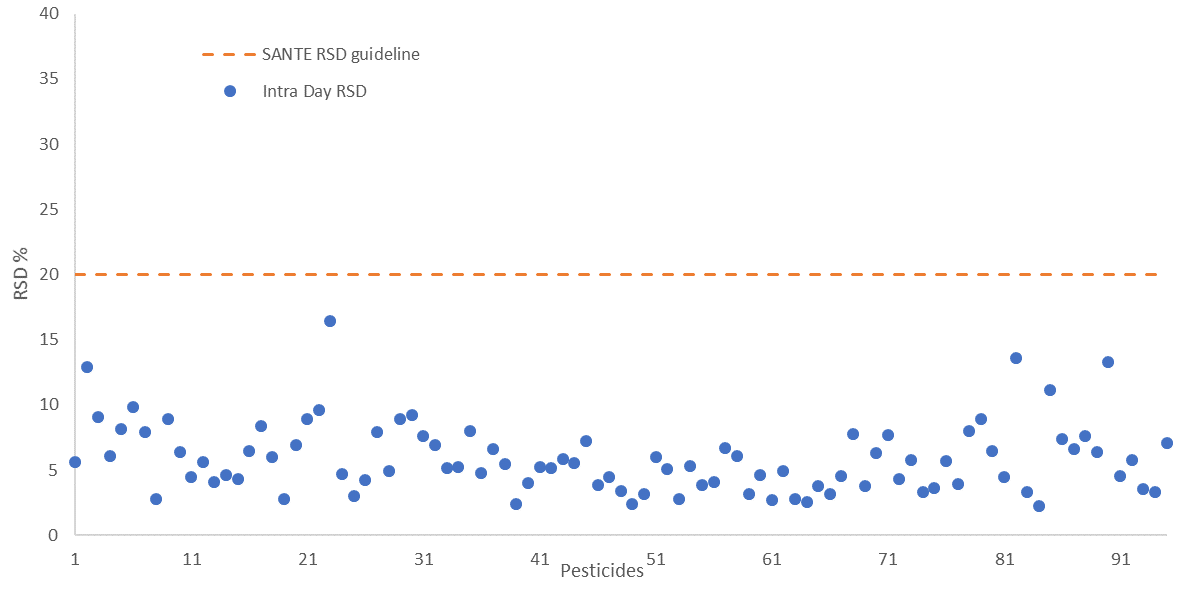
Figure 6. Intra-day repeatability RSDr (n=30) values for all 94 pesticides spiked at 25 μg/kg in feed cornmeal matrix, dashed line indicates the SANTE maximum guideline value. Image Credit: PerkinElmer Food Safety and Quality
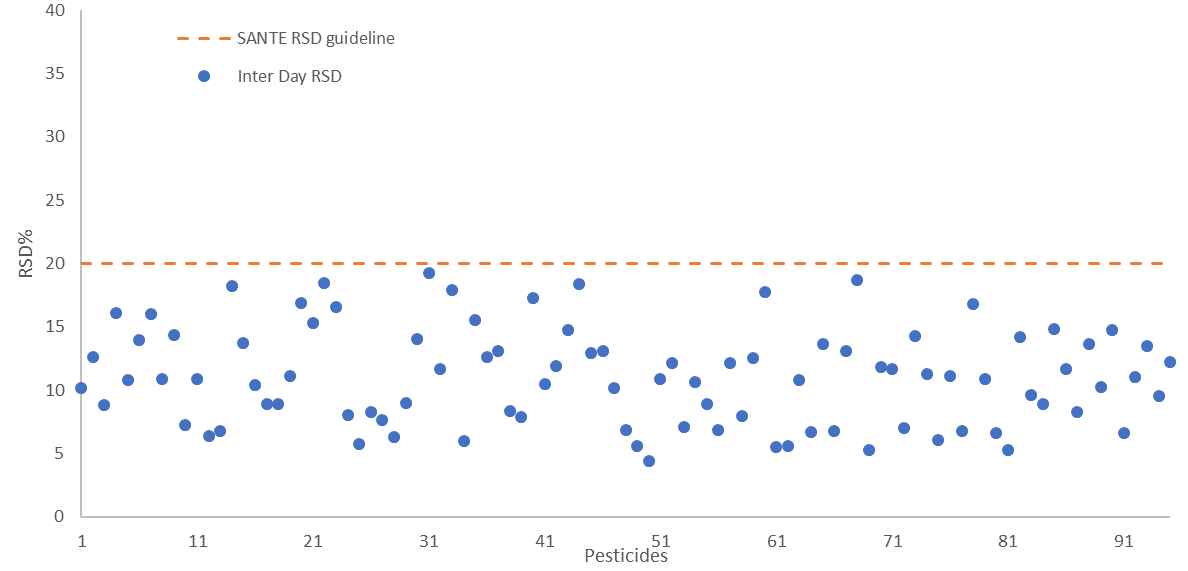
Figure 7. Inter-day reproducibility RSDR (n=52) presented for all 94 pesticides spiked at 25 μg/kg in feed cornmeal matrix, dashed line indicates the SANTE maximum guideline value. Image Credit: PerkinElmer Food Safety and Quality
Standard Measurements
Animal feed samples were tested using the method outlined above, but the majority of the investigated pesticides were undetected or present at values below the LOD/LOQ. Ion ratios and retention time deviations were also found to be within the anticipated tolerance range.
Pyridaben, malathion and pirimiphos-methyl were positively quantified in certain samples, and these were compared to a matrix-matched standard (Figure 8).
Analyses were in line with SANTE performance criteria in terms of retention time deviations, and these were confidently within the limit of 0.1 minutes and 30% tolerance windows of the anticipated ion ratio values.
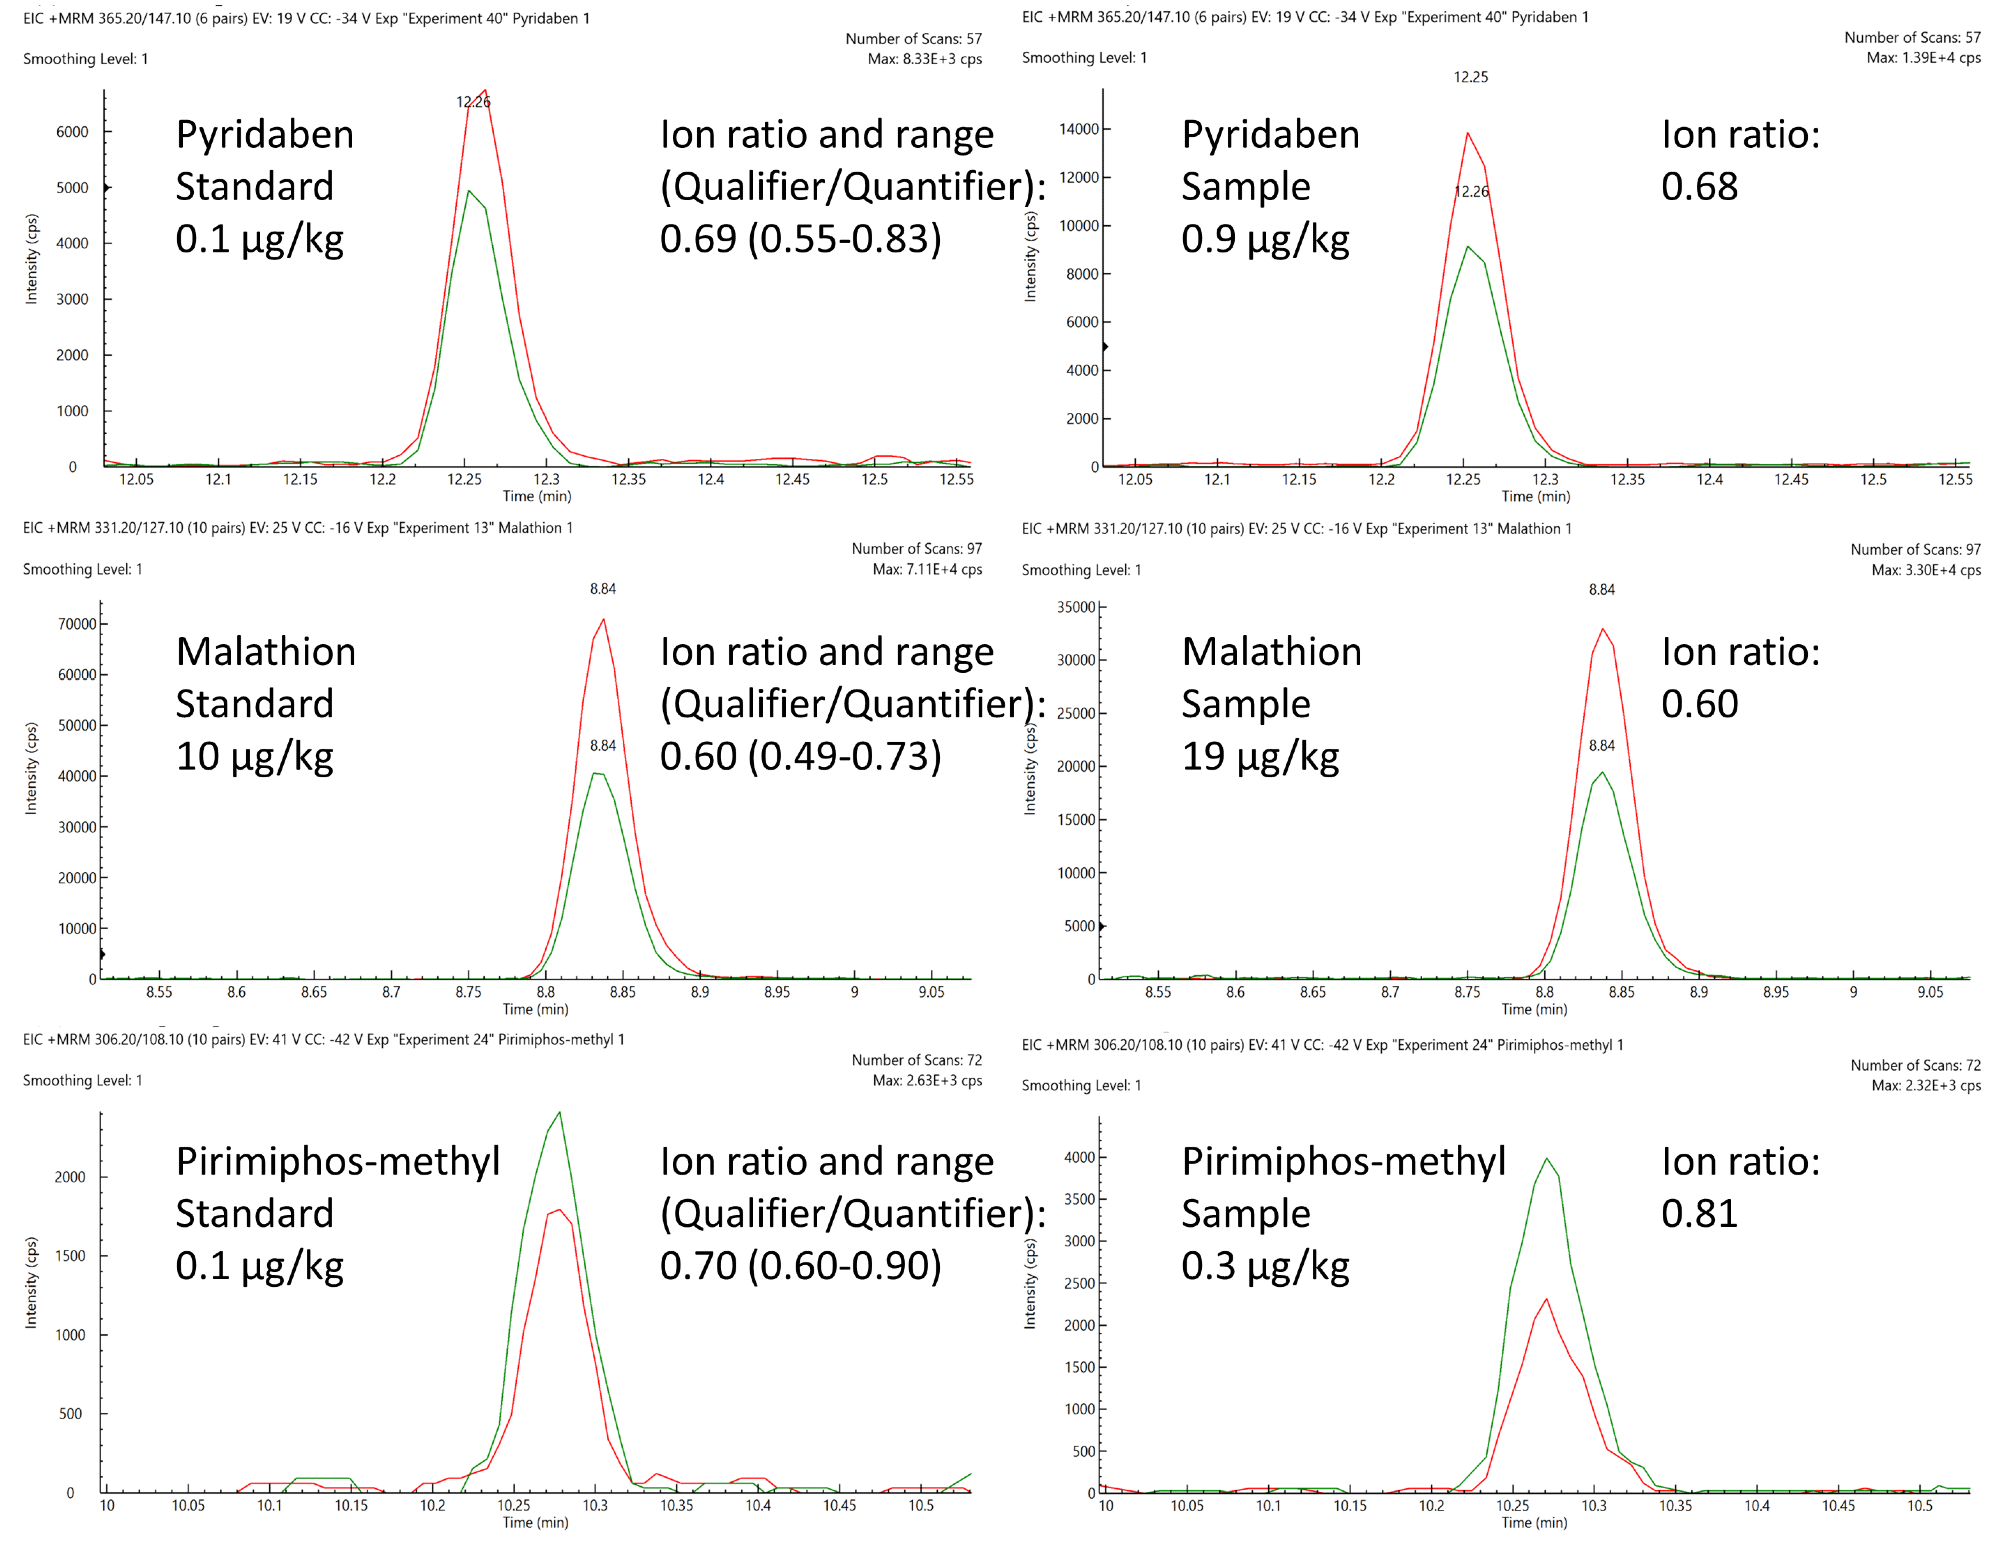
Figure 8. Comparison of expected ion area ratios (Qualifier/Quantifier) from matrix-matched standards and positively quantified pesticides in animal feed samples. Image Credit: PerkinElmer Food Safety and Quality
Conclusion
The method outlined in this article leveraged the robust analysis capabilities of the QSight 220 LC/MS/MS to facilitate the identification and quantification of almost 100 pesticides.
Analysis was performed at levels comfortably below the maximum residue limits set by the European Commission, making this instrument an ideal option for laboratories looking to comply with strict regulations in challenging matrixes.
The dual source technology of the QSight 220 was central to the confirmation and quantification of pesticides in animal feed, which were measured in both positive and negative polarity modes.
There was no need to manually input of MS parameters due to the use of a compound library with optimized parameters and automated time-managed MRM algorithms.
These features enabled optimal method development and dwell time calculation, ultimately facilitating rapid acquisition with no compromise in data quality.
References
- EURL Cereals and Feeding Stuff. Pesticide residues in animal feeding stuff https://www.eurl-pesticides.eu/docs/public/tmplt_ article.asp?CntID=754&LabID=400&Lang=EN.
- European Commission. Regulation EC No 396/2005 on Maximum Residue Levels of Pesticides in or on Food and Feed of Plant and Animal Origin. 2006, 1881 (February 1998), 1 – 5.
- European Commission. Method Validation Procedures for Pesticide Residues Analysis in Food and Feed; SANTE/12682/2019.
- Anastassiades, M.; Lehotay, S. J.; Štajnbaher, D.; Schenck, F. J. Fast and Easy Multiresidue Method Employing Acetonitrile Extraction/ Partitioning and “Dispersive Solid-Phase Extraction” for the Determination of Pesticide Residues in Produce. Journal of AOAC INTERNATIONAL 2003, 86 (2), 412–431. https://doi.org/10.1093/jaoac/86.2.412.
- Stachniuk, A. LC-MS/MS Determination of Pesticide Residues in Fruits and Vegetables. In Bioactive Molecules in Food; Mérillon, J.-M., Ramawat, K. G., Eds.; Reference Series in Phytochemistry; Springer International Publishing: Cham, 2019; pp 2137–2161. https://doi.org/10.1007/978-3-319-78030-6_82.
- Mol, H. G. J.; Zomer, P.; García López, M.; Fussell, R. J.; Scholten, J.; de Kok, A.; Wolheim, A.; Anastassiades, M.; Lozano, A.; Fernandez Alba, A. Identification in Residue Analysis Based on Liquid Chromatography with Tandem Mass Spectrometry: Experimental Evidence to Update Performance Criteria. Analytica Chimica Acta 2015, 873, 1–13. https://doi.org/10.1016/j.aca.2015.03.007.
Acknowledgments
Produced from materials originally authored by Yanniek Lagarde, Nick de Louw, and Henk Lamers from NutriControl BV; and Aristide Ganci and Ignazio Garaguso and PerkinElmer, Inc.

This information has been sourced, reviewed and adapted from materials provided by PerkinElmer Food Safety and Quality.
For more information on this source, please visit PerkinElmer Food Safety and Quality.