Veterinary drugs are utilized in animal production in a variety of ways, including treating disease, preventing infection and protecting animals’ growth. This assists the food sector in bringing quality foodstuffs to the market while still making a profit.
The inappropriate utilization of drugs in the animal production sector may result in residue violations in foodstuffs. It may also result in health risks due to the possible diseases in humans and animals developing a resistance to antibiotics.
At a global level, regulatory agencies have established what is referred to as maximum residue levels (MRLs) or tolerances of veterinary drugs in foods. The European Union (EU), China, Canada and other countries set “maximum residue levels of drug residues in foods.” The US refers to them as “tolerances.”1,2,3,4,5
Residues of veterinary drugs are currently monitored around the world by a variety of private contracts and government laboratories to impose regulations at a domestic level, but also in the international food trade.
A frequent objective in drug analysis is to obtain acceptable results for a number of analytes utilizing a cost-efficient method in just one run.
It can be a challenge to establish such a method for veterinary drugs in animal tissues. This is due to the complexity of sample matrices, as well as the diversity of analytes from a variety of classes of chemical properties.
Previously, veterinary drug methods were developed to analyze a specific analyte or groups of analytes that were closely related. Instruments were less selective and required a large number of sample clean-up steps. Numerous single class methods were also required to monitor all of the targeted drugs.6
Due to recent advancements in highly sensitive and selective mass detection techniques and ultra-high-performance separation, single-class methods have been progressively supplanted by multi-class, multi-residue methods (MMMs).7,8,9,10,11,12,13,14,15,16,17,18,19
This article outlines the development of a method for analyzing over 70 drugs in chicken by means of UHPLC/MS/MS.
QuEChERS has long been the extraction method of choice for analyzing multi-residue veterinary drugs in food samples.7,8,15 The majority of recent studies utilized simple solvent extractions, such as a mixture of acetonitrile and water (4:1 in v/v).9,10,11,12,13,14
This was followed by various sample clean-up steps aimed at reducing sample matrix effects (for example fat, lipids and proteins):
- Protein precipitation at a low temperature16
- Using hexane as a defatting agent17
- Sample clean-up utilizing dispersive solid phase extraction (d-SPE) with C18 or another sorbent8,9,10,11,12,13
- Employing cartridge SPE with HLB18
Appropriate sample clean-up procedures can enhance method performance and decrease the need for instrument maintenance. This will lead to the need for greater labor input, longer analysis times and more expense to carry out the analysis, however.
Due to the nature of the multi-class analytes (comprising diverse chemical properties) in the samples, sample clean-up steps could result in low recoveries for some analytes.8,9,10,11,12,13,14
To achieve the necessary detection limits with less sensitive instrumentation in the previous studies, it was also necessary to evaporate the concentrated analytes and solvents prior to LC/MS/MS analysis.7,8,9,10,11,12
This article covers the development of a quick, sensitive and selective method for analyzing 73 veterinary drugs - encompassing 13 different chemical classes - in chicken samples by coupling a solvent extraction method with LC/MS/MS.
It was observed that superior recoveries were achieved for all the analytes without sample clean-up when compared with different sample clean-up methods.
The high sensitivity of the QSight mass spectrometer and its unique StayClean™ technology (hot-surface induced desolvation - HSID™) and Laminar Flow Ion Guide™ allows for the direct analysis of 20 sample extracts without the need for time-consuming solvent evaporation and analyte concentration steps.
Experimental
Hardware and Software
The chromatographic separation of veterinary drugs was performed by a PerkinElmer UHPLC system. The analyte determination was accomplished utilizing a PerkinElmer QSight™ 220 triple quadrupole mass detector with a dual ionization source.
The mass detector is capable of fast polarity switching, allowing the positive and negative ionization modes to be used. The instrument control, data acquisition and data processing functions were carried out by means of the Simplicity 3Q™ software system.
Method
Solvents, Standards and Sample Preparation
The solvents and standards used were sourced as follows:
- The LC/MS grade methanol (MeOH), formic acid, water and acetonitrile (ACN) were obtained from Thermo Fisher Scientific
- Hydroxy dimetridazole, desethylene ciprofloxacin HCl and pirlimycin HCl (veterinary drugs) were sourced from Toronto Research Chemicals (Toronto, ON, Canada)
- The haloxon was obtained from Cedarlane Labs (Burlington, ON, Canada)
- The remaining internal standards, veterinary drugs and reagents were bought from Sigma-Aldrich (Oakville, ON, Canada)
- The samples of chicken were sourced from local grocery stores in Waterloo (ON, Canada)
- The AOAC 2007.01 clean-up kit (MgSO4 1200 mg, PSA 400 mg and C18 400 mg) for d-SPE clean up adsorbent tubes was obtained from PerkinElmer
- Part number N9306911 end-capped C18 d-SPE (500 mg C18) was acquired from UCT (Bristol, PA, USA)
- The Z-Sep+ (500 mg in 12 mL) tube was sourced from Sigma-Aldrich (Oakville, ON, Canada)
The stock solution for each veterinary drug standard and deuterated internal standard were prepared individually by precisely weighing 5 mg of each individual standard and dissolving it in 5ml of either water, MeOH, ACN or dimethyl sulfoxide (depending on the solubility of each compound).
The internal standard (IS) mix solution comprising three internal standards (13C6-sulfamethazine, flunixin-d3 and acepromazine-d3) each at 10 μg/ml, was produced by means of the appropriate dilution of IS stock solutions in ACN.
A composite solution containing β-lactams/cephalosporins was produced in water at a concentration of 200X, where X represents the MRLs. Every other analyte was mixed in a composite solution and then diluted to 100X using ACN.
The composite and stock solutions were stored at −20 °C. The spiking solutions were produced and utilized within a week of preparation in the validation experiments.
The calibration standards were produced by the dilution of the spiking solutions daily during validation and analysis. Each standard solution was stored in an amber glass vial and closed with fitted PTFE (except for the β-lactams /cephalosporins solutions, which were instead stored in plastic vials).
The chicken samples were homogenized and then ground with dry ice to obtain a uniformed powder. They were stored at -20 °C overnight to allow for the sublimation of the residual dry ice and subsequently stored at -20 °C until the analysis was carried out.
The certified organic chicken samples were utilized as a blank matrix for method validation.
A sample totaling 2 g was weighed into a centrifuge tube. It was spiked with internal standards and fortified with targeted analytes. The sample was then extracted with 10 ml of extraction solution (acetonitrile:water: 4:1 in v/v).
After the centrifugation process, the extract was analyzed by LC/MS/MS directly or after clean-up procedures. This was carried out by dispersive solid phase extraction (d-SPE) with various sorbents.
The extract was then transferred to the clean-up tubes. After agitating the extract (for 2 minutes) and centrifugation (5 minutes at 4 °C), the top clear extract solution was subjected to analysis without filtration.
LC Method and MS Source Conditions
The LC method and MS source parameters can be seen in Table 1.
Table 1. LC Method and MS source conditions. Source: PerkinElmer Food Safety and Quality
| LC Conditions |
| LC Column |
Brownlee, SPP Phenyl-Hexyl, 100 x 2.1 mm, 2.7 μm (Cat#N9308485) |
| Mobile Phase A |
0.1% formic acid in water |
| Mobile Phase B |
0.1% formic acid and 10 % methanol in acetonitrile |
| Mobile Phase Gradient (Flow Rate: 0.4 mL/min) |
Start at 3% mobile phase B and hold it for one min, then increase B to 100% in 11 min and keep at 100% B for two mins. Finally equilibrate the column at initial condition for three min. |
| Column Oven Temperature |
40 ºC |
| Auto Sampler Temperature |
4 ºC |
| Injection Volume |
3.0 μL |
| MS Source Conditions |
| ESI Voltage (Positive) |
5000 V |
| ESI Voltage (Negative) |
-4000V |
| Drying Gas |
120 |
| Nebulizer Gas |
200 |
| Source Temperature |
400 ºC |
| HSID Temperature |
320 ºC |
| Detection Mode |
Time-managed MRM™ |
The multiple reaction monitoring mode (MRM) transitions of the veterinary drugs tested as part of the study can be seen in Table 2 (shown in order of retention time).
Table 2. MRM Transitions. Source: PerkinElmer Food Safety and Quality
| Compound Name |
Polarity |
Precursor Ion |
Product Ion |
CE |
EV |
CCL2 |
| Florfenicol amine |
Positive |
248.1 |
230.1 |
-17 |
16 |
-50 |
| Florfenicol amine-2 |
Positive |
248.1 |
130.2 |
-29 |
16 |
-50 |
| Hydroxy-dimetridazole |
Positive |
158 |
140.1 |
-17 |
10 |
-56 |
| Hydroxy-dimetridazole-2 |
Positive |
158 |
112 |
-25 |
10 |
-88 |
| 5-Hydroxy-thiabendazole |
Positive |
217.7 |
191.1 |
-33 |
46 |
-36 |
| 5-Hydroxy-thiabendazole-2 |
Positive |
217.7 |
147.1 |
-43 |
46 |
-36 |
| Levamisole |
Positive |
205 |
178 |
-27 |
31 |
-30 |
| Levamisole-2 |
Positive |
205 |
91 |
-49 |
31 |
-42 |
| Lincomycin |
Positive |
407.2 |
126.2 |
-36 |
18 |
-56 |
| Lincomycin-2 |
Positive |
407.2 |
359.1 |
-24 |
18 |
-52 |
| ALBZ 2-aminosulfone |
Positive |
240 |
133.2 |
-38 |
25 |
-63 |
| ALBZ 2-aminosulfone-2 |
Positive |
240 |
198 |
-27 |
25 |
-53 |
| Sulfathiazole |
Positive |
256.2 |
156 |
-19 |
10 |
-34 |
| Sulfathiazole-2 |
Positive |
256.2 |
108.2 |
-36 |
10 |
-50 |
| Desethylene ciprofloxacin |
Positive |
306.1 |
288 |
-25 |
10 |
-90 |
| Desethylene ciprofloxacin-2 |
Positive |
306.1 |
268 |
-35 |
10 |
-90 |
| Oxytetracycline |
Positive |
461.1 |
426 |
-24 |
10 |
-100 |
| Oxytetracycline-2 |
Positive |
461.1 |
201 |
-50 |
10 |
-128 |
| Sulfamerazine |
Positive |
265.2 |
108.2 |
-38 |
28 |
-53 |
| Sulfamerazine-2 |
Positive |
265.2 |
172.1 |
-22 |
28 |
-37 |
| Tetracycline |
Positive |
445.4 |
154 |
-35 |
19 |
-96 |
| Tetracycline-2 |
Positive |
445.4 |
410 |
-23 |
19 |
-44 |
| Enrofloxacin |
Positive |
360.4 |
316.1 |
-27 |
38 |
-52 |
| Enrofloxacin-2 |
Positive |
360.4 |
245.1 |
-35 |
38 |
-47 |
| Sulfamethizole |
Positive |
271.2 |
156 |
-19 |
30 |
-102 |
| Sulfamethizole-2 |
Positive |
271.2 |
92.1 |
-41 |
30 |
-69 |
| Orbifloxacin |
Positive |
396.2 |
295.3 |
-32 |
10 |
-75 |
| Orbifloxacin-2 |
Positive |
396.2 |
352.1 |
-25 |
10 |
-40 |
| Sulfamethazine |
Positive |
279.2 |
186 |
-23 |
10 |
-42 |
| Sulfamethazine-2 |
Positive |
279.2 |
124.1 |
-36 |
10 |
-44 |
| Sulfamethazine-C13 |
Positive |
285 |
124.1 |
-32 |
25 |
-100 |
| Sulfamethazine-C13-2 |
Positive |
285 |
186.2 |
-23 |
26 |
-100 |
| Sulfamethoxypyridazine |
Positive |
281.2 |
92.2 |
-47 |
10 |
-68 |
| Sulfamethoxypyridazine-2 |
Positive |
281.2 |
108.2 |
-35 |
10 |
-72 |
| ALBZ sulfoxide |
Positive |
282.3 |
240.1 |
-19 |
22 |
-89 |
| ALBZ sulfoxide-2 |
Positive |
282.3 |
208.2 |
-31 |
22 |
-89 |
| Sarafloxacin |
Positive |
386.1 |
342.2 |
-26 |
36 |
-76 |
| Sarafloxacin-2 |
Positive |
386.1 |
299.1 |
-38 |
36 |
-98 |
| Xylazine |
Positive |
221 |
164 |
-35 |
25 |
-46 |
| Xylazine-2 |
Positive |
221 |
90 |
-29 |
25 |
-44 |
| Hydroxy-ipronidazole |
Positive |
186 |
168 |
-16 |
26 |
-24 |
| Hydroxy-ipronidazole-2 |
Positive |
186 |
121.2 |
-36 |
26 |
-20 |
| Clenbuterol |
Positive |
276.8 |
203.2 |
-20 |
11 |
-144 |
| Clenbuterol-2 |
Positive |
276.8 |
132.2 |
-45 |
11 |
-61 |
| Difloxacin |
Positive |
400.2 |
356.2 |
-26 |
36 |
-60 |
| Difloxacin-2 |
Positive |
400.2 |
299.2 |
-38 |
36 |
-92 |
| Morantel |
Positive |
221 |
123.1 |
-46 |
28 |
-74 |
| Morantel-2 |
Positive |
221 |
150.1 |
-38 |
28 |
-68 |
| Morantel-3 |
Positive |
221 |
111 |
-46 |
28 |
-74 |
| 6-Phenyl-2-thiouracil |
Positive |
205 |
188 |
-23 |
30 |
-36 |
| 6-Phenyl-2-thiouracil-2 |
Positive |
205 |
146.1 |
-25 |
30 |
-42 |
| Pirlimycin |
Positive |
411.1 |
112.2 |
-35 |
28 |
-92 |
| Pirlimycin-2 |
Positive |
411.1 |
363.1 |
-23 |
28 |
-36 |
| 2-Amino-flubendazole |
Positive |
256.1 |
123.1 |
-35 |
48 |
-60 |
| 2-Amino-flubendazole-2 |
Positive |
256.1 |
133.2 |
-50 |
48 |
-88 |
| Sulfachloropyridazine |
Positive |
285.2 |
156.1 |
-21 |
25 |
-95 |
| Sulfachloropyridazine-2 |
Positive |
285.2 |
92 |
-45 |
25 |
-62 |
| Clindamycin |
Positive |
425.4 |
126.2 |
-38 |
12 |
-80 |
| Clindamycin-2 |
Positive |
425.4 |
377.1 |
-30 |
12 |
-40 |
| Sulfamethoxazole |
Positive |
254.1 |
92.1 |
-38 |
30 |
-60 |
| Sulfamethoxazole-2 |
Positive |
254.1 |
108.3 |
-39 |
30 |
-70 |
| Carazolol |
Positive |
299.3 |
116.2 |
-25 |
31 |
-72 |
| Carazolol-2 |
Positive |
299.3 |
222.2 |
-25 |
31 |
-37 |
| Doxycycline |
Positive |
445.5 |
428 |
-24 |
16 |
-68 |
| Doxycycline-2 |
Positive |
445.5 |
267 |
-47 |
16 |
-112 |
| Sulfadoxine |
Positive |
311.2 |
92.2 |
-49 |
21 |
-60 |
| Sulfadoxine-2 |
Positive |
311.2 |
108.2 |
-37 |
21 |
-60 |
| Sulfaethoxypyridazine |
Positive |
295.2 |
156 |
-25 |
25 |
-50 |
| Sulfaethoxypyridazine-2 |
Positive |
295.2 |
92.1 |
-47 |
25 |
-66 |
| ALBZ sulfone |
Positive |
297.9 |
159.1 |
-50 |
35 |
-70 |
| ALBZ sulfone-2 |
Positive |
297.9 |
266.2 |
-27 |
35 |
-39 |
| Oxfendazole |
Positive |
315.9 |
191 |
-29 |
36 |
-90 |
| Oxfendazole-2 |
Positive |
315.9 |
284.1 |
-25 |
36 |
-33 |
| Tilmicosin |
Positive |
435.4 |
174 |
-31 |
35 |
-94 |
| Tilmicosin-2 |
Positive |
435.4 |
99.1 |
-30 |
35 |
-54 |
| Tilmicosin-3 |
Positive |
435.4 |
696 |
-23 |
35 |
-94 |
| Ipronidazole |
Positive |
170 |
109.1 |
-33 |
25 |
-55 |
| Ipronidazole-2 |
Positive |
170 |
123.1 |
-33 |
25 |
-55 |
| Sulfaquinoxaline |
Positive |
301.3 |
155.9 |
-22 |
30 |
-48 |
| Sulfaquinoxaline-2 |
Positive |
301.3 |
108.1 |
-38 |
30 |
-48 |
| Sulfadimethoxine |
Positive |
311.3 |
156 |
-27 |
28 |
-76 |
| Sulfadimethoxine-2 |
Positive |
311.3 |
92 |
-48 |
28 |
-64 |
| Prednisone |
Positive |
359.1 |
147.1 |
-40 |
12 |
-62 |
| Prednisone-2 |
Positive |
359.1 |
171.1 |
-45 |
12 |
-68 |
| Fenbendazole sulfone |
Positive |
332.2 |
300.1 |
-29 |
35 |
-54 |
| Fenbendazole sulfone-2 |
Positive |
332.2 |
159.1 |
-52 |
35 |
-94 |
| Haloperidol |
Positive |
376.1 |
165.2 |
-32 |
25 |
-68 |
| Haloperidol-2 |
Positive |
376.1 |
123.1 |
-50 |
25 |
-86 |
| Acetopromazine |
Positive |
327.1 |
86.1 |
-25 |
30 |
-65 |
| Acetopromazine-2 |
Positive |
327.1 |
222.2 |
-50 |
30 |
-115 |
| Acetopromazine-3 |
Positive |
327.1 |
254 |
-35 |
30 |
-115 |
| Acepromazine-dimethyl-d6 |
Positive |
333 |
92.2 |
-27 |
20 |
-70 |
| Promethazine |
Positive |
285 |
86.1 |
-17 |
25 |
-94 |
| Promethazine-2 |
Positive |
285 |
198 |
-33 |
25 |
-94 |
| Albendazole (ALBZ) |
Positive |
266 |
234.1 |
-26 |
33 |
-45 |
| Albendazole (ALBZ)-2 |
Positive |
266 |
191 |
-44 |
33 |
-75 |
| Mebendazole |
Positive |
296.5 |
264.3 |
-29 |
30 |
-110 |
| Mebendazole-2 |
Positive |
296.5 |
105.1 |
-52 |
30 |
-106 |
| Flubendazole |
Positive |
314 |
282.1 |
-30 |
15 |
-44 |
| Flubendazole-2 |
Positive |
314 |
123.1 |
-49 |
15 |
-94 |
| Betamethasone |
Positive |
393.3 |
373.3 |
-12 |
15 |
-48 |
| Betamethasone-2 |
Positive |
393.3 |
355.2 |
-18 |
15 |
-58 |
| Propionylpromazine |
Positive |
341.1 |
86.2 |
-25 |
25 |
-52 |
| Propionylpromazine-2 |
Positive |
341.1 |
236.2 |
-50 |
25 |
-102 |
| Chlorpromazine |
Positive |
319 |
86.1 |
-26 |
25 |
-60 |
| Chlorpromazine-2 |
Positive |
319 |
246.1 |
-31 |
25 |
-135 |
| Oxacillin |
Positive |
402.3 |
160 |
-27 |
19 |
-78 |
| Oxacillin-2 |
Positive |
402.3 |
243.2 |
-20 |
19 |
-108 |
| Nitroxynil |
Negative |
288.8 |
126.7 |
32 |
-24 |
70 |
| Nitroxynil-2 |
Negative |
288.8 |
162 |
25 |
-24 |
60 |
| Fenbendazole |
Positive |
299.9 |
268.2 |
-28 |
34 |
-64 |
| Fenbendazole-2 |
Positive |
299.9 |
159.1 |
-47 |
34 |
-86 |
| Triflupromazine |
Positive |
353 |
86.2 |
-27 |
10 |
-52 |
| Triflupromazine-2 |
Positive |
353 |
248.1 |
-55 |
10 |
-122 |
| Virginiamycin |
Positive |
526.2 |
355.2 |
-23 |
21 |
-78 |
| Virginiamycin-2 |
Positive |
526.2 |
337.1 |
-29 |
21 |
-76 |
| Cloxacillin |
Positive |
437.3 |
278.1 |
-19 |
17 |
-116 |
| Cloxacillin-2 |
Positive |
437.3 |
160.1 |
-25 |
17 |
-76 |
| Ketoprofen |
Positive |
255 |
177.1 |
-26 |
25 |
-104 |
| Ketoprofen-2 |
Positive |
255 |
194.1 |
-33 |
25 |
-104 |
| Oxyphenylbutazone |
Positive |
325.1 |
204.1 |
-22 |
12 |
-48 |
| Oxyphenylbutazone-2 |
Positive |
325.1 |
120.1 |
-29 |
12 |
-44 |
| Nafcillin |
Positive |
415.1 |
199.1 |
-26 |
25 |
-54 |
| Nafcillin-2 |
Positive |
415.1 |
171.1 |
-49 |
25 |
-78 |
| Dicloxacillin |
Positive |
470.3 |
160 |
-28 |
17 |
-72 |
| Dicloxacillin-3 |
Positive |
470.3 |
311.1 |
-20 |
17 |
-126 |
| Flunixin |
Positive |
297 |
279.2 |
-29 |
30 |
-50 |
| Flunixin-2 |
Positive |
297 |
236.2 |
-55 |
30 |
-150 |
| Flunixin-d3 |
Positive |
300 |
282 |
-29 |
35 |
-35 |
| Haloxon |
Positive |
415.2 |
211.1 |
-46 |
42 |
-98 |
| Haloxon-2 |
Positive |
415.2 |
353 |
-29 |
42 |
-64 |
| Triclabendazole Sulfoxide |
Positive |
375 |
360 |
-30 |
25 |
-72 |
| Triclabendazole Sulfoxide-2 |
Positive |
375 |
313 |
-35 |
25 |
-156 |
| Diclofenac |
Positive |
296 |
215 |
-25 |
28 |
-122 |
| Diclofenac-2 |
Positive |
296 |
250 |
-15 |
28 |
-134 |
| Phenylbutazone |
Positive |
309.1 |
120.1 |
-25 |
10 |
-42 |
| Phenylbutazone-2 |
Positive |
309.1 |
188.1 |
-20 |
10 |
-40 |
| Emamectin |
Positive |
886.5 |
158.2 |
-48 |
30 |
-140 |
| Emamectin-2 |
Positive |
886.5 |
302.1 |
-40 |
30 |
-144 |
| Triclabendazole |
Positive |
359 |
344 |
-34 |
25 |
-92 |
| Triclabendazole-2 |
Positive |
359 |
274 |
-48 |
25 |
-96 |
| Oxyclozanide |
Negative |
399.8 |
363.8 |
24 |
-10 |
90 |
| Oxyclozanide-2 |
Negative |
399.8 |
201.8 |
35 |
-10 |
70 |
| Niclosamide |
Negative |
324.9 |
170.8 |
31 |
-25 |
60 |
| Niclosamide-2 |
Negative |
324.9 |
288.9 |
24 |
-25 |
60 |
| Melengestrol acetate |
Positive |
397.4 |
337.3 |
-18 |
25 |
-54 |
| Melengestrol acetate-2 |
Positive |
397.4 |
279.2 |
-26 |
25 |
-62 |
| Tolfenamic acid |
Positive |
262 |
244 |
-22 |
12 |
-44 |
| Tolfenamic acid-2 |
Positive |
262 |
209.1 |
-37 |
12 |
-70 |
| Bithionol |
Negative |
354.9 |
160.8 |
27 |
-10 |
60 |
| Bithionol-2 |
Negative |
354.9 |
162.8 |
33 |
-10 |
60 |
| Closantel |
Negative |
661.1 |
315 |
41 |
-30 |
160 |
| Closantel-2 |
Negative |
661.1 |
344.9 |
47 |
-30 |
160 |
A minimum of two MRM transitions were monitored for every single analyte to lower the number of false positives and negatives in the method.21
The optimization of the MS/MS parameters, incorporating, for example, the choice of parent ions, product ions, entrance voltages (EV), collision energies (CE) and voltages on the flat lens prior to collision cell (CCL2), was carried out by the infusion of standards and utilization of the software.
The source conditions were optimized by means of the flow injection (FIA) method.
Using the optimized conditions, the acquisition MS method is generated automatically.
This is done by selecting the veterinary drugs of interest from the built-in compound library in the time-managed MRM module of the Simplicity software, including the positive and negative MRM transitions of the targeted analytes.
Results and Discussion
Selection of Drug Analytes and Target Levels in Chicken Tissue Samples
The study focused on 73 veterinary drugs from 13 important classes with a range of physical and chemical properties.
The reference target levels in the study were the maximum residue levels (MRLs) established for veterinary drugs in foods by Health Canada or the tolerances established by United States Food and Drug Administration (X in Table 3). The detection threshold - the ‘yes/no’ screening level - should be at or below 0.5X.
Table 3. Results of retention time, matrix effect (ME), linearity, recovery, and reproducibility (%RSD)*. Source: PerkinElmer Food Safety and Quality
| Compound Name |
Drug Class |
X Level (ng/g) |
RT (min) |
ME (%) |
Linearity (R2) |
Recovery (%) (Non d-SPE) |
Recovery (%) (d-SPE) |
| Florfenicol amine |
Phenicols |
100 |
1.34 |
-3.4 |
0.9999 |
88 (16)* |
92 (18) |
| Hydroxy-dimetridazole |
Coccidiostats |
50 |
3.58 |
31.0 |
0.9993 |
90 (10) |
103 (11) |
| 5-Hydroxy-thiabendazole |
Anthelmintics |
100 |
3.89 |
-59.9 |
0.9947 |
111 (13) |
92 (17) |
| Lincomycin |
Macrolides/lincosamides |
100 |
4.19 |
-5.6 |
0.9969 |
85 (11) |
102 (7) |
| ALBZ 2-aminosulfone |
Anthelmintics |
100 |
4.28 |
2.7 |
0.9998 |
108 (8) |
87 (11) |
| Levamisole |
Anthelmintics |
100 |
4.34 |
1.3 |
0.9989 |
89 (10) |
87 (6) |
| Desethylene ciprofloxacin |
Fluoroquinolones |
100 |
4.51 |
-25.7 |
0.9988 |
113 (13) |
4 (18) |
| Sulfathiazole |
Sulfonamides |
100 |
4.55 |
-23.8 |
0.9997 |
104 (6) |
95 (9) |
| Sulfamerazine |
Sulfonamides |
100 |
4.82 |
-27.8 |
0.9999 |
110 (4) |
98 (8) |
| Oxytetracycline |
Tetracyclines |
200 |
4.82 |
-14.5 |
0.9994 |
99 (12) |
11 (15) |
| ALBZ sulfoxide |
Anthelmintics |
50 |
4.99 |
-1.7 |
0.9995 |
71 (4) |
69 (9) |
| Hydroxy-ipronidazole |
Coccidiostats |
10 |
5.00 |
16.6 |
0.9955 |
107 (5) |
107 (7) |
| Tetracycline |
Tetracyclines |
200 |
5.05 |
13.0 |
0.9963 |
85 (2) |
11 (17) |
| Enrofloxacin |
Fluoroquinolones |
20 |
5.13 |
-25.5 |
0.9997 |
78 (11) |
40 (14) |
| Xylazine |
Tranquilizers |
10 |
5.14 |
-13.6 |
0.9987 |
121 (9) |
92 (11) |
| Sulfamethazine |
Sulfonamides |
100 |
5.16 |
-16.6 |
0.9990 |
103 (10) |
89 (8) |
| Sulfamethizole |
Sulfonamides |
100 |
5.18 |
-6.6 |
0.9973 |
115 (7) |
87 (5) |
| Clenbuterol |
β-Agonists |
10 |
5.19 |
4.7 |
0.9994 |
80 (12) |
72 (10) |
| Orbifloxacin |
Fluoroquinolones |
50 |
5.24 |
-18.1 |
0.9933 |
111 (14) |
44 (9) |
| Sulfamethoxypyridazine |
Sulfonamides |
100 |
5.27 |
8.0 |
0.9988 |
120 (2) |
103 (3) |
| Sarafloxacin |
Fluoroquinolones |
50 |
5.40 |
-12.1 |
0.9977 |
117 (4) |
45 (6) |
| Pirlimycin |
Macrolides/lincosamides |
300 |
5.41 |
-18.2 |
0.9994 |
102 (9) |
88 (7) |
| 6-Phenyl-2-thiouracil |
Thyreostats |
400 |
5.41 |
-12.1 |
0.9999 |
117 (4) |
93 (10) |
| Morantel |
Anthelmintics |
150 |
5.42 |
-13.1 |
1.0000 |
112 (11) |
89 (5) |
| Difloxacin |
Fluoroquinolones |
50 |
5.48 |
-15.2 |
0.9998 |
106 (8) |
90 (12) |
| 2-Amino-flubendazole |
Anthelmintics |
10 |
5.59 |
2.2 |
0.9977 |
106 (3) |
89 (6) |
| Clindamycin |
Macrolides/lincosamides |
100 |
5.60 |
1.7 |
0.9997 |
99 (8) |
87 (11) |
| Sulfachloropyridazine |
Sulfonamides |
100 |
5.76 |
-2.3 |
0.9992 |
109 (7) |
103 (3) |
| ALBZ sulfone |
Anthelmintics |
50 |
5.78 |
-15.3 |
0.9999 |
100 (12) |
98 (8) |
| Oxfendazole |
Anthelmintics |
800 |
5.78 |
-21.7 |
0.9997 |
95 (14) |
83 (9) |
| Carazolol |
Tranquilizers |
10 |
5.83 |
-16.1 |
0.9975 |
117 (7) |
122 (13) |
| Doxycycline |
Tetracyclines |
100 |
5.85 |
-6.1 |
0.9931 |
114 (11) |
26 (15) |
| Sulfamethoxazole |
Sulfonamides |
100 |
5.86 |
-7.4 |
0.9998 |
110 (2) |
92 (4) |
| Sulfadoxine |
Sulfonamides |
100 |
5.87 |
-4.3 |
1.0000 |
92 (6) |
101 (4) |
| Tilmicosin |
Macrolides/lincosamides |
100 |
5.89 |
-17.7 |
0.9991 |
119 (1) |
95 (10) |
| Sulfaethoxypyridazine |
Sulfonamides |
100 |
5.94 |
-9.5 |
0.9999 |
104 (5) |
87 (7) |
| Ipronidazole |
Coccidiostats |
10 |
5.96 |
-5.0 |
0.9965 |
115 (13) |
101 (8) |
| Sulfadimethoxine |
Sulfonamides |
100 |
6.41 |
-0.6 |
0.9989 |
94 (4) |
89 (10) |
| Prednisone |
Anti-inflammatories |
100 |
6.46 |
-5.4 |
0.9979 |
105 (3) |
66 (9) |
| Sulfaquinoxaline |
Sulfonamides |
100 |
6.48 |
-1.7 |
0.9997 |
111 (6) |
100 (10) |
| Albendazole (ALBZ) |
Anthelmintics |
50 |
6.53 |
-5.8 |
1.0000 |
100 (3) |
93 (7) |
| Mebendazole |
Anthelmintics |
10 |
6.59 |
-11.5 |
0.9997 |
117 (2) |
77 (5) |
| Fenbendazole sulfone |
Anthelmintics |
400 |
6.62 |
-2.6 |
1.0000 |
104 (6) |
92 (11) |
| Acetopromazine |
Tranquilizers |
10 |
6.64 |
-9.4 |
0.9999 |
118 (2) |
88 (9) |
| Promethazine |
Tranquilizers |
10 |
6.68 |
-6.8 |
0.9890 |
95 (10) |
33 (8) |
| Haloperidol |
Tranquilizers |
10 |
6.72 |
-4.8 |
0.9993 |
109 (5) |
98 (13) |
| Flubendazole |
Anthelmintics |
10 |
6.85 |
-10.6 |
0.9989 |
106 (4) |
103 (11) |
| Betamethasone |
Anti-inflammatories |
100 |
6.89 |
4.5 |
0.9982 |
110 (7) |
126 (2) |
| Propionylpromazine |
Tranquilizers |
10 |
7.10 |
-27.8 |
0.9994 |
121 (5) |
85 (8) |
| Chlorpromazine |
Tranquilizers |
10 |
7.31 |
8.6 |
0.9993 |
92 (3) |
68 (7) |
| Fenbendazole |
Anthelmintics |
100 |
7.40 |
-13.6 |
0.9999 |
104 (7) |
87 (5) |
| Oxacillin |
β-Lactams/cephalosporins |
100 |
7.43 |
0.3 |
0.9998 |
87 (6) |
89 (11) |
| Triflupromazine |
Tranquilizers |
10 |
7.53 |
3.8 |
0.9993 |
116 (4) |
74 (11) |
| Flunixin |
Anti-inflammatories |
20 |
7.54 |
-3.7 |
0.9997 |
114 (3) |
90 (10) |
| Virginiamycin |
Miscellaneous |
100 |
7.59 |
9.1 |
0.9903 |
109 (8) |
118 (3) |
| Nitroxynil |
Anthelmintics |
50 |
7.72 |
-10.2 |
0.9990 |
84 (10) |
71 (7) |
| Ketoprofen |
Anti-inflammatories |
10 |
7.75 |
-9.0 |
0.9964 |
105 (13) |
119 (9) |
| Nafcillin |
β-Lactams/cephalosporins |
100 |
7.88 |
22.6 |
0.9998 |
104 (7) |
85 (4) |
| Cloxacillin |
β-Lactams/cephalosporins |
100 |
7.89 |
4.6 |
0.9999 |
103 (2) |
96 (12) |
| Oxyphenylbutazone |
Anti-inflammatories |
100 |
7.89 |
17.3 |
0.9990 |
115 (5) |
103 (8) |
| Dicloxacillin |
β-Lactams/cephalosporins |
100 |
8.23 |
-31.9 |
0.9992 |
88 (7) |
79 (6) |
| Triclabendazole Sulfoxide |
Anthelmintics |
50 |
8.63 |
6.1 |
0.9989 |
96 (4) |
88 (10) |
| Haloxon |
Anthelmintics |
100 |
8.75 |
-21.8 |
0.9998 |
82 (3) |
79 (10) |
| Emamectin |
Anthelmintics |
10 |
8.77 |
-15.1 |
0.9998 |
105 (12) |
76 (19) |
| Diclofenac |
Anti-inflammatories |
200 |
8.77 |
-18.5 |
0.9998 |
89 (9) |
80 (5) |
| Phenylbutazone |
Anti-inflammatories |
100 |
9.10 |
9.7 |
0.9999 |
117 (3) |
90 (5) |
| Triclabendazole |
Anthelmintics |
50 |
9.24 |
-17.9 |
0.9988 |
103 (5) |
80 (14) |
| Melengestrol acetate |
Miscellaneous |
25 |
9.25 |
-20.0 |
0.9990 |
103 (4) |
87 (7) |
| Oxyclozanide |
Anthelmintics |
10 |
9.30 |
3.1 |
0.9997 |
111 (6) |
78 (11) |
| Tolfenamic acid |
Anti-inflammatories |
200 |
9.42 |
-12.6 |
0.9991 |
88 (9) |
67 (10) |
| Niclosamide |
Anthelmintics |
10 |
9.43 |
-4.8 |
0.9991 |
107 (2) |
85 (9) |
| Bithionol |
Anthelmintics |
10 |
9.90 |
-5.0 |
0.9973 |
87 (4) |
59 (8) |
| Closantel |
Anthelmintics |
50 |
11.68 |
-11.0 |
0.9995 |
93 (6) |
86 (5) |
UHPLC/MS/MS Method Optimization
Different columns and mobile phase conditions were evaluated to obtain superior sensitivity and separation for the compounds being targeted. It was noted that three columns can be employed for the separation of the compounds with retention time profiles that differed marginally.
Those columns were:
- The PerkinElmer Brownlee SPP Phenyl-Hexyl (2.7 µm, 2.1 x 100 mm)
- The Restek Raptor Biphenyl (2.7 µm, 2.1 x 100 mm)
- The Waters Acquity UPLC HSS T3 (1.8 µm, 2.1 x 100 mm)
It was similarly noted that 10% methanol in acetonitrile as organic mobile phase gave the total best performance in terms of retention, analyte peak shape, and mass signal intensity.
The mass signal intensity displayed an improvement for the late-eluting compounds when 10% methanol was present in the organic mobile phase.
An advanced time-managed-MRM acquisition method is capable of intelligently utilizing the retention time of a chromatographic peak and automatically optimizing the residence time of the MRM to obtain quantitative data of the highest quality.
As a result, a time-managed MRM was applied for method development in this study to improve method efficiency, the quality of the data and enhance method performance. The QSight mass spectrometer’s fast polarity switching ability allowed for high-sensitivity detection for both positive and negative ions in just one analytical run.
Sample Matrix Effects
Sample matrix effects (MEs) are the key concern for LC/MS/MS method development. This is especially the case in food analysis because of the complexity and diversity of food sample matrices.
For example, ESI is especially susceptible to the ionization suppression of analytes where charge-competing matrix components are present.22 In addition, matrix-induced enhancement effects are also known to occur in ESI. This can also introduce a significant bias in quantification.
To resolve the effects of sample MEs, a range of approaches have been utilized, for example, the use of stable isotope internal standards, sample dilution, matrix-matched (MM) calibration, sample clean-up, use of high efficiency columns for improved separation, standard addition and the use of alternative ionization sources.22,23
Applying stable, isotopically labeled internal standard (IS) in the method for every analyte would be extremely beneficial in terms of compensating for MEs. This, however, is not practical for a number of analytes due to matters of expense, accessibility and convenience. As a result, MM calibration is generally used in practice to reduce MEs.
The sample MEs in this study were assessed by comparing the slopes of calibration curves obtained from a chicken sample matrix to the slopes obtained from a reagent-only (RO) matrix.
The sample ME value in terms of a percentage for each analyte was determined by the percentage difference between the slopes. Where the percentage difference was positive, there was a signal enhancement effect. A negative value indicated a signal suppression effect.
The MEs for approximately 83% of the studied analytes were less than 20% (Figure 1 and Table 3).
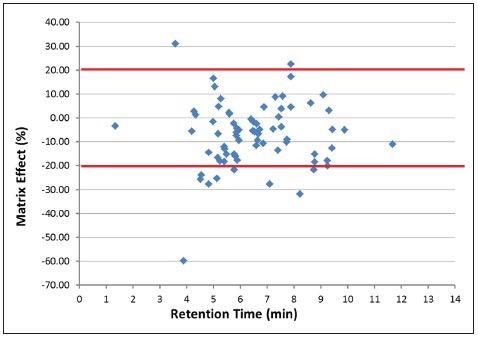
Figure 1. Sample matrix effects of chicken samples on the drug analytes vs. retention time. Image Credit: PerkinElmer Food Safety and Quality
Noteworthy MEs were observed for the remaining 17% of the analytes that were studied. Some displayed enhancements, such as hydroxyl-dimetridazole and nafcillin, but the majority displayed suppression effects at retention times between 3 and 10 minutes when nearly all of the analytes were eluted from column to detector.
This may be due to MEs, resulting not just from matrix–analyte competitive interactions but also from the numerous co-eluting analytes in the mixture.22
To counteract matrix effects and reduce variations in the analytical results, matrix-matched calibrations were utilized in this study to quantify every analyte.
Sample Preparation and Recovery
The time and steps involved in the preparation of samples have been an ever-present issue in any analytical procedure employed to determine chemical residues in food products.
In every multi-class, multi-residue method (MMM), there has always been a trade-off between reduced matrix effects caused by cleaning up samples and the loss of several analytes (low recoveries) during clean-up.
The greater the number of clean-up steps used, the greater the time and cost involved and the higher the number of potential analytes lost during the process. Fewer or no sample clean-up will result in more sample matrix effects and higher maintenance needs in terms of time and cost.
Lehotay’s group from the United States Department of Agriculture (USDA) have published countless papers on MMMs for veterinary drugs in animal foods.9,10,11,12,13,14
The group’s research on bovine kidneys involved the testing and comparison of six MMMs available from the literature. It was discovered that each method performed comparably, though some methods worked better than others for some drug classes. No method was ideal for every drug class evaluated, however.9
Experiments on the incurred samples revealed that the following method gave a quick, straightforward and effective sample preparation method: a 5 minute shake of 2 g of homogenized kidney with 10 ml of 4/1 (v/v) acetonitrile/water, followed by simultaneous clean-up of the extract with 0.5 g C18 and 10 ml hexane.
The study also evaluated different sorbents for dispersive solid phase extraction (d-SPE) clean-up, including:
- Aminopropyl
- Polymeric sorbent ENV+
- Carbon black
It was observed that though the sorbents investigated resulted in a better clean-up for matrix components, they also caused the removal of a greater number of the analytes in the samples when compared to C18.
Other research on the ruggedness of a practical method for more than 100 drugs in bovine muscle,11 involved the testing of the then-new d-SPE sorbents Z-Sep and Z-Sep+, in conjunction with C18 and end-capped C18.
Nine different clean-up conditions with differing combinations of different d-SPE and/or partitioning with hexane were studied.
While utilizing Z-Sep+ and Z-Sep+ hexane may provide an effective means of removing matrix components, they also considerably reduce the recoveries for many of the drugs studied.
The most suitable compromise in terms of balancing matrix effects and analyte recoveries was achieved utilizing end-capped C18+hexane.
In recent studies,12-14 the group did not use hexane for clean-up because phenylbutazone, oxyphenylbutazone and other drugs that are less hydrophilic partially partitioned into the hexane. This resulted in low and variable recoveries.
The group recently tested what has become known as “enhanced matrix removal for lipids” (EMR-L). EMR-L is a new product intended to selectively remove proteins and lipids from fatty food samples (for example, animal-derived foods).13
The results indicated that the EMR-L method offered cleaner extracts and yielded improved results for some less polar compounds, including tranquilizers and anthelmintics in comparison to the C18 d-SPE method.
The EMR-L method demonstrated much lower recoveries for β-lactam antibiotics and some polar drugs, however.
It should be noted that the EMR-L method involves extra steps when compared to C18 d-SPE. In the case of tetracyclines, low recoveries were obtained by the C18 d-SPE and EMR-L sample preparation methods.
Utilizing stable isotope labeled IS for tetracyclines was recommended to compensate for the losses in sample preparation.8,12 In practical terms, the C18 d-SPE method was quicker, simpler and more cost-efficient than the EMR-L method.
Even in instances where the end-capped C18 d-SPE clean-up was employed, approximately 75% of the drugs studied showed recoveries within 70-120%. A number of less polar drugs remained partially retainable on the C18 sorbent during d-SPE in the aqueous ACN extract, which leads to lower recoveries.12-14
Not every polar matrix component and interference could be removed by any clean-up method studied up to this point.
This means that for MMMs the most suitable method to reduce matrix effects and minimize maintenance needs involves the dilution of the final sample extracts or the injection of a small volume of samples on the column. 11,12,14,22,23 This may also improve chromatography for the early eluting polar analytes.
The recent growth in the commercial availability of modern highly sensitive mass spectrometers with fast polarity switching means this approach is now a viable option for the analysis of over 100 veterinary drugs without sample clean-up.14
The new LC/MS/MS systems’ enhanced sensitivity aids in the elimination of time-consuming steps (solvent evaporation, concentration and reconstitution) that were required to attain the detection limits of previous MMMs that utilized instruments that were less sensitive.7-11
While it is normal practice to filter the sample extracts before LC analysis (especially for UHPLC applications) different filter materials should be carefully evaluated to avoid the risk of contamination from filters or analyte losses as a result of adsorption onto the filters.
The previous studies9,10,11,12,13 by Lehotay’s group carried out assessments of four different types of filters. It was discovered that a polyvinylidenefluoride (PVDF) filter offered the overall best performance.
It should be noted that the group also found that while filtration did filter out several of the drug analytes, it also introduced prospective signal enhancement matrix effects and interfering components in sample matrices.9,12,14
The Lehotay researchers opted to remove the clean-up and filtration steps from their latest method altogether. By employing modern instrumentation and injecting a small volume of samples, which displayed increased analytical scope without disrupting method performance and maintenance needs.14
In this study, different sample preparation methods underwent further evaluation.
The recovery study was conducted by spiking the analytes to the samples at two concentration levels (0.5X and 1X). Recoveries were calculated by comparison of peak areas of fortified samples with the matrix-matched calibration curve.
Average recoveries of analytes ranged from 70% to 120% (Table 3) with the RSD < 20% for the majority of analytes studied where the extract was analyzed directly with no clean-up.
Average recoveries for multiple classes of analytes were found to be lower after d-SPE clean-up using an AOAC 2007.01 clean-up kit (MgSO4 1200 mg, PSA 400 mg and C18 400 mg). These included fluoroquinolones, tetracyclines and several tranquilizers.
Similar results were also acquired when using end-capped C18 as d-SPE sorbent. These results are in good agreement with published results.8,9,10,11,12,13
The results when using Z-Sep+ sorbent during d-SPE clean-up steps are not included here because they were found to be identical to the published results.11
A Linearity, Precision and Limit of Quantification Calibration was completed in matrix-matched (MM) and reagents-only (RO) standards at 0, 0.1X, 0.2X, 0.5X, 1X and 2X.
Where X represents regulatory tolerances or limits (Table 3), equivalent sample concentrations with duplicate injections of each individual standard were dispersed during the UHPLC/MS/MS sequence.
Calibration curves constructed from RO and chicken sample matrix demonstrated good linearity with a correlation coefficient (R2) larger than 0.99 (Figures 2 and 3 show characteristic examples of calibration curves).
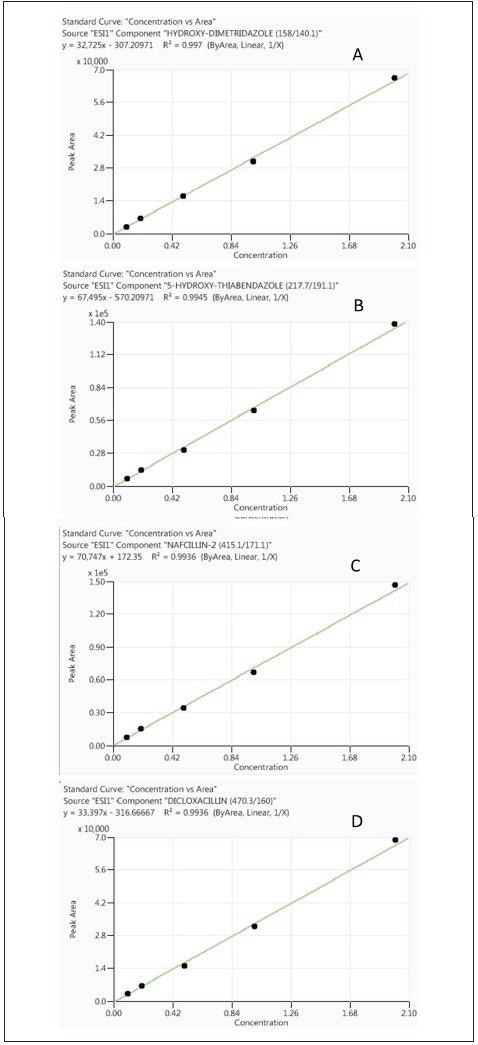
Figure 2. Calibration curves for hydroxyl-dimetridazole (A), 5-hydroxy-thiabendazole (B), nafcillin (C) and dicloxacillin (D) obtained from standards prepared in reagents only (analyte concentrations range from 0.1X to 2X). Image Credit: PerkinElmer Food Safety and Quality
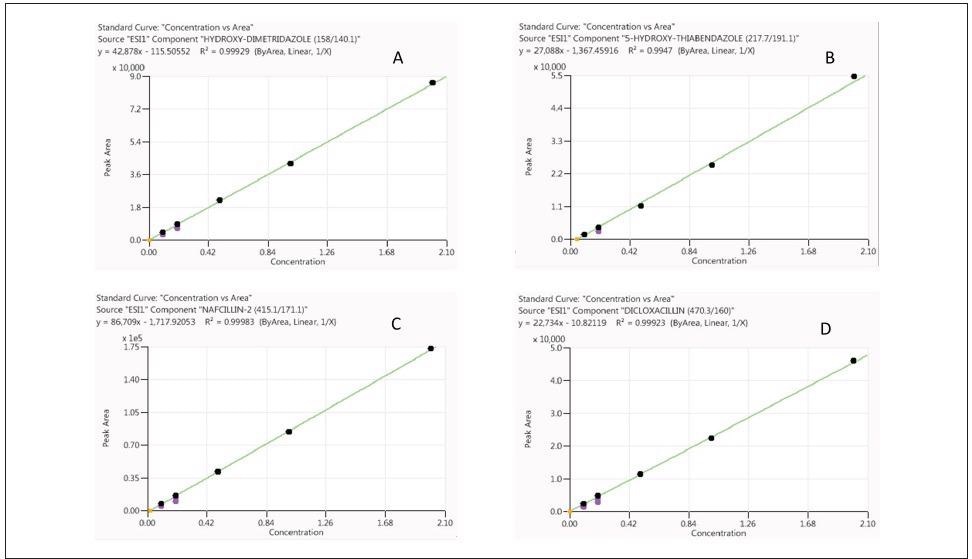
Figure 3. Calibration curves for hydroxyl-dimetridazole (A), 5-hydroxy-thiabendazole (B), nafcillin (C) and dicloxacillin (D) obtained from standards prepared in chicken sample matrix (analyte concentrations range from 0.1X to 2X). Image Credit: PerkinElmer Food Safety and Quality
An assessment of carryover was completed by injecting the reagent blank following a 2X standard. No carryover was noted in any experiment. The method was also found to demonstrate good precision with RSD of less than 20% for almost all of the drugs studied.
The method’s estimated limits of quantification (LOQs) were concentrations with signal to noise (S/N) ratio of 10. All LOQs for the drugs investigated were found to be below the 0.5 X tolerance limits or maximum residue levels (MRLs).
Results indicated that the method is highly suited for the rapid screening and quantification of multi-class veterinary drug residues in chicken samples.
Sample Analysis
The developed method was applied for the analysis of veterinary drugs in five chicken samples fortified with internal standards. None of the studied drugs were detected based on the retention time and mass spectra information (two MRM transitions) in comparison with the corresponding reference standards.
Conclusions
Analytical method development for veterinary drugs in animal tissues is especially challenging due to the prevalence of complex matrices with large amounts of fat, lipids and proteins. The residue analytes of interest are especially diverse, coming from different classes with a range of chemical and physical properties.
Sample preparation remains the cornerstone of many successful methods due to its impact on chromatography, ionization and mass spectrometric analysis.
Sample clean-up is more challenging in MMMs, however, because this process can result in analyte losses, as demonstrated by the results with d-SPE clean-up in previous publications and this study.
To analyze as many analytes as possible, a balance must be struck between ensuring sufficient analyte recovery and reducing sample matrix effects.
Increasing commercial availability and advancement in highly sensitive instrumentation may see the dilute-and-shoot method become the most effective approach to reducing MEs while minimizing instrument maintenance requirements and enhancing chromatography for analytes in the MMMs.
The study presented here highlighted the potential of a cost-effective MMM for veterinary drug analysis in chicken.
This method involved coupling a UHPLC system to a QSight 220 triple-quad mass spectrometer and is highly suited to the rapid screening and analysis of more than 70 veterinary drugs in chickens. The method also boasts LOQs confidently below the limits imposed by regulatory agencies.
Results from several sample preparation methods illustrated that a simple direct injection method with no sample clean-up provided the best overall recovery for all compounds studied, though it was noted sample matrices could impact the analytical column’s lifetime.
Its stay-clean ion source makes the sensitive QSight 300 series mass spectrometer an ideal option for users looking to reduce matrix effects and improve method robustness through the use of more sample dilutions or fewer sample injections while ensuring there is no impact on the method’s detectability.
References
- Maximum Residue Limits (MRLs) and Risk Management Recommendations (RMRs) for Residues of Veterinary Drugs in Foods. CAC/MRL 2-2017. Updated as at the 40th Session of the Codex Alimentarius Commission (July 2017). http:// www.fao.org/fao-who-codexalimentarius/sh-proxy/en/?lnk= 1&url=https%253A%252F%252Fworkspace.fao.org%252 Fsites%252Fcodex%252FStandards%252FCAC%2BMRL% 2B2%252FMRL2e.pdf. Accessed April 13, 2018.
- List of Maximum Residue Limits (MRLs) for Veterinary Drugs in Foods, Health Canada, August, 2017. https://www.canada.ca/en/health-canada/services/drugs-health-products/veterinary-drugs/maximum-residue-limits-mrls/list-maximum-residue-limits-mrls-veterinary-drugs-foods.html. Accessed April 13, 2018.
- Ministry of Agriculture of People's Republic of China Announcement No. 235 Maximum Residue Limits for Veterinary Drugs in Animal Derived Foods, 2002. Note: Ministry of Agriculture has completed the revision of “MRLs of Veterinary Drugs in Animal Derived Food”, but the newly revised version has not yet been published officially.
- Council Regulation (EC) No 1308/1999 of 15 June 1999 amending Regulation (EC) No 2377/90 laying down a Community procedure for the establishment of maximum residue limits of veterinary medicinal products in foodstuffs of animal origin. https://ec.europa.eu/health/sites/health/ files/files/eudralex/vol-5/reg_1999_1308/reg_1308_1999_ en.pdf. Accessed April 13, 2018.
- United States Food and Drug Administration. CFR Title 21— Food and Drugs, Part 556, Tolerances for residues of new animal drugs in food. 2015. https://www.accessdata.fda.gov/scripts/cdrh/cfdocs/cfcfr/cfrsearch.cfm?cfrpart=556. Accessed April 13, 2018.
- USDA Food Safety and Inspection Service. Chemistry laboratory guidebook. https://www.fsis.usda.gov/wps/portal/ fsis/topics/science/laboratories-and-procedures/guidebooks-and-methods/chemistry-laboratory-guidebook. Accessed April 13, 2018.
- Stubbings,G, Bigwood, T, The development and validation of a multi-class liquid chromatography tandem mass spectrometry (LC–MS/MS) procedure for the determination of veterinary drug residues in animal tissue using a QuEChERS approach. Anal. Chim. Acta 2009, 637, 68–78.
- Dalmia, A. PerkinElmer Application Note (01288), Determination, Confirmation and Quantitation of Multi-Class Antibiotic Residues in Milk by UHPLC MS/MS.
- Lehotay SJ, Lightfield AR, Geis-Asteggiante L, Schneider MJ, Dutko T, Ng C, et al. Development and validation of a streamlined method designed to detect residues of 62 veterinary drugs in bovine kidney using ultra-high performance liquid chromatography – tandem mass spectrometry. Drug Test Anal. 2012; 4(Suppl. 1):75–90.
- Schneider MJ, Lehotay SJ, Lightfield AR. Evaluation of a multi-class, multi-residue liquid chromatography-tandem mass spectrometry method for analysis of 120 veterinary drugs in bovine kidney. Drug Test Anal. 2012;4(Suppl. 1):91–102.
- Geis-Asteggiante L, Lehotay SJ, Lightfield AR, Dutko T, Ng C, Bluhm L. Ruggedness testing and validation of a practical analytical method for > 100 veterinary drug residues in bovine muscle by ultrahigh performance liquid chromatography- tandem mass spectrometry. J Chromatogr A. 2012; 1258:43–54.
- Schneider MJ, Lehotay SJ, Lightfield AR. Validation of a streamlined multi-class, multi-residue method for determination of veterinary drug residues in bovine muscle by liquid chromatography tandem mass spectrometry. Anal Bioanal Chem. 2015; 407:4423–35.
- Anumol T, Lehotay SJ, Stevens J, Zweigenbaum J. Comparison of veterinary drug residue results in animal tissues by ultrahigh performance liquid chromatography coupled to triple quadrupole or quadrupole-time-of-flight tandem mass spectrometry after different sample preparation methods, including use of a commercial lipid removal product. Anal Bioanal Chem. 2017; 409:2639–53.
- Lehotay SJ, Lightfield AR. Simultaneous analysis of aminoglycosides with other classes of drug residues in bovine tissues by UHPLC-MS/MS using an ion-pairing reagent added to final extracts. Anal Bioanal Chem. 2017; 410 (3):1095-1109.
- Lopes, RP, Reyes, RC, Frenich, AG, Multi-residue determination of veterinary drugs in aquaculture fish samples by ultra-high performance liquid chromatography coupled to tandem mass spectrometry, J. Chromatogr. B, 2012, 895-896, 39-47.
- Dasenaki, ME, Thomaidis, NS, Multi-residue determination of 115 veterinary drugs and pharmaceutical residues in milk powder, butter, fish tissue and eggs using liquid chromatography–tandem mass spectrometry, Anal. Chim. Acta. 2015, 880, 103–121.
- Yin, ZQ, Chai, TT, Mu, PQ, Xu, NN, Song, Y, Wang, X, Jia,Q, Qiu, J, Multi-residue determination of 210 drugs in pork by ultra-high-performance liquid chromatography–tandem mass spectrometry. J. Chromatogr. A, 2016, 1463, 49–59.
- Dasenaki, ME, Michali,CS, Thomaidis, NS. Analysis of 76 veterinary pharmaceuticals from 13 classes including aminoglycosides in bovine muscle by hydrophilic interaction liquid chromatography–tandem mass spectrometry. J. Chromatogr. A, 2016, 1452, 67–80.
- Berendsen BJA, Meijer T, Mol HGJ, van Ginkel L, Nielen MWFA. Global inter-laboratory study to assess acquisition modes for multi-compound confirmatory analysis of veterinary drugs using liquid chromatography coupled to triple quadrupole, time of flight and orbitrap mass spectrometry. Anal. Chim. Acta. 2017; 962:60–72.
- PerkinElmer Technical Note (013093-01): QSight StayClean HSID Technology. https://www.perkinelmer.com/ie.
- European Commission, SANCO. 2015. Guidance document on analytical quality control and method validation procedures for pesticides residues analysis in food and feed, SANTE/11945/2015 https://www.eurl-pesticides.eu/docs/public/tmplt_article.asp?CntID=727.
- Stahnke H, Kittlaus S, Kempe G, and Alder L. Reduction of matrix effects in liquid chromatography-electrospray ionization-mass spectrometry by dilution of the sample extracts: how much dilution is needed? Anal. Chem. 2012, 84:1474–1482.
- Krynitsky, A. J. Wong, J. W. Zhang K. and Safarpour, H. Focus on Food Analysis: Important considerations regarding matrix effects when developing reliable analytical residue methods using mass spectrometry, LCGC North America, 2017, Vol. 35, No. 7, 444-451.
Acknowledgments
Produced from materials originally authored by Jingcun Wu, Josh Ye, Erasmus Cudjoe, and Feng Qin from PerkinElmer, Inc.

This information has been sourced, reviewed and adapted from materials provided by PerkinElmer Food Safety and Quality.
For more information on this source, please visit PerkinElmer Food Safety and Quality.