Conventional analysis using chromatography and mass spectrometry typically necessitates a series of sample clean-up measures to minimize matrix effects and ensure that there is no contamination of the mass spectrometer's ion source.
This sample preparation is often highly labor-intensive and must be performed by experienced analysts with specialized skills and training.
Work is ongoing to redesign the front end of mass spectrometers with a view of minimizing the risk of source contamination, therefore, removing this need for extensive sample clean-up.
One of the most promising outcomes of this work has been the development of the hot surface induced desolvation (HSID™) interface.1
The QSight™ LC/MS/MS mass spectrometer from PerkinElmer features the HSID interface coupled to a Laminar flow ion guide™. Both components help avoid the accumulation of contamination along the ion path, adding to the instrument's already robust sensitivity while making it virtually maintenance-free.
This study employs a QSight LC/MS/MS system in terms of its potential to remove sample preparation requirements for trace level pesticide analysis in a complex sample such as wine.2
Undiluted red and white wine samples were injected into the mass spectrometer to ascertain levels of reproducibility in the analysis of spiked pesticides over 200 injections.
The instrument demonstrated excellent reproducibility with negligible amounts of signal drift over the course of the week-long study. These tests confidently confirmed the robustness of the QSight mass spectrometer.
What is the HSID Interface, and How Does it Work?
The HSID tool is a multi-orthogonal channel interface that is directly heated up to 300 °C. It is fitted directly after the sampling orifice in the source, connecting this orifice to the QSight mass spectrometer's Laminar flow ion guide.
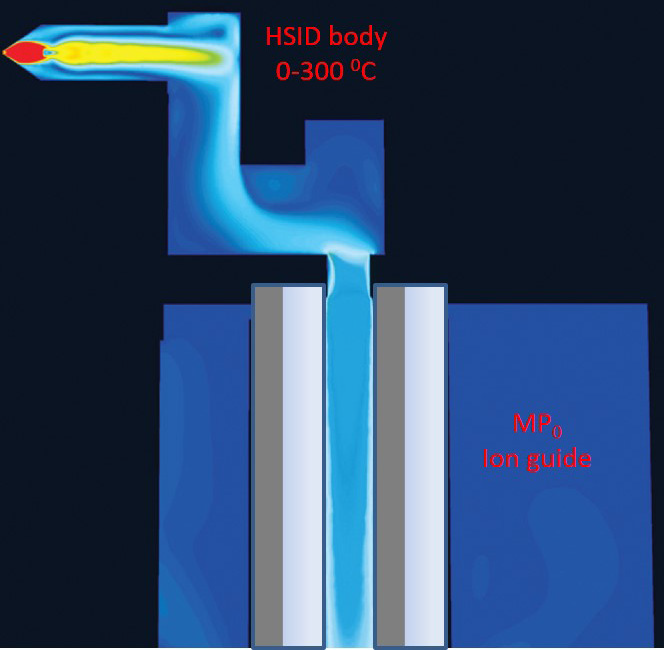
Figure 1. Schematic of an HSID interface for laminar flow tandem mass spectrometry. Image Credit: PerkinElmer Food Safety and Quality
The HSID's multi-channels are orthogonal to each other (Figure 1), producing turbulent and Laminar flow that disrupts the free jet expansion of the sample ions.
These orthogonal channels stop neutrals from entering the mass spectrometer, resulting in a reduction in chemical noise. This is further reduced by the solvated charged clusters entering the HSID being entrained and desolvated in the hot flow of gas.
Ions from the HSID interface are gradually transferred by gas flow to the Laminar flow ion guide™, which is at zero potential but not subject to the traditional axial fields.
The ion guide uses multiple pumping stages to generate several pressure regions between the sample interface to the mass analyzer. Pressure gradually drops in the regions, resulting in a well-defined flow pattern along the ion path and enabling ions to be carefully extracted into the analyzer.
The laminar flow ion guide and the HSID stop any accumulation of contamination occurring along the ion path, essentially making the QSight maintenance-free.
The HSID interface also helps ensure high sensitivity due to an inherent reduction in chemical background (for example, S/N, reduced N), as well as offering users the ability to perform analysis at high LC flow rate (3 mL/min) with no signal reduction.
Experimental
Hardware and Software
A PerkinElmer Altus® A-30 UPLC® System was employed in the chromatographic separation in this study, while detection was accomplished using a PerkinElmer QSight 220 MS/MS detector with a dual ionization source.
Instrument control, data acquisition and data processing were all performed with the Simplicity 3Q™ software platform. The mobile phase flow rate was established at 0.5 mL/min.
Method Parameters
MS settings are displayed in Table 1 and Table 2, respectively. Source parameters were all optimized to ensure maximum sensitivity. These include source temperatures, gas flows and position settings. Quadrupole peak widths (Q1 and Q2) were set to 0.7 amu.
Table 3 provides a series of example compound-dependent parameters for the partial list of MRM transitions.
Table 1. MS source settings. Source: PerkinElmer Food Safety and Quality
| . |
. |
| ESI voltage |
5000 V |
| Drying gas |
120 |
| HSID Temp |
200 °C |
| Entrance voltage |
30 V |
| Source Temp |
325 °C |
| Nebulizer gas |
350 |
| Detection Mode |
MRM Mode |
Table 2. Optimized compound-dependent parameters for selected pesticides. Source: PerkinElmer Food Safety and Quality
| Name |
Precursor |
Fragment |
Type |
Collision Energy |
| Dimethenamid |
276.1 |
244.0 |
Quantifier |
18 |
| Dimethenamid |
276.1 |
168.0 |
Qualifier |
30 |
| Benthiavalicarbisopropyl |
382.1 |
180.0 |
Quantifier |
38 |
| Benthiavalicarbisopropyl |
382.1 |
197.0 |
Qualifier |
24 |
| Pyriproxyfen |
322.0 |
96.0 |
Quantifier |
22 |
| Pyriproxyfen |
322.0 |
185.0 |
Qualifier |
30 |
Standards and Samples
Argentina wine samples were purchased from a local grocery store. These included a bottle of Pinot Grigio (Pinot) and a bottle of Cabernet Sauvignon (Cabernet). Samples were fortified to 10 ng/mL of pesticide using mixed standards acquired from ULTRA Scientific® (North Kingstown, RI).
Next, 10 µL of spiked samples (no dilution or further sample preparation) were injected to enable robustness and reproducibility analysis and an evaluation of the analytes' linearity and LOQs.
A series of matrix-matched standards were prepared at 0.1, 1, 10 and 100 ng/mL levels. This was accomplished by diluting the pesticide mix standards stock solution with blank Pinot and Cabernet wine samples.
Results and Discussion
Robustness Study
Commercial wine samples (Pinot and Cabernet) were each fortified to 10 ng/mL with a pesticides mixed standard. Once fortified, these samples were tested via 200 repeat injections over a period of 7 days.
Three pesticides (Dimethenamid, Benthiavalicarb-isopropyl and Pyriproxyfen) were chosen to highlight the system's stability.
Figure 2 displays a summarized plot of peak area versus injection number for these analytes in spiked Pinot and Cabernet.
The trace remained flat across the 200 injections, with peak area reproducibility (CV, calculated as relative standard deviation) being reported as ~5%. This confirms exceptional performance stability during the analysis.
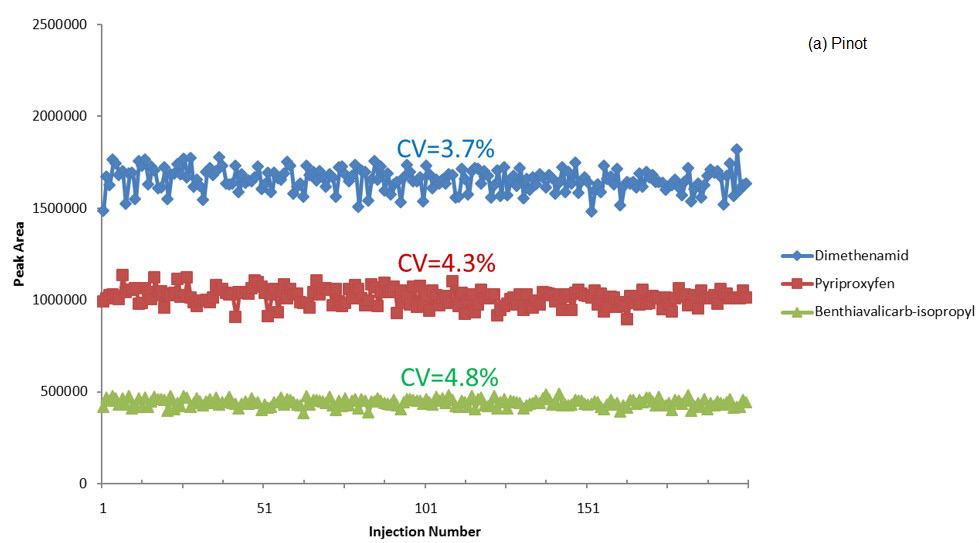
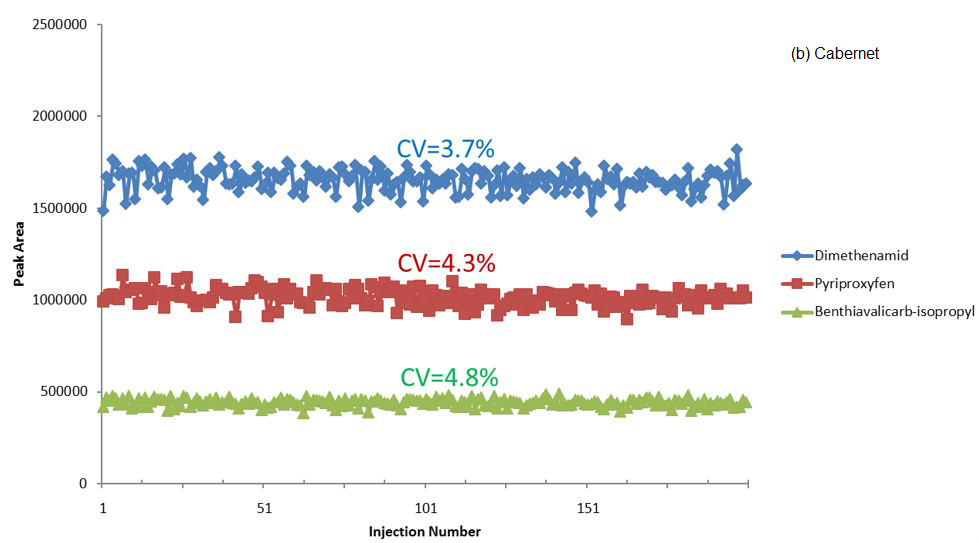
Figure 2. Peak area of three pesticides vs injection number for spiked (a) Pinot Grigio and (b) Cabernet Sauvignon samples. Image Credit: PerkinElmer Food Safety and Quality
Comparison of Calibration Curves Prior to and Following 200 Injection Study
Matrix-matched representative calibration curves for quantitative and qualitative ions for Benthiavalicarb-isopropyl, Dimethenamid and Pyriproxyfen are displayed in Figure 3 (Pinot) and Figure 4 (Cabernet). These were constructed following the wine injection study.
The selected pesticides display a linear dynamic range of 0.5 to 100 ng/mL - identical to the calibration curves constructed before wine injections. Linear regression coefficients were acquired for every pesticide, with R2 >0.992.
The EU regulation does not yet set a maximum residue limit (MRL) of pesticides for wine yet, but a limit of quantitation (LOQ) at a level of low parts per billion or less is largely considered adequate.
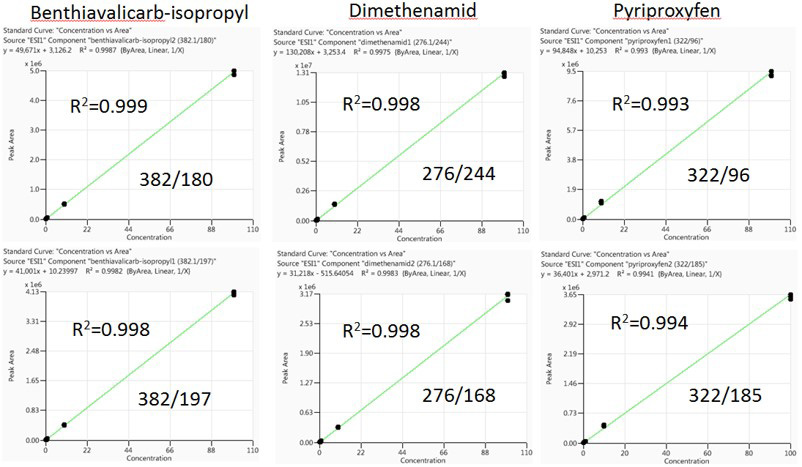
Figure 3. Pinot matrix-matched calibration curves for Benthiavalicarb-isopropyl, Dimethenamid, and Pyriproxyfen. Image Credit: PerkinElmer Food Safety and Quality
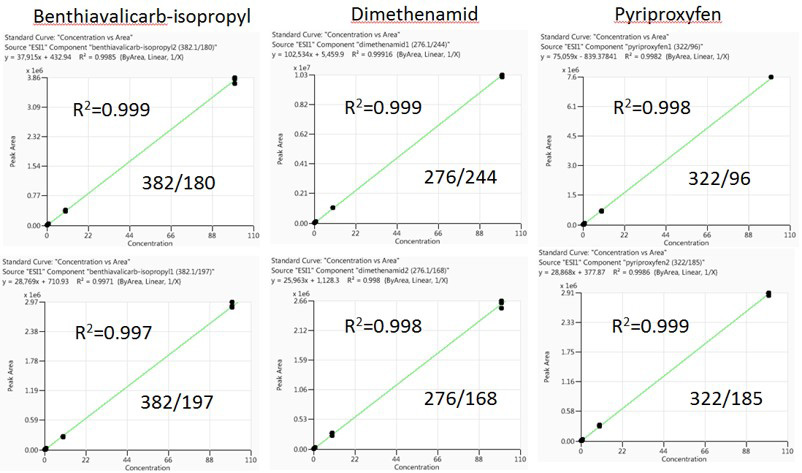
Figure 4. Carbernet matrix-matched calibration curves for Benthiavalicarb-isopropyl, Dimethenamid, and Pyriproxyfen. Image Credit: PerkinElmer Food Safety and Quality
Conclusion
The study outlined here utilized a "no-dilute-just-shoot" approach to highlight the advantages of an HSID interface on a PerkinElmer QSight 220 LC/MS/MS system.
The interface's orthogonal design, coupled with the turbulent and laminar flows employed in ion transportation, offers maximum contamination protection for the MS instrument.
Instrument performance remained consistent over the course of testing the two matrix variables x 200 continuous injections of wine samples with no clean-up steps.
Peak area CVs are ~5%, while peak shape and height are almost identical. Linearity and LOQs of the calibration curves were found to be maintained after >200 injections. This was the case for all analytes using matrix-matched standards.
This study indicates a notable potential to increase lab productivity and lower cost by using the QSight LC/MS/MS system and injecting samples that are prepared with minimal clean-up steps.
References
- Flow Characteristics of a Laminar Flow Interface for LC-MS/MS. PerkinElmer Tech Note 0129893.
- Meglioli M, Kero F, Ye J, Young C, Reddy S "No dilute" just shoot LC-ESI-MS/MS : feasibility and robustness of a maintenance-free source for applications in low-level pesticide residue analysis "The Proceedings of the 64th ASMS Conference on Mass Spectrometry and Allied Topics, San Antonio, TX, June 2016.
Acknowledgments
Produced from materials originally authored by Josh Ye, Feng Qin, Frank Kero, Craig Young, Jason Weisenseel, and Jamie Foss from PerkinElmer, Inc. and Matteo Maglioli. Ph.D.

This information has been sourced, reviewed and adapted from materials provided by PerkinElmer Food Safety and Quality.
For more information on this source, please visit PerkinElmer Food Safety and Quality.