Antibiotics are frequently employed in veterinary medicine as growth promoters and for the treatment and prevention of disease. Unwarranted use of antibiotics could lead to residue violations in animal-originated food, including meat and milk – posing a potential risk to human health.
Antibiotic residues in food can trigger toxicity and a range of side-effects, including allergic reactions, nausea and rashes. Long-term consumption of low levels of antibiotics in food products can result in the spread of drug-resistant bacteria.
Due to this, every country in the world regulates the use of antibiotics in animals.
Canada and the European Union have set maximum residue levels (MRLs) of drug residues in food, while the USA refers to these as tolerance levels.
Antibiotic residue classes used in milk and attracting regulatory interest include sulfonamides, fluoroquinolones, β-lactams, macrolides and tetracyclines. Table 1 provides tolerance limits in milk for the classes of antibiotics analyzed in this study.
Table 1. List of antibiotics from different classes and their tolerance limit in milk. Source: PerkinElmer Food Safety and Quality
| Compound |
Antibiotic Class |
Tolerance Levela |
| Sulfamethazine |
Sulfonamide |
10 ng/mlb |
| Sulfamethoxazole |
Sulfonamide |
10 ng/mlb |
| Sulfadimethoxinef |
Sulfonamide |
10 ng/mlb |
| Tilmicosin |
Macrolide |
100 ng/mlc |
| Tylosin |
Macrolide |
50 ng/ml |
| Erythromycin |
Macrolide |
50 ng/ml |
| Penicillin-G |
β-lactam |
5 ng/ml |
| Cloxacillin |
β-lactam |
10 ng/ml |
| Ofloxacin |
Fluoroquinolone |
5 ng/mld |
| Ciprofloxacin |
Fluoroquinolone |
5 ng/mld |
| Sarafloxacin |
Fluoroquinolone |
5 ng/mld |
| Tetracycline |
Tetracycline |
300 ng/mle |
| Chlortetracycline |
Tetracycline |
300 ng/mle |
a Tolerance or safe levels in milk from 9/27/05 FDA/CFSAN Milk Safety Branch memo1
b Amounts listed are “safe level” not a tolerance
c No tolerance set for milk ; method target level set at 100 ng/ml (tolerance in muscle)
d No tolerance or safe levels have been established; method target levels set at 5 ng/ml
e Tolerance includes sum and individual residues; method target levels set at 100 ng/ml each
f Extra-label use of sulfonamide drugs in lactating dairy cattle (except sulfadimethoxine) is prohibited1
This article presents a rapid, sensitive LC/MS/MS method that is ideal for the quantitative and confirmatory analysis of multi-class antibiotics in milk. Antibiotics analyzed in this study included:
- Ciprofloxacin
- Sarafloxacin
- Ofloxacin
- Penicillin-G
- Cloxacillin
- Tilmicosin
- Tylosin
- Erythromycin
- Sulfamethazine
- Sulfamethoxazole
- Sulfadimethoxine
- Tetracycline
- Chlortetracycline.
Two internal standards were employed in this method - ciprofloxacin-d8 and flunixin-d3. A modified, basic QuEChERS method was utilized in the extraction of a range of antibiotics from milk.
The method demonstrated good sensitivity, recovery, linearity, precision and selectivity, making it well suited to the analysis of antibiotics in milk at the low tolerance levels defined by numerous regulatory bodies.
Hardware and Software
Samples and Sample Preparation
A PerkinElmer Altus™ UPLC® System was used for the chromatographic separations. This instrument included the Altus A-30 Solvent/Sample Module, column heater and integrated vacuum degasser.
A QSight™ 210 Triple Quadrupole MS/MS detector was used for detection, while instrument control, analysis and data processing were all done via the Simplicity 3Q™ software platform.
Method Parameters
Table 2 provides the full list of LC method and MS source parameters.
Table 2. LC Method and MS Source Parameters. Source: PerkinElmer Food Safety and Quality
| LC Conditions |
| Column: |
PerkinElmer Brownlee™ SPP C18, 2.7 μm, 2.1 x 100 mm (Part # N9308404) |
| Mobile Phase: |
Solvent A: 5mM ammonium formate, 0.1 % formic acid in water
Solvent B: 95 % Acetonitrile (ACN)/ 5 % Methanol with 0.1 % formic acid
| |
Time (min) |
%A |
%B |
Curve |
| 1 |
Initial |
95.0 |
5.0 |
| 2 |
0.50 |
95.0 |
5.0 |
6 |
| 3 |
7.50 |
40.0 |
60.0 |
6 |
| 4 |
10.00 |
0.0 |
100.0 |
6 |
| 5 |
15.00 |
0.0 |
100.0 |
6 |
| 6 |
15.30 |
95 |
5.0 |
6 |
|
| Analysis Time: |
12 min; Column wash time with 100% B: 3 min; re-equilibration time: 4.2 min |
| Flow Rate: |
0.4 mL/min |
| Pressure: |
4200 psi/285 bar (maximum) |
| Oven Temp.: |
30 ºC |
| Injection Volume: |
10 μL |
| Sample Temp: |
7 ºC |
| MS Conditions |
| Ionization Mode: |
ESI - positive |
| Drying Gas (Nitrogen) Setting: |
75 arbitrary units |
| HSID™ Temp: |
320 °C |
| Electrospray Voltage: |
5500 V |
| Source Temp: |
425 ºC |
| Nebulizer Gas (Nitrogen) Setting): |
175 arbitrary units |
| Detection Mode: |
MRM Mode |
Solvents, Standards and Sample Preparation
Solvents, reagents and diluents used in this study were all LC/MS grade, with every antibiotic standard provided by Sigma-Aldrich® Inc., Saint-Louis, MO. These were stored at 4 °C in a refrigerator to prevent their degradation.
Stock and mixed drug solutions for calibration and spiking were prepared in methanol. This was the case for all antibiotics, except β-lactams, which used water as a solvent. It is necessary to store β-lactam standards in plastic vials, though other antibiotic standards can be stored in glass or plastic containers.
Sorbent end capped C18 was acquired from Supelco, with vials kept at 7 °C in an autosampler tray to prevent analyte degradation. All stock and working standards were stored under refrigeration until required, with only amber 2-mL LC vials used. This was also done to prevent degradation.
Two internal standards were used for calibration and quantitation purposes: ciprofloxacin-d8 for sulfonamides, fluoroquinolones and tetracyclines and flunixin-d3 for macrolides and β-lactams.
Organic whole milk samples from a local market were employed as a controlled blank matrix. Five different types of milk samples were also analyzed with different fat contents to investigate the presence of antibiotics. A basic, modified QuEChERS method was employed for sample preparation.2,3
- A total of 20 ml of organic solvent (methanol or acetonitrile) was added to 5 ml of either blank organic milk or milk fortified with different levels of antibiotics and internal standards at 15 ng/ ml.
- Samples underwent pulsed-vortexing for 1 minute before being centrifuged at 7800 rpm for 10 minutes.
- Supernatant was removed and 1.2 g of C18 was added for dispersive-SPE fat removal.
- Samples underwent pulsed-vortexing for 5 minutes before being centrifuged at 7800 rpm for 5 minutes.
- A total of 12.5 ml of supernatant was taken out and dried down to 1.5 to 2 ml with dry nitrogen. This was done for around 1 hour at 40 °C.
- The sample was reconstituted with 15 % methanol in water to bring the total volume up to 2.5 ml of extract.
- The extract was filtered through PVDF filter (0.22 µm).
For matrix-matched calibration, spiking and internal standard solutions were added after step 7 to provide equivalent analyte concentrations in samples ranging from 0.1 ng/ml to 1000 ng/ml. There were five replicates at each calibration level.
MS/MS Parameters
Electrospray ionization in positive mode was employed in the analysis of all residues. Source parameters (such as source temperature, gas flows and position settings) were optimized.
This was done by infusing a 0.5 µg/ml solution of sulfamethazine at 10 µl/min into a stream of 90:10 water:acetonitrile with 0.1% formic acid and 5 mM ammonium formate at a flow rate of 0.5 ml/min.
Solutions for each individual residue were infused at 0.5 µg/ml to ascertain optimal collision energies for each MRM transition. Quadrupole peak widths (Q1 and Q3) were set at 0.7 amu.
Table 3 provides the parameters for each MRM transition, and three of these MRM transitions were monitored for each antibiotic residue to limit the number of false positives and negatives in the method.4
Results and Discussion
Table 4 summarizes LOQ and regression values for each antibiotic’s calibration curves 4. The LOQ for each analyzed antibiotic was found to be lower than the acceptable tolerance level in milk by a factor of 5 to 100.
Table 3. MS/MS parameters of LC/MS/MS method. Source: PerkinElmer Food Safety and Quality
| Analyte |
Retention Time |
Dwell Time |
Precursor Ion |
Quant Ion |
CE |
Qual Ion 1 |
CE |
Qual Ion 2 |
CE |
| Sulfamethazine |
3.37 min |
10 ms |
279.1 |
186 |
20 V |
156 |
25 V |
107.9 |
40 V |
| Sulfamthoxazole |
4.38 min |
10 ms |
254.1 |
107.9 |
40 V |
91.7 |
55 V |
156 |
30 V |
| Sulfadimethoxine |
5.15 min |
10 ms |
311.1 |
156 |
25 V |
91.7 |
40 V |
107.9 |
50 V |
| Tilmicosin |
4.93 min |
30 ms |
435.3 |
695.4 |
20 V |
174 |
30 V |
87.9 |
55 V |
| Tylosin |
5.70 min |
30 ms |
916.5 |
174 |
46 V |
100.9 |
64 V |
144.9 |
48 V |
| Erythromycin |
5.41 min |
20 ms |
734.4 |
158 |
40 V |
576.2 |
22 V |
115.9 |
66 V |
| Penicillin-G |
5.38 min |
30 ms |
334.9 |
160 |
22 V |
176 |
22 V |
113.9 |
48 V |
| Cloxacillin |
6.6 min |
30 ms |
436.2 |
277.1 |
18 V |
113.9 |
62 V |
178 |
50 V |
| Ofloxacin |
3.30 min |
10 ms |
361.9 |
317.9 |
25 V |
343.9 |
25 V |
260.9 |
35 V |
| Ciprofloxacin |
3.38 min |
10 ms |
331.9 |
313.9 |
24 V |
230.9 |
51 V |
187.9 |
75 V |
| Sarafloxacin |
3.93 min |
10 ms |
385.9 |
367.9 |
28 V |
341.9 |
24 V |
298.9 |
36 V |
| Tetracycline |
3.52 min |
30 ms |
445.1 |
410.1 |
16 V |
154 |
24 V |
97.9 |
36 V |
| Chlortetracycline |
4.33 min |
30 ms |
479 |
444 |
26 V |
462 |
22 V |
154 |
36 V |
| Ciprofloxacin-d8 |
3.36 min |
10 ms |
340.1 |
235 |
48 V |
- |
- |
- |
- |
| Flunixin-d3 |
7.20 min |
10 ms |
300 |
282 |
30 V |
- |
- |
- |
- |
Table 4. LOQ and Linearity Correlation coefficients for different antibiotic residues in milk extract. Source: PerkinElmer Food Safety and Quality
| Compound |
LOQ in Milk |
Linear Calibration Curve Concentration Range |
Correlation Coefficient R2 |
| Sulfamethazine |
0.1 ng/ml |
0.1-1000 ng/ml |
0.9986 |
| Sulfamethoxazole |
0.1 ng/ml |
0.1-1000 ng/ml |
0.9996 |
| Sulfadimethoxine |
0.1 ng/ml |
0.1-1000 ng/ml |
0.9991 |
| Tilmicosin |
0.1 ng/ml |
0.1-1000 ng/ml |
0.9990 |
| Tylosin |
1 ng/ml |
1-1000 ng/ml |
0.9980 |
| Erythromycin |
0.3 ng/ml |
0.3-1000 ng/ml |
0.9958 |
| Penicillin-G |
1 ng/ml |
1-1000 ng/ml |
0.9981 |
| Cloxacillin |
1 ng/ml |
1-1000 ng/ml |
0.9985 |
| Ofloxacin |
0.1 ng/ml |
0.1-1000 ng/ml |
0.9982 |
| Ciprofloxacin |
0.1 ng/ml |
0.1-1000 ng/ml |
0.9978 |
| Sarafloxacin |
0.1 ng/ml |
0.1-1000 ng/ml |
0.9968 |
| Tetracycline |
0.3 ng/ml |
0.3-1000 ng/ml |
0.9956 |
| Chlortetracycline |
0.3 ng/ml |
0.3-1000 ng/ml |
0.9984 |
This confirmed that the method was sensitive enough to analyze antibiotics in milk at low tolerance levels.
Figure 1 displays three MRM transitions for a single antibiotic – sulfamethazine. These were spiked at a 5 ng/ml level in a milk matrix, demonstrating a good signal to noise. The retention time for each analyte was found to be reproducible within ± 0.1 minutes over a 24-hour period.
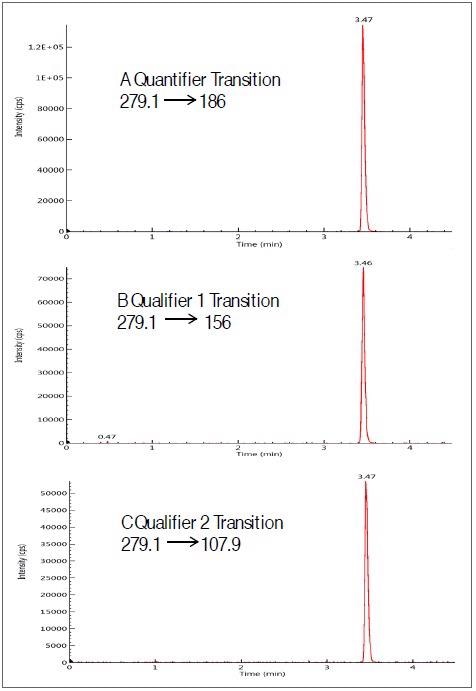
Figure 1. Chromatograms of three MRM transitions( one quantifier-A and two qualifiers-B,C) of sulfamethazine spiked at 5ng/ml in milk extract. Image Credit: PerkinElmer Food Safety and Quality
Blank milk samples were spiked with varying concentrations of antibiotics (0.1-1000 ng/mL) to generate a matrix-matched calibration curve. This was done at nine different concentration levels along with internal standards.
Figure 2 provides an example calibration curve for sulfamethazine, shown over four orders of magnitude.
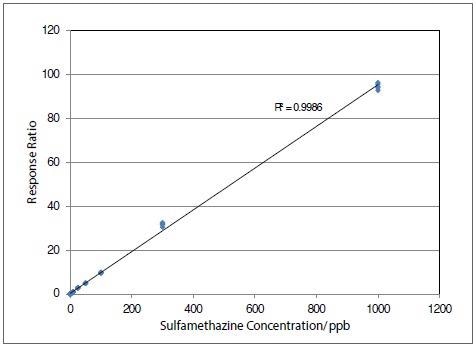
Figure 2. Calibration curve for sulfamethazine over concentration range from 0.1 to 1000 ng/ml for n=5 at each level in milk extract. Image Credit: PerkinElmer Food Safety and Quality
The calibration curves were determined to be linear, with a calibration fit of R2 greater than 0.9958 for all the analytes. Table 5 demonstrates exceptional precision of response for each analyte for five replicates at different concentration levels.
Table 5. Repeatability of response for antibiotic residues at different levels in milk extract. Source: PerkinElmer Food Safety and Quality
| Compound |
2.5 ng/ml RSD
(n=5) |
5 ng/ml RSD
(n=5) |
10 ng/ml RSD
(n=5) |
25 ng/ml RSD
(n=5) |
50 ng/ml RSD
(n=5) |
100 ng/ml RSD
(n=5) |
| Sulfamethazine |
2.4 % |
2.4 % |
1.1 % |
1.4 % |
0.8 % |
0.7 % |
| Sulfamethoxazole |
3.5 % |
4.7 % |
2.8 % |
1.7 % |
2.9 % |
1.4 % |
| Sulfadimethoxine |
3.0 % |
0.8 % |
2.0 % |
1.6 % |
1.2 % |
1.7 % |
| Tilmicosin |
0.7 % |
1.5 % |
1.8 % |
0.7 % |
0.8 % |
1.1 % |
| Tylosin |
7.8 % |
4.3 % |
3.9 % |
2.1 % |
2.2 % |
1.4 % |
| Erythromycin |
4.7 % |
3.8 % |
4.0 % |
1.7 % |
2.3 % |
0.8 % |
| Penicillin-G |
3.0 % |
4.4 % |
4.2 % |
1.4 % |
2.6 % |
1.5 % |
| Cloxacillin |
4.5 % |
4.4 % |
3.7 % |
2.5 % |
1.8 % |
1.4 % |
| Ofloxacin |
2.9 % |
1.9 % |
2.6 % |
1.5 % |
1.7 % |
1.8 % |
| Ciprofloxacin |
2.2 % |
2.3 % |
0.9 % |
3.1 % |
1.0 % |
1.1 % |
| Sarafloxacin |
2.4 % |
2.8 % |
2.0 % |
1.5 % |
2.0 % |
0.7 % |
| Tetracycline |
6.1 % |
5.9 % |
6.1 % |
4.7 % |
2.8 % |
1.3 % |
| Chlortetracycline |
5.6 % |
5.0 % |
5.7 % |
3.6 % |
4.1 % |
2.1 % |
The data highlighted that the RSD of the response was less than 5% at a concentration level of half of the tolerance level or higher for each analyte present in the milk extract.
Table 6 provides a summary of all 13 antibiotics’ recovery at concentration levels close to their tolerance limit in milk. Absolute recoveries of antibiotics of the macrolides, sulfonamides and β-lactam classes were found to be between 70% and 120%, with RSD% <20% for replicate samples (n=5).
Absolute recoveries for fluoroquinolones were found to be between 60% and 70%, while absolute recoveries for tetracycline were found to be under 30%. Recovery for internal standards - ciprofloxacin-d8 and flunixin-d3 - was around 70% and 90%, respectively.
Since fluoroquinolones and deuterated fluoroquinolones are likely to endure comparable losses during the extraction process, it is acceptable to use an internal standard to compensate for lower absolute recoveries for fluoroquinolones.
Recoveries for fluoroquinolones and tetracyclines (Table 1) have been corrected for losses during the extraction process via the use of the internal standard ciprofloxacin-d8.
Recoveries of fluoroquinolones were found to be between 80% and 110%, following corrections using deuterated fluoroquinolone as an internal standard, while this was around 30% for tetracyclines. A deuterated tetracycline can be used to compensate tetracycline losses with this extraction process in future experiments.
Table 6 lists the impact of using a range of organic solvents during protein precipitation, highlighting how these may affect the recovery of analytes and ion suppression from a matrix.
Table 6. Average and RSD of recovery and matrix effect for different antibiotics from milk extract with different extraction solvents (acetonitrile and methanol) during protein precipitation step of extraction process. Source: PerkinElmer Food Safety and Quality
| Compound |
Fortified Level (ng/ml) |
Recovery with Methanol |
Recovery RSD with Methanol N=5 |
Matrix Effect with Methanol |
Recovery with Acetonitrile |
Recovery RSD with Acetonitrile N=5 |
Matrix Effect with Acetonitrile |
| Sulfamethazine |
10 |
102 % |
8 % |
110 % |
101 % |
9 % |
102 % |
| Sulfamethoxazole |
10 |
103 % |
10 % |
93 % |
105 % |
13 % |
97 % |
| Sulfadimethoxine |
10 |
96 % |
7 % |
111 % |
104 % |
7 % |
106 % |
| Tilmicosin |
50 |
89 % |
10 % |
127 % |
82 % |
15 % |
103 % |
| Tylosin |
50 |
97 % |
14 % |
83 % |
92 % |
17 % |
97 % |
| Erythromycin |
50 |
98 % |
11 % |
80 % |
27 % |
17 % |
91 % |
| Penicillin-G |
10 |
103 % |
10 % |
94 % |
84 % |
10 % |
96 % |
| Cloxacillin |
10 |
94 % |
13 % |
97 % |
96 % |
13 % |
102 % |
| Ofloxacin |
10 |
101 % |
17 % |
163 % |
97 % |
1.7 % |
181 % |
| Ciprofloxacin |
10 |
102 % |
16 % |
174 % |
87 % |
1.0 % |
163 % |
| Sarafloxacin |
10 |
104 % |
11 % |
162 % |
96 % |
9 % |
142 % |
| Tetracycline |
50 |
32 % |
5 % |
152 % |
24 % |
5 % |
120 % |
| Chlortetracycline |
50 |
25 % |
8 % |
177 % |
21 % |
10 % |
130 % |
It should be noted that recovery of all analytes was similar with both solvents, except for erythromycin - recovery of erythromycin with acetonitrile and methanol was around 27% and 98%, respectively.
Matrix suppression and enhancement was calculated by applying a ratio of the response of an analyte in milk matrix to a solvent standard. When sample preparation was used either for methanol or acetonitrile, matrix suppression and enhancement was negligible for sulfonamides, macrolides and β-lactams.
Fluoroquinolones and tetracyclines each demonstrated a degree of ion enhancement from the matrix. On average, the use of methanol rather than acetonitrile resulted in higher ion enhancement effects. This was linked to the matrix for fluoroquinolones and tetracyclines.
Five milk samples with varying fat content (1% to 5%) were fortified with internal standards. These were then screened for antibiotics using the method outlined here.
Retention time and quantifier ion response confirm that none of the target antibiotic analytes were detected, even at a level three times lower than the LOQ of the method (0.1 to 1 ng/ml).
It was determined that the RSD of recovery of the two internal standards from milk samples with different fat content was under 15%, indicating, therefore, that milk’s fat content did not impact the recovery of these analytes when using the sample preparation method outlined here.
Rather than two transitions, three ion transitions were monitored to ensure accurate identification and confirmation. This approach provides two product ion ratios instead of one, ensuring higher selectivity and improved identification specificity.
Ion ratios were determined by calculating the peak area for less intense ion to the peak area for more intense ion to generate ion ratios less than 100%.
Table 7 displays average ion ratios for target analytes. These are shown at concentration levels of half the tolerance level to 10 times the tolerance level in milk extract.
Table 7. Average of 2 ion ratios and their ranges for antibiotic residues at different concentration levels in milk extract. Source: PerkinElmer Food Safety and Quality
| Compound |
Ion Ratio 1 |
Relative Ion Ratio 1 Difference |
Ion Ratio 2 |
Relative Ion Ratio 2 Difference |
| Sulfamethazine |
57 % |
± 5 % |
43 % |
± 6 % |
| Sulfamethoxazole |
99 % |
± 5 % |
90 % |
± 6 % |
| Sulfadimethoxine |
38 % |
± 6 % |
29 % |
± 5 % |
| Tilmicosin |
76 % |
± 5 % |
64 % |
± 5 % |
| Tylosin |
44 % |
± 6 % |
26 % |
± 11 % |
| Erythromycin |
46 % |
± 5 % |
24 % |
± 6 % |
| Penicillin-G |
78 % |
± 5 % |
50 % |
± 10 % |
| Cloxacillin |
43 % |
± 5 % |
38 % |
± 6 % |
| Ofloxacin |
69 % |
± 9 % |
62 % |
± 7 % |
| Ciprofloxacin |
43 % |
± 5 % |
2.5 % |
± 12 % |
| Sarafloxacin |
13 % |
± 7 % |
8.1 % |
± 7 % |
| Tetracycline |
23 % |
± 6 % |
21 % |
± 10 % |
| Chlortetracycline |
68 % |
± 6 % |
37 % |
± 6 % |
Relative ion ratios at various concentration levels were found to be within ± 11% of the average ion ratio - lower than the acceptable relative tolerance level limit of ± 30% defined by the SANCO guidance on the analysis of chemical residues in food.5
The system’s long-term stability was assessed over a period of 6 days by injecting milk extract spiked with 10 ng/ml of fluoroquinolones, sulfonamides, β-lactams and 50 ng/ml of macrolides and tetracyclines.
The long-term normalized response of 10 ng/ml of sulfamethazine in milk extract is highlighted in Figure 3 with respect to internal standard.
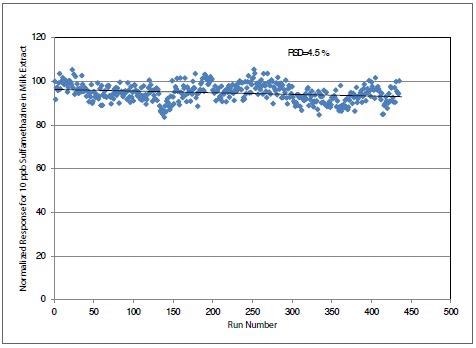
Figure 3. Long term stability data over six days for injections of milk spiked with 10 ng/ml of sulfamethazine. Image Credit: PerkinElmer Food Safety and Quality
It was noted that the response for sulfamethazine did not decrease, even after 6 days of injections. This demonstrates the triple quad MS/MS system’s excellent stability.
Response for 10 of the 13 antibiotic residues in milk extract showed no degradation after 6 days of injections, while response for three (erythromycin, tylosin and ofloxacin) of the 13 antibiotic residues was found to decrease by 30% over 6 days. This can be explained by the known decomposition of these antibiotics over time.
Conclusions
This study effectively demonstrates a rapid, robust and reliable LC/MS/MS method that is sufficiently selective and sensitive for the analysis of multiple antibiotic classes in milk.
This study used a modified QuEChERS sample preparation method that was simple and demonstrated good recoveries for the majority of the antibiotic classes investigated.
The method facilitated the identification and quantification of target compounds in low ppb range (0.1 to 1 ppb) in milk while demonstrating good retention time stability and precision.
Long term stability data confirmed that an LC/MS/MS system is capable of analysis of samples with dirty matrices without any maintenance downtime.
References
- US FDA/CFSAN Tolerance and /or Safe Levels of Animal Drug Residues in Milk; memo dated Sep 27, 2005.
- S. B. Clark, J. M. Storey, S. B. Turnipseed, FDA Laboratory Information Bulletin, Lib # 4443, https://www.fda.gov/food/laboratory-methods-food/laboratory-information-bulletin-lib-4422-melamine-and-cyanuric-acid-residues-foods
- L. Geis-Asteggiante, S. J. Lehotay, A. R.Lightfield, T. Dutko, C. Ng, L. Bluhm, J. Chrom. A, 2012, 1258, 43.
- T. Yamaguchi, M. Okihashi, K. Harada, K. Uchida, Y. Konishi, K. Kajimura, K. Hirata, Y. Yamamato, J. Agri. Food Chem., 2015, 63, 5133.
- European Commission Guidance Document on Analytical Quality Control and Validation Procedures for Residues Analysis in food and feed, SANCO12571(2013), https://food.ec.europa.eu/index_en
Acknowledgments
Produced from materials originally authored by Avinash Dalmia from PerkinElmer, Inc.

This information has been sourced, reviewed and adapted from materials provided by PerkinElmer Food Safety and Quality.
For more information on this source, please visit PerkinElmer Food Safety and Quality.