Bees that solely collect nectar from the Manuka plant growing throughout New Zealand produce Manuka honey, a premium product.1 Its popularity is down to the large variety of health benefits it supplies, from aiding the healing of wounds and burns to soothing the symptoms of a common cold.2
Using its Unique Manuka Factor (UMF), which indicates the level of antibacterial activity present in each batch, Manuka honey can be classified.3 Only 1,700 tons of Manuka honey are produced in New Zealand each year, but over 10,000 tons of honey are labeled as Manuka are sold globally.
With extensive health benefits being claimed and prices reaching £90 a jar, adulterated and fraudulent Manuka honey poses a serious threat to consumers.4 Therefore, it is vital that a reliable and accurate adulteration detection technique is available for manufacturers to routinely test their Manuka honey.
Corn, beet and rice syrups are common adulterants found in Manuka honey. The different photosynthetic pathways in the plants utilized to produce these adulterants mean that different methods are needed to detect them.5
For example, measuring the 13C/12C isotope ratio is the official method to detect corn syrup in honey, but this technique does not detect rice or beet syrup.6
On the other hand, mid-Infrared spectroscopy with Adulterant Screen™ technology can supply fast detection of all three adulterants without the requirement for solvents or time-consuming sample preparation.
Existing targeted methods for adulterant screening by utilizing Mid-infrared spectroscopy require a quantitative calibration to be developed for each potential adulterant.
Yet, non-targeted screening methods like a SIMCA (Soft Independent Modelling of Class Analogy) algorithm can establish whether a sample has been adulterated, but it will neither quantify nor identify the adulterant.
Conversely, PerkinElmer’s Adulterant Screen supplies a semi-targeted technique that enables the quick identification and estimation of adulteration levels.
Experimental MIR spectra of pure Manuka honey and corn, beet and rice syrups were gathered by utilizing a PerkinElmer Spectrum Two™ FT-IR spectrometer with the PerkinElmer Universal Attenuated Total Reflectance (UATR) accessory, using the parameters seen in Table 1.
Table 1. Scanning parameters for the analysis of Manuka honey and adulterant syrups. Source: PerkinElmer Food Safety and Quality
| Scanning Parameters |
| Spectral Range |
4,000 – 450 cm-1 |
| Resolution |
8 cm-1 |
| Number of Scans |
32 |
To lower the viscosity of the honey, the samples were warmed in a hot water bath before analysis for one minute.3
One spectrum of each adulterant (corn syrup, beet syrup and rice syrup) and six spectra of pure Manuka honey (six replicates from six different commercially available products with differing UMF values) were gathered for the Adulterant Screen technique.
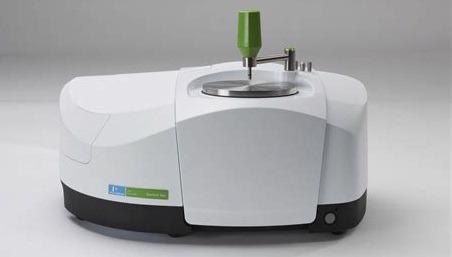
Figure 1. PerkinElmer Spectrum Two with Universal Attenuated Total Reflectance accessory. Image Credit: PerkinElmer Food Safety and Quality
As seen in Figure 2, the spectra were pre-processed by utilizing a first derivative baseline correction.
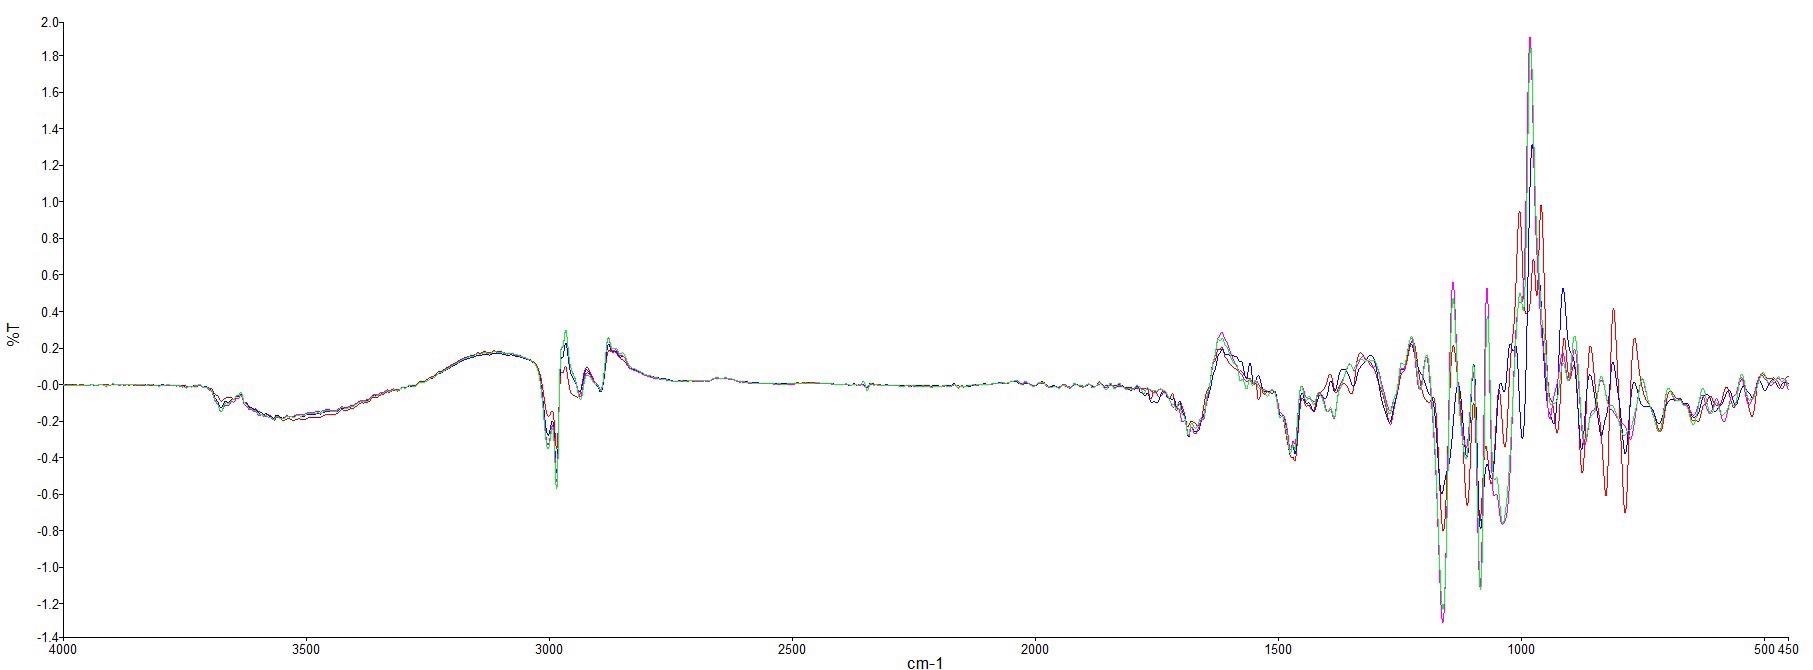
Figure 2. First derivative spectra of pure Manuka honey (red) and adulterant syrups (beet syrup (blue), corn syrup (pink) and rice syrup (green)). Image Credit: PerkinElmer Food Safety and Quality
Furthermore, 16 pure Manuka honey samples were spiked with each of the adulterant syrups across a variety of concentrations from 5-90 % (w/w).
Using PerkinElmer Spectrum Quant™, Spectra of 100 % Manuka honey, each adulterated sample and 100 % adulterant were employed to produce quantitative Partial Least Squares (PLS1) models for each of the adulterant syrups.
For calibration, 12 samples were used, and for independent validation of the model, six samples (25 %, 55 % and 85 %, including Manuka honey with 5+, 10+ and 15+ UMFs) were used.
For each of the models, cross-validation was also performed using the Leave-1-Out method. All spectra were pre-processed using MSC normalization and first derivative baseline correction with light noise reduction.
Adulterant Screen
An Adulterant Screen technique was created for identifying and semi-quantitatively estimating the level of adulterant in Manuka honey. As there is no need for lengthy sample preparation and measurement of calibration standards, adulterant Screen is beneficial.
The user must simply create a library of unadulterated material spectra with as much natural variation as possible, like samples from different suppliers or batches. Next, single scans of each adulterant must be gathered in an adulterant library, which can be continually added to when required.
The spectra of each of the three adulterant syrups were entered as ‘adulterant spectra’, and all 36 spectra of pure Manuka honey were inputted as ‘material spectra’. The technique was tested utilizing Manuka honey samples spiked with known levels of each adulterant, and the results can be seen in Table 2.
Table 2. Adulterant Screen results for a series of adulterated Manuka honey samples. Source: PerkinElmer Food Safety and Quality
| Sample Name |
Predicted Level (%) |
Detection Limit (%) |
Adulterant Screen Pass/Fail |
| Beet Syrup (20 %) |
20.18 |
0.40 |
Fail |
| Beet Syrup (10 %) |
10.07 |
Fail |
| Beet Syrup (5 %) |
3.82 |
Fail |
| Corn Syrup (20 %) |
21.32 |
1.12 |
Fail |
| Corn Syrup (10 %) |
13.67 |
Fail |
| Corn Syrup (5 %) |
5.96 |
Fail |
| Rice Syrup (20 %) |
20.18 |
1.52 |
Fail |
| Rice Syrup (10 %) |
9.51 |
Fail |
| Rice Syrup (5 %) |
2.70 |
Fail |
| Manuka Honey (100 %) |
- |
- |
Pass |
A “Fail” result was produced by the Adulterant Screen technique in all cases. The algorithm identified the adulterant syrup correctly and supplied an estimate of the level present in each sample. Samples of each of the pure Manuka honey were also measured, which all produced a “Pass” result.
For each of the adulterant syrups, the detection limits are relatively low. Economically motivated adulteration tends to be carried out at a higher level in order to profit from it even though more expensive analytical techniques can provide lower detection limits.
Adulterant Screen techniques can also be incorporated into the Spectrum Touch™ software to supply a user-friendly interface for utilization by routine operators.
The simple design of the workflow is demonstrated in Figure 3 as it correctly identifies the adulterant syrup present. More detailed results are also given, indicating the estimated levels of adulterants shown as a decimal.
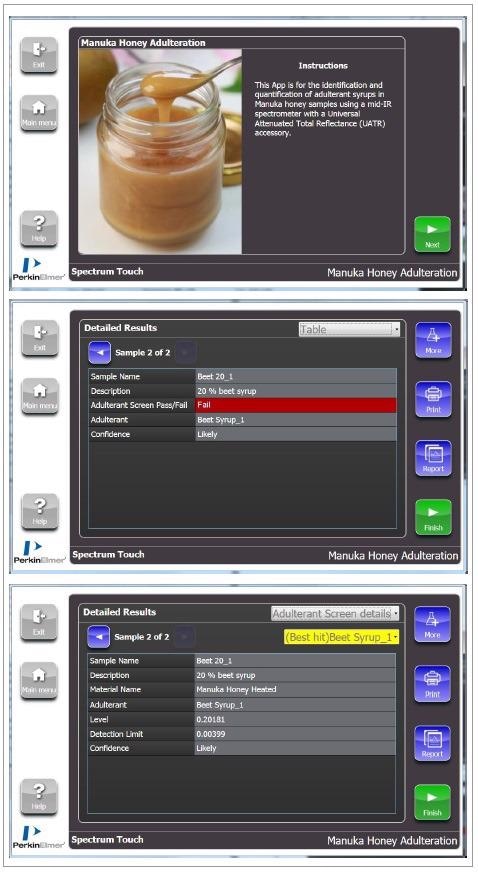
Figure 3. Example of Spectrum Touch Workflow and Adulterant Screen results for Manuka honey adulteration. Image Credit: PerkinElmer Food Safety and Quality
PLS1 Calibration Models
For each of the adulterant syrups, a PLS1 calibration model was also created. Table 3 exhibits the regression data for all the calibration models. The R2 values were all above 99.9 %, indicating a very high level of correlation between the concentration predicted by the model and the specified concentration of adulterant syrup.
Table 3. Regression summary for adulterant syrup models (where SEC is standard error of calibration, SEP is standard error of prediction and CVSEP is cross validation standard error of prediction). Source: PerkinElmer Food Safety and Quality
| Adulterant Syrup |
Number of PCs |
R2 (%) |
SEC (%) |
SEP (%) |
CVSEP (%) |
| Beet |
1 |
99.902 |
1.122 |
1.143 |
1.217 |
| Corn |
2 |
99.949 |
0.855 |
0.971 |
1.269 |
| Rice |
2 |
99.934 |
0.969 |
1.020 |
1.339 |
Table 4 shows the average independent validation results for each of the models and the standard error of prediction (SEP) is relatively low for each of them, which demonstrates that they have good prediction capabilities.
Table 4. Independent validation results from adulterant syrup models. Source: PerkinElmer Food Safety and Quality
| Adulterant Syrup |
Average True Sample Property Value (%) |
Average Predicted Sample Property Value (%) |
SEP (%) |
| Beet |
52.50 |
52.91 |
1.397 |
| Corn |
52.50 |
51.04 |
2.231 |
| Rice |
52.50 |
50.64 |
2.719 |
The results demonstrate that PLS1 calibration models are sensitive in predicting adulteration levels in Manuka honey. Yet, as many calibration standards must be prepared, this technique is very time-consuming, covering all possible adulterant syrups in addition to a range of UMF values and batches.
Conclusion
The results demonstrate that Mid-infrared spectroscopy with Adulterant Screen technology can supply a fast screening method for the detection and identification of adulterant syrups in Manuka honey.
The PLS1 calibration models supplied accurate predictions for the level of adulteration present, but they needed time-consuming sample measurement and preparation.
On the other hand, adulterant Screen quickly identifies and supplies a relatively accurate estimate of the level of adulterant present in the sample, without the requirement for calibration samples.
Only one spectrum must be added to the ‘adulterant library’ if a new adulterant should arise. Therefore, adulterant Screen is a more suitable technique for routine checks for the detection of adulterant syrups in Manuka honey.
References
- Manuka honey, Ministry for Primary Industries, 2018.
- K. Berkheiser, 7 Health Benefits of Manuka Honey, Based on Science, Healthline, 2018.
- K. Karasawa, S. Haraya, S. Okubo and H. Arakawa, Novel assay of antibacterial components in Manuka honey using lucigeninchemiluminescence-HPLC, Analytica Chimica Acta, 2017, 954, 151-158.
- Riddle of how 1,700 tons of Manuka honey are made…but 10,000 are sold, NZ Herald, 2016.
- U. Gowik and P. Westhoff, The Path from C3 to C4 Photosynthesis, Plant Physiology, 2011, 155, 56-63.
- B. Zabrodska and L. Vorlova, Adulteration of honey and available methods for detection – a review, Acta Veterinaria Brno, 2015, 83, 85-102

This information has been sourced, reviewed and adapted from materials provided by PerkinElmer Food Safety and Quality.
For more information on this source, please visit PerkinElmer Food Safety and Quality.