Milk is one of the fundamental food groups in the human diet, both as various dairy products and in its original state.
The 2008 Chinese contaminated baby formula scandal increased awareness amongst the general public regarding the possibility of contamination. This has resulted in close supervision and regulation of dairy products as China is faced with demands – both from home and abroad – to improve its food safety record.
It is well-established that lead (Pb) is toxic, causing damage to the nervous system; it has a particularly harmful effect on young children1 and has been a major concern since the 1970s. As per World Health Organization (WHO) standards, the acceptable limit of lead in drinking water is 10 µg/kg (parts per billion, ppb).
Subsequent to an in-depth review of the toxicological literature, the Chinese regulatory guideline for highest permissible levels of lead content is set at 20 µg/kg (ppb wet weight) in infant formula (use of milk as a raw material measured by fluid milk derived from powdered form, referring to the ready-to-use product) and at 50 µg/kg (ppb) in fresh milk, respectively.2
Traditionally, lead analysis has been one of the primary applications of graphite furnace atomic absorption spectrometry (GFAAS) globally.
Presently, the Chinese regulatory framework approved standard method for lead analysis has determined that GFAAS is the appropriate technique for the mandatory arbitration in food testing.3
To ensure consumer protection, analysis should be sensitive, efficient and inexpensive so that increasingly effective monitoring can be achieved. Since GFAAS is a mature technique, it is well-known and routinely used by technicians, rendering it suitable for this determination. Sample preparation is a key part of an analysis, and yet, it can also be time consuming.
Typically, milk can be identified as an emulsion or colloid of butterfat globules within a water-based fluid. The components of raw milk are distinctly different from species to species, but it generally contains significant amounts of lactose, protein fat and minerals, as well as vitamins.
Due to the comparative interference that results from such a complex matrix, total decomposition of milk samples prior to instrumental measurement by heating block acid digestion or microwave is usually recommended.
However, this approach is a lot more time-consuming and poses a strict regulatory requirement on quality assurance. Thus, when simple dilution takes place with lead concentrations that are identified at μg/kg level in the final solution, it may be extremely sensitive to environmental contamination and reagent blank contribution.
To bypass these issues, this study details a simple and direct dilution method for sample preparation, followed by an automated analysis using GFAAS.
This method significantly reduces sample preparation and minimizes the risk of contamination while still preserving the speed of analysis.
Experimental Conditions
Instrumentation
A PerkinElmer® PinAAcle™ 900T flame and longitudinal Zeeman atomic absorption spectrometer (Figure 1) was used for GFAAS measurements of lead (Pb) in various milk samples.
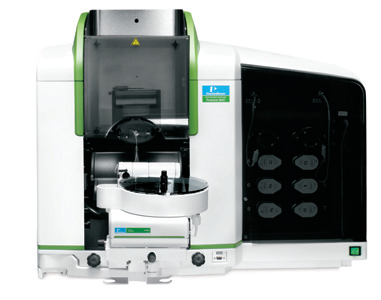
Figure 1. PinAAcle 900T atomic absorption spectrometer with AS 900 furnace autosampler. Image Credit: PerkinElmer Food Safety and Quality
The PinAAcle 900T spectrometer’s transversely heated graphite atomizer (THGA) with Longitudinal AC Zeeman background correction supplies a consistently uniform temperature distribution across the whole length of the graphite tube.
This enables the full integration of the Stabilized Temperature Platform Furnace™ (STPF) technique in graphite furnace analysis where it is possible to analyze complex sample matrices utilizing standard aqueous solutions as calibration for suspended sample solutions to obtain precise and accurate results.
Maximum atomic signals can be obtained with minimal memory effect and potential interference
The spectrometer was fitted with an AS 900 autosampler and the light source used was the PerkinElmer Lumina™ single-element Pb hollow cathode lamp (Part No. N3050157).
A conventional THGA tube (Part No. B0504033) was used in combination with 1.2 mL polypropylene autosampler cups (Part No. B0510397) for all measurements. The instrument was controlled by WinLab32™ for AA software running under Microsoft® Windows® 7 operating system. A synopsis of the PinAAcle 900T instrument settings is detailed in Table 1.
Table 1. Instrument settings for the PinAAcle 900T spectrometer. Source: PerkinElmer Food Safety and Quality
| Parameter |
Value |
| Wavelength |
283.3 nm |
| Slit Width |
0.7 nm |
| Lamp Current |
10 mA |
| Signal Measurement |
Peak Area |
| Measurement Type |
AA-BG |
| Integration Time |
5 s |
| Replicates |
3 |
| Calibration Standard |
4, 10, 15, 20 μg/L |
| Sample Volume |
16 μL |
Sampling
A total of 15 samples derived from six different dairy products were evaluated in this study, representing all the major types of milk available commercially in China, including whole milk, low-fat milk, children’s milk, milk powder, skimmed milk powder and yogurt.
All the samples were extracted from the original packaging and placed in a clean, sealed polyethylene bag, then labeled and transferred to the laboratory for refrigeration until analysis.
Sample Preparation
Ultrapure deionized (DI) water from a MiliQ-Element system (Millipore®, Milford, MA, USA) was used throughout for the preparation of all solutions. Concentrated nitric acid (69-70%), HNO3, hydrogen peroxide (30%) and H2O2, were trace-metal grade or better (Jingrui Chemical Co., Ltd., Jiangsu, China).
Metal-free polypropylene vials and pipette tips were cleaned before analysis with diluted nitric acid (~5% HNO3) and then completely rinsed with DI water prior to being used.
To ensure GFAAS analysis, a solution comprised of 0.5% HNO3 with 0.1% Triton X-100 (Part No. N9300260), a non-ionic detergent, was prepared each day as both a diluent and as a blank.
A 1g sample of liquid milk or solid milk powder was weighed out precisely and transferred to a 15 mL conical polypropylene tube (Part No. B0193233) which was then diluted to a volume of 10 mL and vigorously shaken for several minutes to guarantee homogeneity.
The suspension solution acquired was immediately ready for GFAAS measurement with the autosampler.
These suspensions remained stable for more than 2 days. Even the full fat milk power, which typically presents more challenges when prepared by this rapid dilute-and-shoot procedure, proved to be stable enough for this duration. This is sufficient for the inter-day variability check.
The same procedure was conducted to prepare the blanks, and all the samples were routinely prepared in duplicate, unless stated otherwise.
In the case of skimmed-milk powders and fortified infant formula whose characteristics and protein content are modified by the manufacturing process, or in the case of any milk powder with a higher protein content, the addition of nitric acid will result in coagulation of the dissolution, leading to an inhomogeneous suspension.
In these cases, the milk-powder samples can be dispersed in 0.2 to 0.5% Triton X-100 solution.
Following this, a short 10-minute sonication helps to disperse the milk powder across a more homogeneous solution that remains stable for several hours, sufficient for graphite furnace analysis.
For confirmation by ICP-MS determination, a Multiwave™ 3000 high-pressure microwave digestion system (PerkinElmer, Inc., Shelton, CT) was used to decompose the milk sample matrix completely using an acid mixture of HNO3 and H2O2.
Calibration
All reagents utilized for the study must be of ultra-pure grade as the concentration of Pb in milk samples is typically very low. It is advisable to use Single-Element PerkinElmer Pure Plus Grade Standards (Part No. N9303748, lead in 2% HNO3) and Matrix Modifiers (Part No. B0190635, 10% Pd as nitrate and Part No. B0190634, 1% Mg as nitrate).
Calibration curves were assembled using the AS 900 autosampler’s online auto-dilution of a working stock lead standard solution of 20 µg/kg (ppb).
Method Validation
The procedure performance was assessed by spike recovery using GFAAS measurement and the assessment of the Standard Reference Materials (SRMs) from National Institute of Standards and Technology (NIST®), NIST® 1549 Non-Fat Milk Powder, and China National Institute of Metrology (NIM), GBW08509a Skimmed Milk Powder.
These two-commercial lyophilized SRMs were treated as any dairy product sample. Additionally, the results were compared to those obtained by the traditional mineralization-based procedures, followed by an evaluation using the NexION® 300X ICP-MS (PerkinElmer, Inc., Shelton, CT).
Total mineralization was conducted using the Multiwave 3000 microwave digestion system. Instrumental operating parameters for the ICP-MS measurements were guided by well-established, routine protocols.
Results and Discussion
The temperature program for lead analysis is optimized to offer complete matrix decomposition without experiencing analyte loss. The furnace temperature program is detailed in Table 2.
Table 2. Furnace temperature program for the direct measurement of lead in milk samples using the PinAAcle 900T spectrometer with THGA tubes. Source: PerkinElmer Food Safety and Quality
| Step |
|
Temp.
(˚C) |
Ramp
Time (sec) |
Hold
Time (sec) |
Internal
Flow |
Read
Step |
Gas
Type |
| 1 |
Drying |
130 |
5 |
30 |
250 |
|
Normal |
| 2 |
Drying |
150 |
15 |
30 |
250 |
|
Normal |
| 3 |
Drying |
450 |
15 |
15 |
50 |
|
Dried Air |
| 4 |
Pyrolysis |
600 |
10 |
20 |
250 |
|
Normal |
| 5 |
Atomization |
1600 |
0 |
3 |
0 |
X |
Normal |
| 6 |
Clean-out |
2500 |
1 |
5 |
250 |
|
Normal |
Due to the sample matrix’s complex features, it is recommended that an additional drying step is conducted by applying a special gas of dry compressed air. This step eliminates any carbonaceous residues that remain after analyzing more than 50 samples in one single batch.
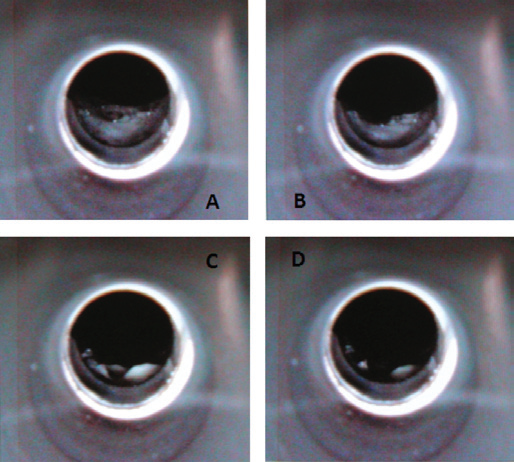
Figure 2. The drying steps of a complex undigested milk sample in the graphite tube, as seen using the TubeView color furnace camera. Image Credit: PerkinElmer Food Safety and Quality
The PinAAcle 900T spectrometer’s TubeView™ color furnace camera provides a significant benefit when checking the tip’s position in the furnace in relation to the platform, which offers the advantage of optimizing the drying and pyrolysis steps for the complex undigested milk matrix to make sure no sample boiling or splattering occurred (Figure 2 – Page 4).
Therefore, it facilitated easier, faster furnace (temperature) method development.
For Pb discovery, complete mineralization of the milk components is not a requirement when using the proven and established STPF technique in combination with the patented THGA design, which significantly reducing matrix interferences by ensuring uniform and consistent heating and high atomization efficiency.
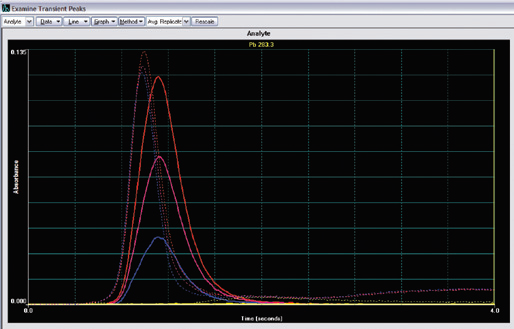
Figure 3. Overlay of typical lead atomic and background signal for the control material of skimmed milk powder. The solid blue line is from the control material of skimmed milk powder, the solid purple line is from the spiked control material, and the solid red line is from the standard at a concentration of 25 μg/kg, while the solid yellow line at the bottom is the reagent blank signal. Dashed lines represent the background absorption profiles. Image Credit: PerkinElmer Food Safety and Quality
All data was calculated from 3 replicate readings for each solution using peak-area (integrated absorbance) integration. Figure 3 shows the overlay of the general peak profiles of the different solutions.
One distinctive benefit of the STPF technique is demonstrated clearly here: even though the peaks may not appear simultaneously, the peak-area calculation still consistently offers accurate results.
To test the method’s accuracy, the presence of Pb was assessed in the control material of non-fat milk powder from NIST® 1549 and the skimmed milk powder from NIM GBW08509a.
The high degree of accuracy of the direct method is exhibited by the correlation of the results acquired in the analysis of the two SRMs with the certified values, as demonstrated in Table 3.
Table 3. Results for the direct measurement of NIST® 1549 and GBW08509a by GFAAS (all in μg/kg). Source: PerkinElmer Food Safety and Quality
| Sample |
Certified
Value |
Spike
Level |
Expected
Mean |
Found
Mean |
Recovery
(%) |
| NIST® 1549 |
19 ±3 |
0 |
19 |
19 |
101 |
| GBW08509a |
24 ±6 |
0 |
24 |
23 |
95 |
| GBW08509a |
24 ±6 |
12 |
36 |
35 |
96 |
| GBW08509a |
24 ±6 |
24 |
48 |
48 |
99 |
| GBW08509a |
24 ±6 |
48 |
72 |
71 |
98 |
An estimation of analyte recovery was also acquired by spiking one of the SRM samples (GBW08509a) at the 50, 100 and 200% levels with the Pb single-element standard working stock solution, and the data, also collected in Table 3, shows quantitative recovery.
Method detection limits (MDLs) are calculated by dividing 3 times the standard deviation (SD) of the absorbance readings of the reagent blanks by the sensitivity.
These MDLs are specified as the analyte concentration in micrograms per kilogram (ppb) of dairy products which delivers an absorbance reading that differs statistically from that of the blank. A standout characteristic of this method, which utilizes a sample volume at 16 µL with 10-fold dilution factor, supplies the MDL of 0.25 µg/kg (ppb).
Thus, the MDL measured in the initial dairy products is approximately two orders of magnitude less than the expected level in the regular control materials (around 20 µg/kg). It signifies that this method could be appropriate for identifying the presence of Pb in dairy products.
For further independent comparative data against GFAAS analysis utilizing this simple method, all dairy products collected were mineralized by traditional microwave total acid digestion, then assessed for lead by ICP-MS. Table 4 (Page 5) displays the concentrations of Pb observed in each dairy product sample.
Table 4. Lead levels in commercially available dairy products were determined by direct GFAAS analysis and conventional ICP-MS measurement (values are means ± SD, all in μg/kg). Source: PerkinElmer Food Safety and Quality
| No. |
SRMs/Samples |
Certified
Value |
Measured Results |
| GFAAS |
ICP-MS |
| 1 |
GBW08509a
(Skimmed milk powder) |
24 ±6 |
23.3 ±0.7 |
23.9 ±1.7 |
| 2 |
GBW10017
(Milk powder) |
70 ±20 |
23.9 ±2.7 |
25.7 ±8.7 |
| 3 |
NIST® 1549
(Non-fat milk powder) |
19 ±3 |
19.1 ±1.3 |
19.3 ±6.5 |
| 4 |
Milk powder |
– |
40.2 ±1.8 |
42.1 ±1.9 |
| 5 |
Skimmed milk powder |
– |
25.7 ±1.3 |
23.3 ±6.1 |
| 6 |
Whole milk (Brand 1) |
– |
4.46 ±0.32 |
4.57 ±0.60 |
| 7 |
Whole milk (Brand 2) |
– |
2.75 ±0.07 |
2.73 ±0.09 |
| 8 |
Whole milk (Brand 3) |
– |
6.13 ±0.07 |
6.78 ±0.49 |
| 9 |
Whole milk (Brand 4) |
– |
5.65 ±0.11 |
5.85 ±0.37 |
| 10 |
Low-fat milk (Brand 1) |
– |
2.34 ±0.09 |
2.39 ±0.38 |
| 11 |
Low-fat milk (Brand 2) |
– |
0.53 ±0.02 |
0.58 ±0.21 |
| 12 |
Drinkable children’s
milk (Brand 1) |
– |
1.70 ±0.09 |
1.73 ±0.22 |
| 13 |
Drinkable children’s
milk (Brand 2) |
– |
0.22 ±0.01 |
0.54 ±0.15 |
| 14 |
Drinkable yogurt (Brand 1) |
– |
1.89 ±0.16 |
2.02 ±0.18 |
| 15 |
Drinkable yogurt (Brand 2) |
– |
1.36 ±0.02 |
1.61 ±0.33 |
It is crucial to highlight the fact that there are no considerable differences between the two independent testing methods, which further indicates the accuracy of the methods overall. However, the relative standard deviation (RSD) was typically higher for data acquired by ICP-MS analysis after standard mineralization.
This is probably caused by the dilution used in the ICP-MS sample preparation being introduced during the digestion step. Even though the ICP-MS technique demonstrates greater sensitivity than GFAAS, the dilution of the unusually low levels of Pb present in the samples introduces further uncertainty.
Based on the results, it is clear that the total digestion of matrix components is not required with all types of dairy-product samples, and it is faster and more economical to run the samples with limited preparation.
As demonstrated in Table 4, one of the tested SRMs found in this study is the Pb concentration as issued by State General Administration of the People's Republic of China for Quality Supervision and Inspection and Quarantine (AQSIQ), GBW10017 milk powder, is 23.9 ±2.7 μg/kg by direct GFAAS method and 25.7 ±8.7 μg/kg by the complete digested ICP-MS method, which are both considerably lower than the certified value (70 ±20 μg/kg).
Other laboratories have also observed this difference since purchasing this reference material. Based on the higher value of standard deviation (20 μg/kg, 29% of error), the actual certified Pb result in this GBW10017 SRM arising from AQSIQ has yet to be established and requires further investigation.
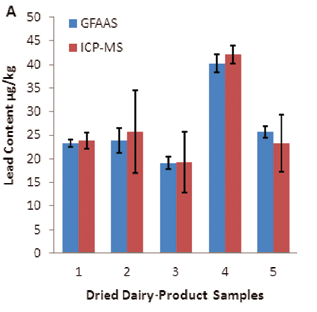
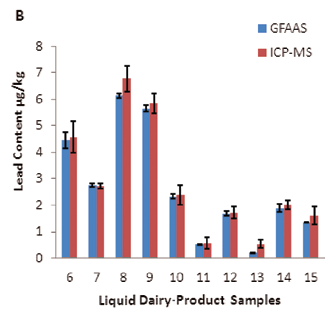
Figure 4. Comparison of lead levels in different dairy-product samples obtained by two independent test methods: A) dried milk powder samples; B) liquid milk samples. Image Credit: PerkinElmer Food Safety and Quality
For an intuitive and illustrative comparison, the variations in Pb concentration and analytical precision are also exhibited in Figure 4 as a plot with an error bar.
Our results clearly establish the significant benefits of easy handling and precise analysis that come with using direct determination of Pb concentration by GFAAS, as the need to measure Pb at such a low level (in μg/kg range) in the original dairy product samples necessitates close control of reagents, environment and processes.
This can be extremely challenging, even for experienced professionals. This is a result of the large dilution factor if experiencing the time-consuming and labor-burdened total digestion procedure, taking the poor match of experimental value in combination with the certified value in the SRMs of GBW10017 as further proof.
Conclusions
In conclusion, a method that involves easy-to-use sample dilution and automated PinAAcle 900T GFAAS detection can be applied for the successful and accurate measurement of Pb in various dairy products.
Reduced sample handling significantly reduces the potential for losses or contamination. The cutting edge THGA minimizes the risk of chemical interferences, which presents a method detection limit well within the normal range of Pb that may be encountered.
This method should also be considered for the analysis of samples with the equivalent fat content and complex matrices. ICP-MS delivers multi-element analysis and extreme sensitivity.
However, due to the high initial investment and expense of ownership, in contrast to GFAAS, the THGA technique may not be the best choice for a simple single-element analysis.
GFAAS delivers not only excellent selectivity, sensitivity and simple operational use, but also high tolerance to complex matrices.
When paired with simple sample preparation, it is clearly the more appropriate choice for the trace level determination of a few toxic elements in dairy products as a standard monitoring technique that protects human health.
References
- Hilary Arnold Godwin, 2001. The biological chemistry of lead. Current opinion in chemical biology 5, 223-227.
- GB2762-2005 Maximum levels of contaminants in foods. China National standard.
- GB5009.12-2010 Determination of lead in foods. China National food safety standard.

This information has been sourced, reviewed and adapted from materials provided by PerkinElmer Food Safety and Quality.
For more information on this source, please visit PerkinElmer Food Safety and Quality.