Lead (Pb) and cadmium (Cd) are extremely toxic pollutants that are found in grains. Even at trace levels, Pb is harmful to human organs, and once it collects in the body, it impedes hemoglobin formation and can lead to neurological disorders.1
Cd is even classified as human carcinogen [Group 1 – according to International Agency for Research on Cancer].2
Reportedly, Cd causes severe kidney problems which can be fatal,3 and is also associated with liver problems and brittle bones.
Being the most widely consumed cereal grain in Asia/China, Rice can quickly pick up Pb and Cd from toxins, pesticides, and fertilizers in the soil, thereby jeopardizing the health of millions of people through their diet. Therefore, it is of utmost importance to develop a simple, reliable method for controlling Pb and Cd levels in rice.
According to Chinese national standard GB 2715-2016 Hygienic Standard for Grain, the maximum concentrations of Pb or Cd allowed in grains must be lower than 0.2 mg/kg; the permissible level in the European Union is the same [EC 1881/2006].
The official technique for the identification of heavy metals in both cases utilizes graphite furnace atomic absorption spectroscopy (GFAAS, GB/T 5009. 12-2017, GB/T 5009-2017. 15 and EN 14083:2003).
Samples can be pretreated through a variety of methods, including microwave digestion, hot block digestion, dry ashing, and hot plate digestion. It has been discovered that these traditional digestion procedures are complicated and time-consuming (two-four hours or even longer).
Moreover, traditional sample preparation techniques demand large quantities of corrosive and oxidizing reagents, intensifying the chance for contamination which could produce inaccurate results.
For microwave digestion, special PTFE vessels are required, however, reusable utensils might also result in cross-contamination. The pretreatment method used during this experiment is ‘fast digestion’, an augmented version of hot block digestion.
In contrast to the aforementioned digestions, fast digestion streamlines the pretreatment process only using polypropylene tubes and nitric acid being (Table 1). Throughout this study, a fast, precise method for trace-level analysis of Pb and Cd in rice grains is determined and verified by harnessing fast digestion with GFAAS.
Table 1. Various sample digestion techniques; reagents volume based on 0.2 - 0.5 gram sample. Source: PerkinElmer Food Safety and Quality
Digestion
Method |
Reagent |
Time
(h) |
Vessel |
| Microwave |
5 mL HNO3,
2 mL H2O2 |
1-2 |
Reusable PTFE vessel and volumetric flask |
| Wet |
10 mL HNO3,
0.5 mL HClO4 |
4-5 |
Reusable beakers and volumetric flask |
| Fast |
1.5 mL HNO3 |
0.5 |
Disposable volumetric tubes |
Experimental Conditions
Instrumentation
The measurements were conducted using a PerkinElmer PinAAcle 900T atomic absorption (AA) spectrometer (PerkinElmer Inc., Shelton, CT, USA), fitted with the intuitive Syngistix™ AA software for simple data reporting sample analysis, and results archiving - a PinAAcle 900Z can also be used.
The PinAAcle 900T is fitted with the TubeView™ furnace camera, developed for coordinating the autosampler tip in the graphite tube and observing residue buildup during sample analysis. The PinAAcle 900T is also fitted with a state-of-the-art longitudinal Zeeman furnace for precise background correction.
The novel design of the transversely heated graphite atomizer (THGA) offers uniform temperature distribution across the whole length of the graphite tube. This is contrary to longitudinal-heating where only certain regions in the tube experience uniform heating.
THGA also facilitates a faster heating process in the graphite tube. Furthermore, THGA has demonstrated the capacity to eliminate memory effects and potential interferences that may happen with high-matrix sample analyses, leading to extremely accurate results.
Sample Preparation
For precision rice analysis, microwave digestion, pressure digestion, and wet digestion are commonly used sample preparation methods.
Table 1 displays the reagents, quantities, time and vessel type utilized in these sample preparation techniques, as well as in fast digestion. As demonstrated in Table 1, only 1.5 mL of nitric acid is essential for fast digestion; the pretreatment occurs in disposable plastic vials, which also in effect minimizes potential contamination.
Using lower reagent volumes facilitates fast digestion and reduced costs in comparison to traditional techniques. Sample preparation can be accomplished within 0.5 hours by a fast digestion method.
In a basic fast digestion cycle, around 0.5 g of each sample was precisely weighed out in duplicate amounts and transferred to 50 mL polypropylene autosampler tubes for fast digestion.
Following these steps, 1.5 mL concentrated nitric acid was added, and the loosely capped vial was subsequently heated in the sample preparation block digestion system (SPB series, PerkinElmer) for 30 minutes at 120 °C. The digested samples were brought up to 25 mL via dilution with DI water.
Three samples (Samples A, B and C) from proficiency tests in the Shanghai area were observed in this experiment.
Table 2. Instrumental conditions for analyzing Pb and Cd in rice grains on the PinAAcle 900T spectrometer. Source: PerkinElmer Food Safety and Quality
| Parameter |
Lead (Pb) |
Cadmium (Cd) |
| Wavelength (nm) |
283.31 |
228.80 |
| Slit Width (nm) |
0.7 |
0.7 |
| Lamp Type* |
EDL |
EDL |
| Measurement Type |
Peak Area |
Peak Area |
| Read Time (sec) |
4 |
4 |
| Sample Volume (μL) |
16 |
16 |
| Diluent Volume (μL) |
16 |
16 |
| Matrix Modifier |
0.05% Pd |
0.05% Pd |
| Matrix Modifier Volume (μL) |
5 |
5 |
| Calibration Equation |
Standard Addition |
Standard Addition |
| Standard Concentration (μg/L) |
0, 12.5, 25, 37.5 |
0, 1.25, 2.5, 3.75 |
*EDL was used for better detection limits and sensitivity.
The certified reference material (CRM) NIST 1568 was also evaluated to qualify the digestion and analysis methods. Each sample was exposed to three replicates: two by fast digestion and one by conventional wet digestion. Pb and Cd determination in CRM was replicated three times by rapid digestion.
The GFAAS analytical conditions were constant throughout the entire process. The instrumental conditions are presented in Table 2, and the optimized graphite furnace temperature programs are detailed in Tables 3 and 4.
Table 3. Optimized temperature programs for analyzing Pb in rice grains on the PinAAcle 900T spectrometer. Source: PerkinElmer Food Safety and Quality
| Lead (Pb) |
| Temp. (°C) |
Ramp (s) |
Hold (s) |
Internal Gas
Flow (mL/min) |
Gas Type |
| 120 |
5 |
30 |
250 |
Normal |
| 150 |
30 |
30 |
250 |
Normal |
| 700 |
10 |
20 |
250 |
Normal |
| 1800 |
0 |
4 |
0 |
Normal |
| 2500 |
1 |
5 |
250 |
Normal |
Table 4. Optimized temperature programs for analyzing Cd in rice grains on the PinAAcle 900T spectrometer. Source: PerkinElmer Food Safety and Quality
| Cadmium (Cd) |
| Temp. (°C) |
Ramp (s) |
Hold (s) |
Internal Gas
Flow (mL/min) |
Gas Type |
| 120 |
5 |
30 |
250 |
Normal |
| 150 |
30 |
30 |
250 |
Normal |
| 500 |
10 |
20 |
250 |
Normal |
| 1500 |
0 |
4 |
0 |
Normal |
| 2500 |
1 |
5 |
250 |
Normal |
Results and Discussion
The basic addition calibration curves of Pb and Cd are displayed in Figure 1, demonstrating an R2 value ≥ 0.999, showing the linearity of the analysis. All the sample peaks and calibration standards can be seen in Figure 2.
The same peak appearance time and peak shape show that matrix effects were successfully eliminated utilizing the standard addition method.
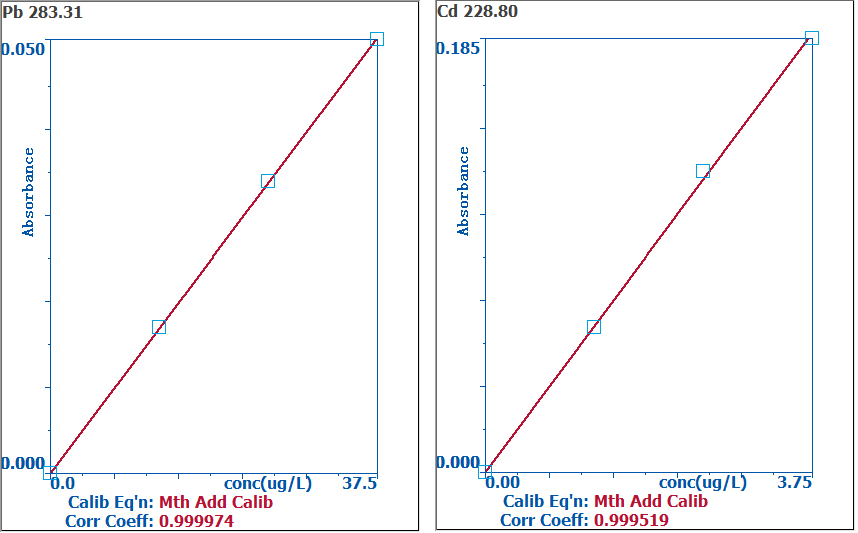
Figure 1. Standard addition curve of Pb (left) and Cd (right) in rice. Image Credit: PerkinElmer Food Safety and Quality
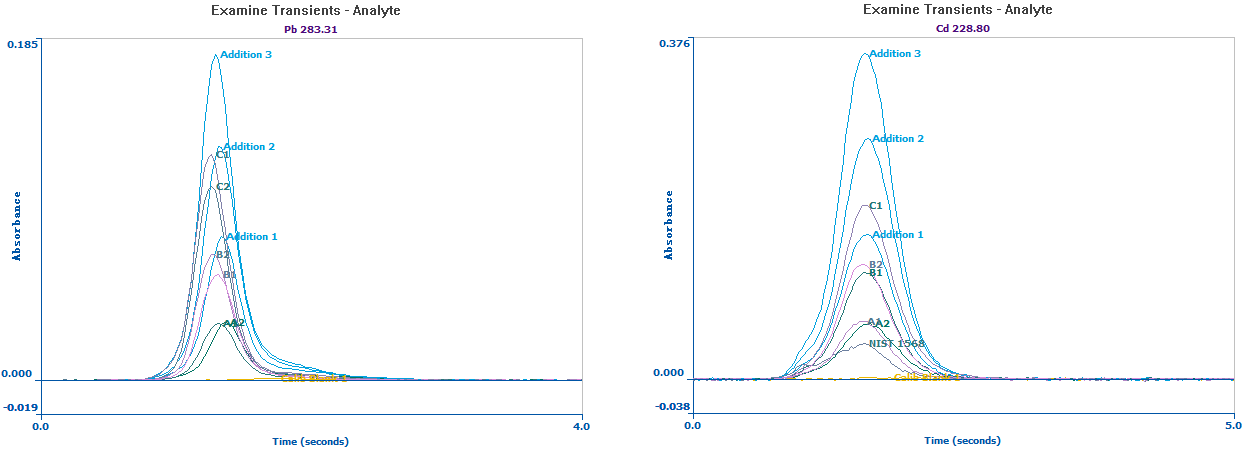
Figure 2. Overlay of Pb (left) and Cd (right) signals in three samples and NIST 1568 and their replicates. Image Credit: PerkinElmer Food Safety and Quality
Table 5. MDLs using the PinAAcle 900T spectrometer. Source: PerkinElmer Food Safety and Quality
| Analyte |
MDL (3σ, μg/kg) |
| Calculated |
Regulated |
| Pb |
5.4 |
20a |
20c |
| Cd |
0.8 |
1.0b |
20c |
(0.5 grams sample diluted to 25 mL; a: regulated in GB 5009.12-2017; b: regulated in GB 5009.15-2014; c: regulated in (EC) No 1881/2006).
Table 6. Analysis of NIST 1568 pretreated by fast digestion on the PinAAcle 900T spectrometer. Source: PerkinElmer Food Safety and Quality
| Analyte |
Certified Value
(mg/kg) |
Measured Value
(mg/kg) |
| Pb |
NA |
NA |
| Cd |
0.029 ± 0.004 |
0.028 |
Method detection limits (MDLs) were calculated (Table 5) and predicated on the standard deviation of 11 replicates of the reagent blank with the dilution factor used in sample preparation accounted for. The MDLs fall short of the regulated levels and showcase the capabilities of the PinAAcle 900T system to measure low concentrations in difficult matrices.
Table 7. Results for the detection of Pb and Cd in rice grains (mg/kg). Source: PerkinElmer Food Safety and Quality
| Sample |
Pb (mg/kg) |
Cd (mg/kg) |
| FD1 |
FD2 |
WD |
Deviation*% |
FD1 |
FD2 |
WD |
Deviation*% |
| A |
0.38 |
0.39 |
0.40 |
3.8 |
0.37 |
0.36 |
0.37 |
1.4 |
| B |
0.82 |
0.81 |
0.81 |
0.6 |
0.71 |
0.71 |
0.71 |
0 |
| C |
1.33 |
1.32 |
1.20 |
9.9 |
1.14 |
1.15 |
1.20 |
4.7 |
*: Deviation (%) =  ×100% , where N1: average of FD1 and FD2; N2: WD; Navg: average of N1 and N2.
The reliability and accuracy of the methodology was determined with the evaluation of NIST 1568. Although Pb was not certified in NIST 1568, the measured value of Cd in CRM is 0.028 µg/L, which is compliant with the limit given by NIST as detailed in Table 6. The results from the assessment of three samples are outlined in Table 7.
For the fast digestions (FD), samples were twice digested and analyzed to assess reproducibility. The samples were also measured by wet digestion (WD), so that the results of the fast digestion could contrast against a traditional sample preparation method.
For each of the three samples and concentration ranges, the results align, signifying the accuracy and reproducibility of the fast digestion method.
The resulting accuracy is in accordance with the requirement in GB 5009.12 and GB 5009.15 (Deviation ≤20%) and compliant with (EC) 333/2007 (HorRatr or HorRatR values of less than 2 –detailed calculation can be found in Reference 4).
Conclusions
Fast digestion and subsequent GFAAS analysis was used for the analysis of Pb and Cd in rice grains. The easy-to-use fast digestion method can effectively reduce sample preparation time and prevent any potential contamination from additional reagent use and reusable vessels.
When used in conjunction with the automated PinAAcle 900T GFAAS to reduce chemical and matrix interferences, precise identification of trace-level Pb and Cd is acquired successfully by the standard addition method.
This application has the potential to be expanded to heavy metal analysis across a wide range of other food types, including corn, cereal grains, flour, beans, and milk powder.
References
- WHO: http://www.who.int/mediacentre/factsheets/fs379/en/
- IARC: https://monographs.iarc.who.int/
- U.S. ATSDR: https://www.atsdr.cdc.gov/csem/csem.asp?csem=6&po=12
- Horwitz W., Albert R., J. AOAC Int. 2006 Jul-Aug; 89(4):1095-109. ‘The Horwitz ratio (HorRat): A useful index of method performance with respect to precision’
Consumables Used
Table 8. Source: PerkinElmer Food Safety and Quality
| Component |
Description |
Part Number |
Sample Preparation
Block |
SPB 50-24, 24-position 50 mL 115/230 V
SPB 50-48, 48-position 50 mL 115/230 V |
N9300802
N9300803 |
| Cd Lamp |
Electrodeless Discharge Lamp (EDL) |
N3050615 |
| Pb Lamp |
Electrodeless Discharge Lamp (EDL) |
N3050657 |
| Graphite Tubes |
THGA Pyrocoated Tubes
with Advanced Platform |
N9307830 (5-pack)
N9307831 (20-pack) |
THGA Pyrocoated Tubes
with Integrated Platform |
B3000641 (5-pack)
B0504033 (20-pack)
N3110147 (100-pack) |
| Cd Standard |
1000 ppm, matrix 2% HNO3 |
N9300176 (125 mL)
N9300107 (500 mL) |
| Pb Standard |
1000 ppm, matrix 2% HNO3 |
N9300175 (125 mL)
N9300128 (500 mL) |
| Modifier Pd (NO3)2 |
1% Pd, 50 mL |
B0190635 |
| Conical Centrifuge Tube |
50 mL - Qty 500 |
B0193234 |

This information has been sourced, reviewed and adapted from materials provided by PerkinElmer Food Safety and Quality.
For more information on this source, please visit PerkinElmer Food Safety and Quality.