Maple syrup is a widely used natural sweetener and is defined by the U.S. Food and Drug Administration (FDA) as a liquid food derived by concentrating and heat-treating sap from the maple tree.1
The main sugar in maple syrup is sucrose, while lesser amounts of fructose, glucose and complex carbohydrates are also present.2 Total sugar content of maple syrup is frequently determined via the amount of sucrose present - the other sugar sources are not considered.2
Maple syrup also includes a range of other components, for example, vitamins, minerals, organic acids, amino acids and phytohormones.3 Its sugar composition differs from that of honey, which is largely made up of fructose and glucose, with smaller concentrations of other sugars such as maltose and sucrose.3
Analysis of simple sugars is typically conducted using high performance liquid chromatography (HPLC). Hydrophilic interaction chromatography (HILIC) is also frequently employed with refractive index (RI) detection. This is due to the polarity of the sugars and the lack of a suitable chromophore for UV detection.
This article outlines a straightforward HILIC-RI method suitable for the analysis of four sugars typically found in maple syrup. Figure 1 displays the structures of these four sugars.
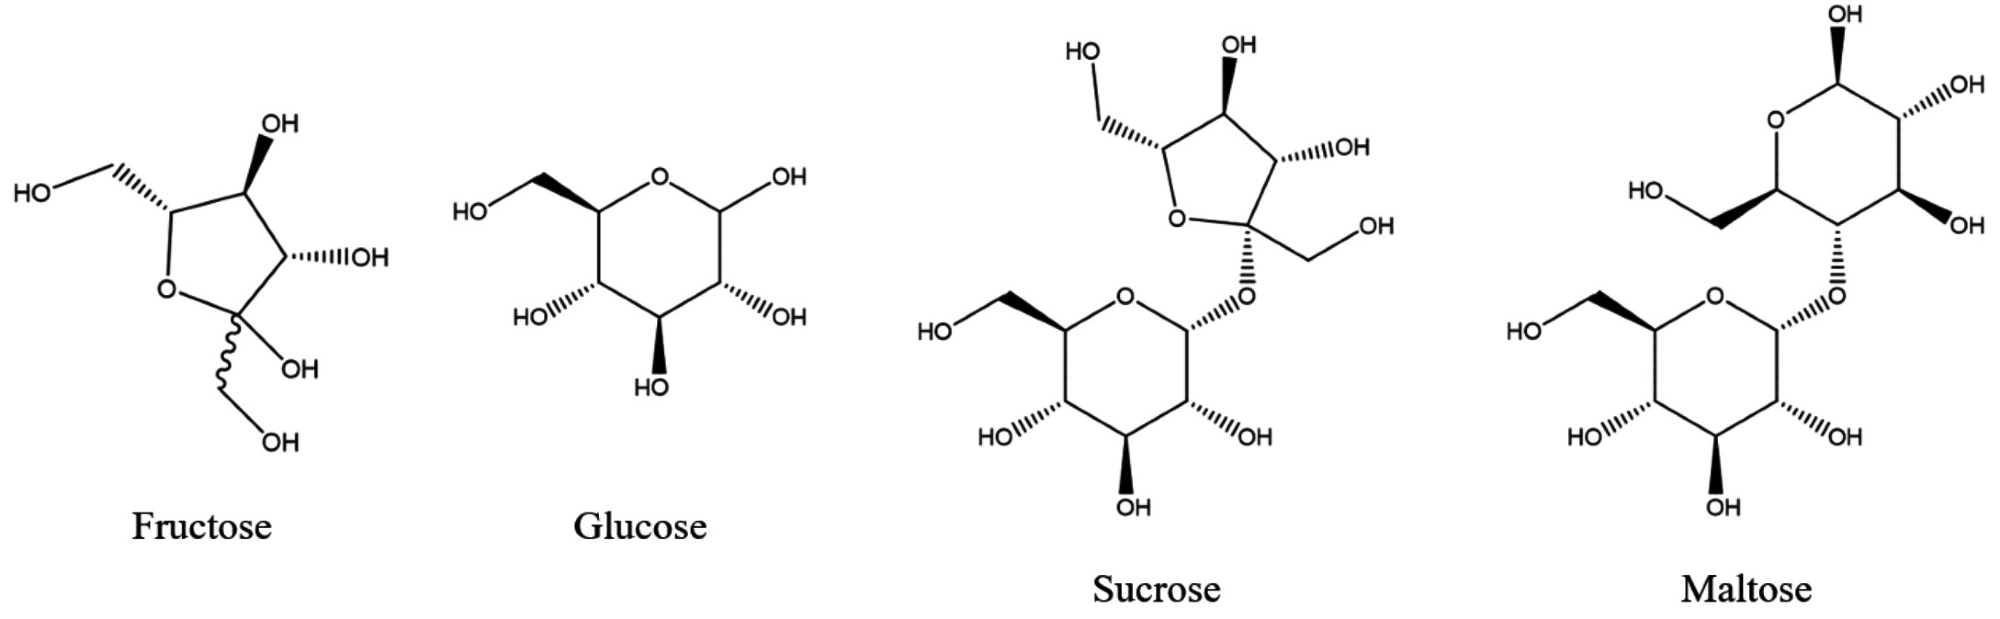
Figure 1. Chemical structures of the four sugars analyzed in this study. Image Credit: PerkinElmer Food Safety and Quality
Experimental
Hardware and Software
A PerkinElmer LC 300 HPLC system was used for chromatographic separation. This was made up of an LC 300 10K psi pump and an LC 300 autosampler fitted with an integrated column oven.
An LC 300 Refractive Index (RI) detector was used for detection, while the Simplicity™ Chrom CDS software platform was used for instrument control, analysis and data processing.
Method Parameters
Table 1 shows the relevant LC parameters.
Table 1. LC Parameters. Source: PerkinElmer Food Safety and Quality
| . |
. |
| Column |
PerkinElmer Brownlee Analytical Amino,
3 μm, 150 x 4.6 mm (Part# N9303501) |
| Mobile Phase |
Solvent A: 75:25 Acetonitrile:Water
Solvent Program: Isocratic
| Step |
Time
(min.) |
Flow Rate
(mL/min.) |
%A |
%B |
| 1 |
0.00 |
1.5 |
100 |
0 |
| 2 |
6.00 |
1.5 |
100 |
0 |
|
| Data Collection Rate |
5 pts/sec (Hz) |
| Analysis Time |
6 min. |
| Pressure |
2100 psi/145 bar maximum |
| RI Flow Cell Temp. |
35 ºC |
| Oven Temp. |
35 ºC |
| Injection Vol. |
10 μL (Partial Loop) |
Solvents, Standards and Samples
Solvents and diluents were all HPLC grade. Standard and sample extract dilutions were prepared using 75:25 acetonitrile:water unless otherwise specified.
The four sugar standards - fructose, glucose, sucrose and maltose - were acquired from Sigma-Aldrich®, Inc. (St. Louis, MO). These were provided as powders.
A 5 mg/mL stock standard mix solution was prepared, which also served as the Level 7 calibration standard. This was done by dissolving 250 mg of each standard into a 50 mL volumetric flask. A diluent of 1:1 methanol:water was used to ensure that complete dissolution occurred.
Additional calibrants were prepared. This was done by serially diluting the standard mix to concentration levels of 2.5, 1.25, 0.625, 0.3125, 0.15625 and 0.078125 mg/mL, using mobile phase (75:25 acetonitrile:water) in order to provide a 7-level calibration set.
A spiced apple syrup was acquired from a local farmer’s market, and two different brands of Grade A Dark Amber maple syrup were acquired from a local grocery store.
Approximately 0.75 mL of syrup was pipetted into a tared 50 mL centrifuge tube to obtain an exact sample weight. A total of 25 mL of water was also added, and samples were sonicated for 25 minutes.
Samples were then filtered using 0.45 µm nylon filters (Part# 02542880) and diluted 10-fold with mobile phase. This was done prior to injecting 10 µL for analysis.
Results and Discussion
Figure 2 displays the chromatogram of the 0.625 mg/mL standard. All four sugars eluted in less than 5 minutes.
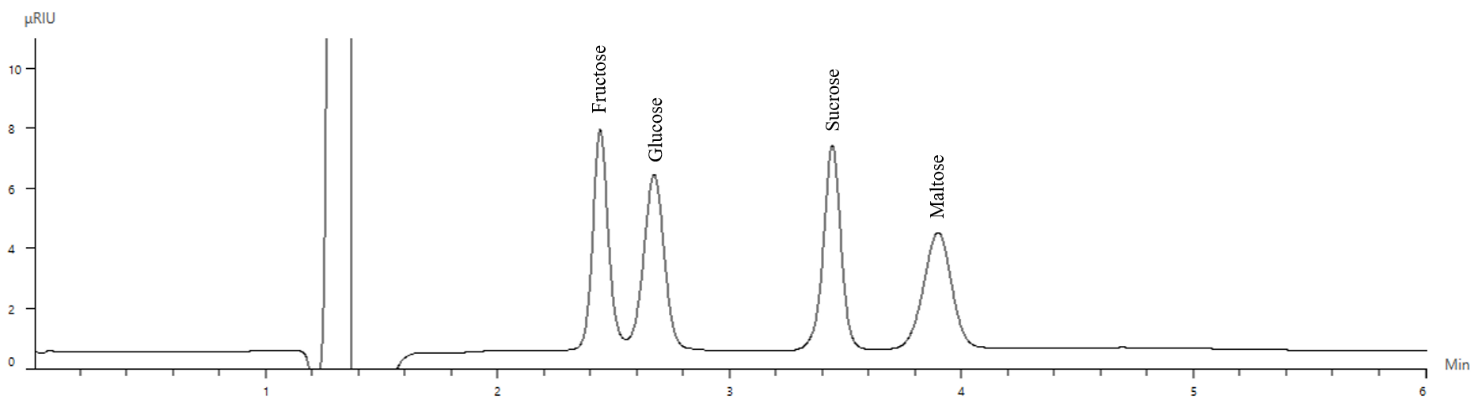
Figure 2. Chromatogram of the the 0.625-mg/mL sugar standard. Image Credit: PerkinElmer Food Safety and Quality
Figure 3 displays the overlay of 10 replicate 0.625 mg/mL sugar standard injections, all of which showed excellent reproducibility. Retention time %RSDs were found to be under 0.07%, while peak area %RSDs were found to be under 0.5% for every analyte.
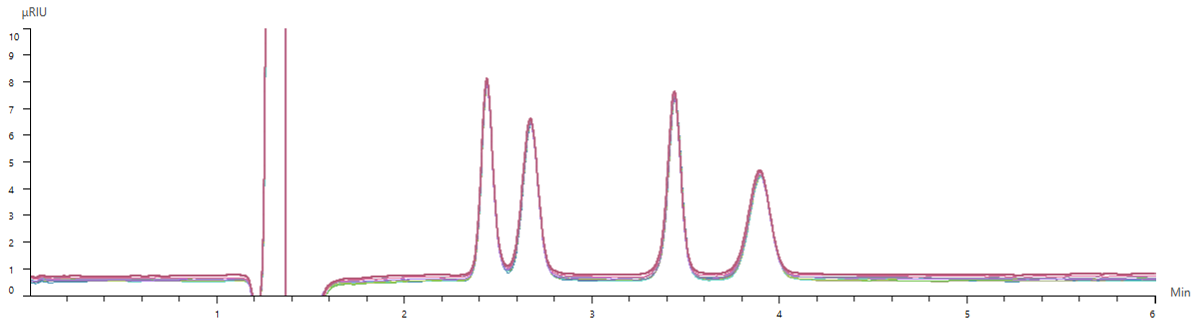
Figure 3. Chromatographic overlay of 10 replicates of the 0.625-mg/mL sugar standard. Image Credit: PerkinElmer Food Safety and Quality
Figure 4 displays calibration results for all four sugars over a concentration range of 0.078125 to 5 mg/mL. All the sugars followed a linear (1st order) fit with R2 coefficients found to be above 0.999 (n=3 at each level).
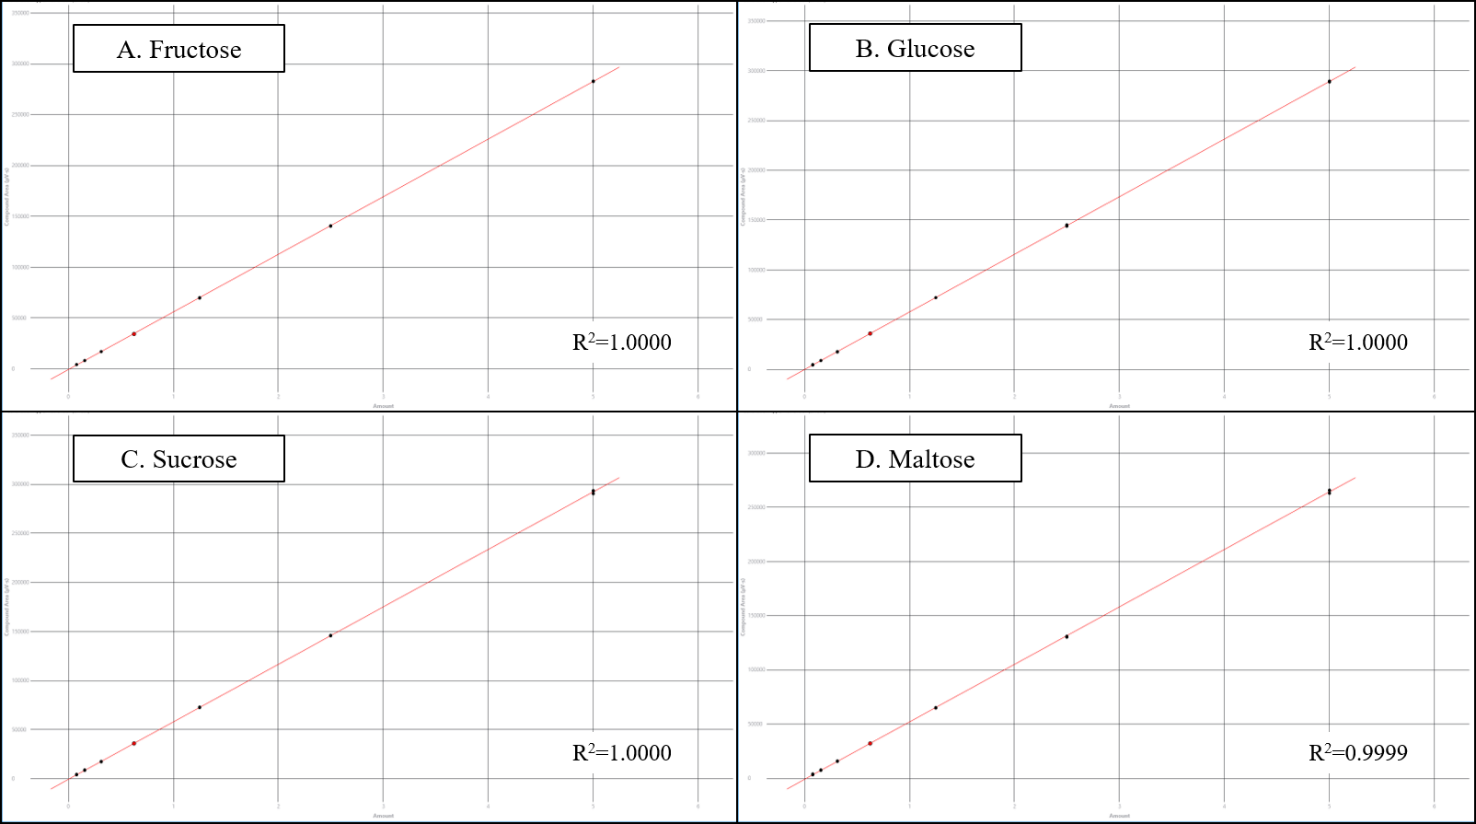
Figure 4. Results of the 7-level calibration sets for fructose, glucose, sucrose, and maltose. Image Credit: PerkinElmer Food Safety and Quality
Table 2. LODs and LOQs for the four analytes, in order of elution. Source: PerkinElmer Food Safety and Quality
| Analyte |
Calculated LOD (mg/mL) |
Calculated LOQ (mg/mL) |
| Fructose |
0.006 |
0.022 |
| Glucose |
0.039 |
0.131 |
| Sucrose |
0.015 |
0.050 |
| Maltose |
0.015 |
0.050 |
Table 2 features the limit of detection (LOD) and limit of quantitation (LOQ) for each analyte. These were calculated using each response’s standard deviation and the slope of the calibration curve for each analyte. These were also based on triplicate injections of the Level 1 standard.
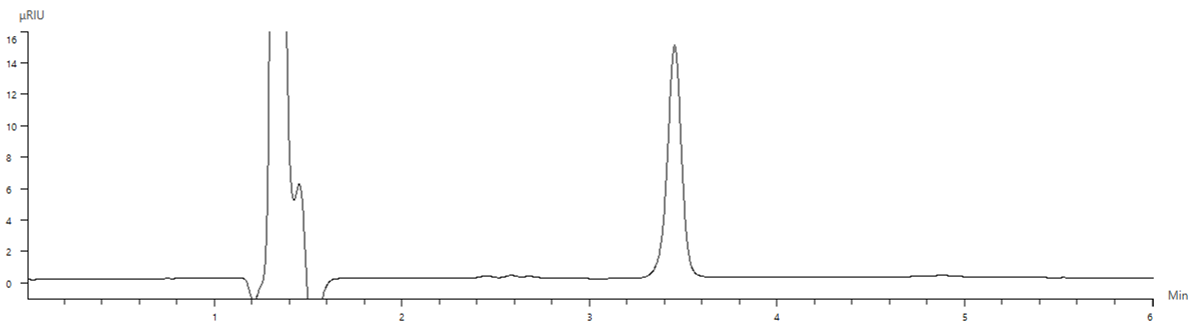
Figure 5. Chromatogram of Syrup A. Image Credit: PerkinElmer Food Safety and Quality
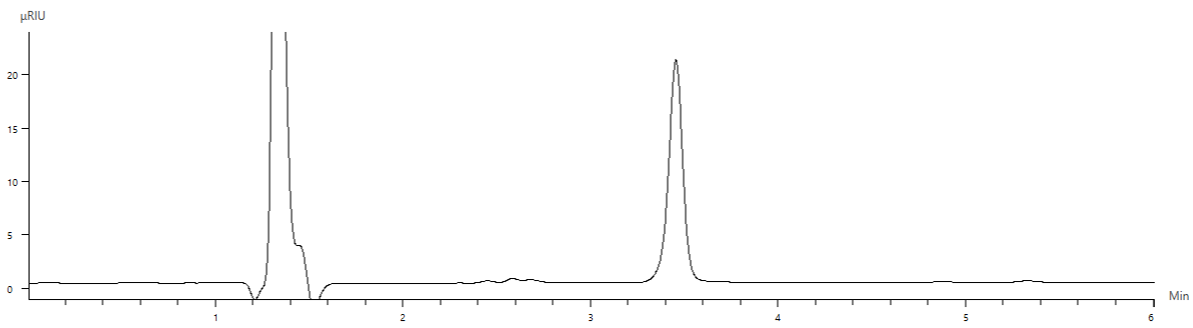
Figure 6. Chromatogram of Syrup B. Image Credit: PerkinElmer Food Safety and Quality
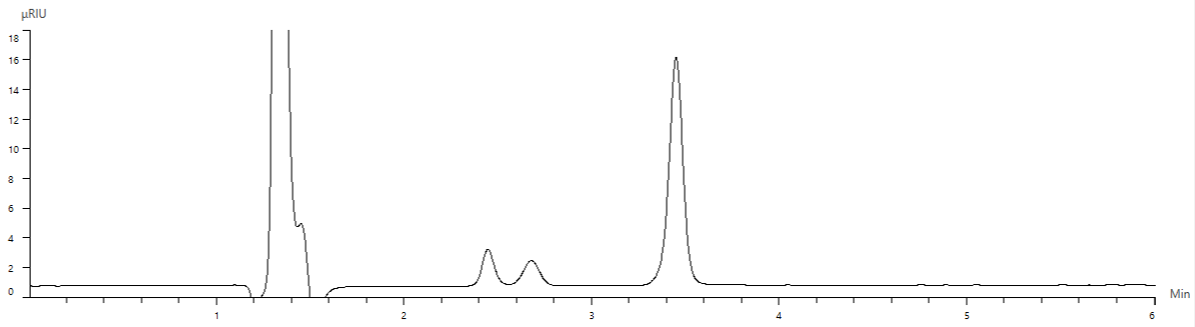
Figure 7. Chromatogram of Syrup C. Image Credit: PerkinElmer Food Safety and Quality
The three syrup samples were analyzed using the same chromatographic condition. Chromatographic results for Syrups A, B and C are displayed in Figures 5, 6 and 7, respectively.
Syrups A and B were the Grade A Dark Amber maple syrups that were specifically purchased for this study. As anticipated, the most prominent constituent is sucrose, which is shown at around 3.45 minutes.
Syrup C was the spiced apple syrup (Figure 7), highlighted by the differing chromatographic profile whereby two peaks can be seen in addition to the sucrose peak noted in Syrups A and B.
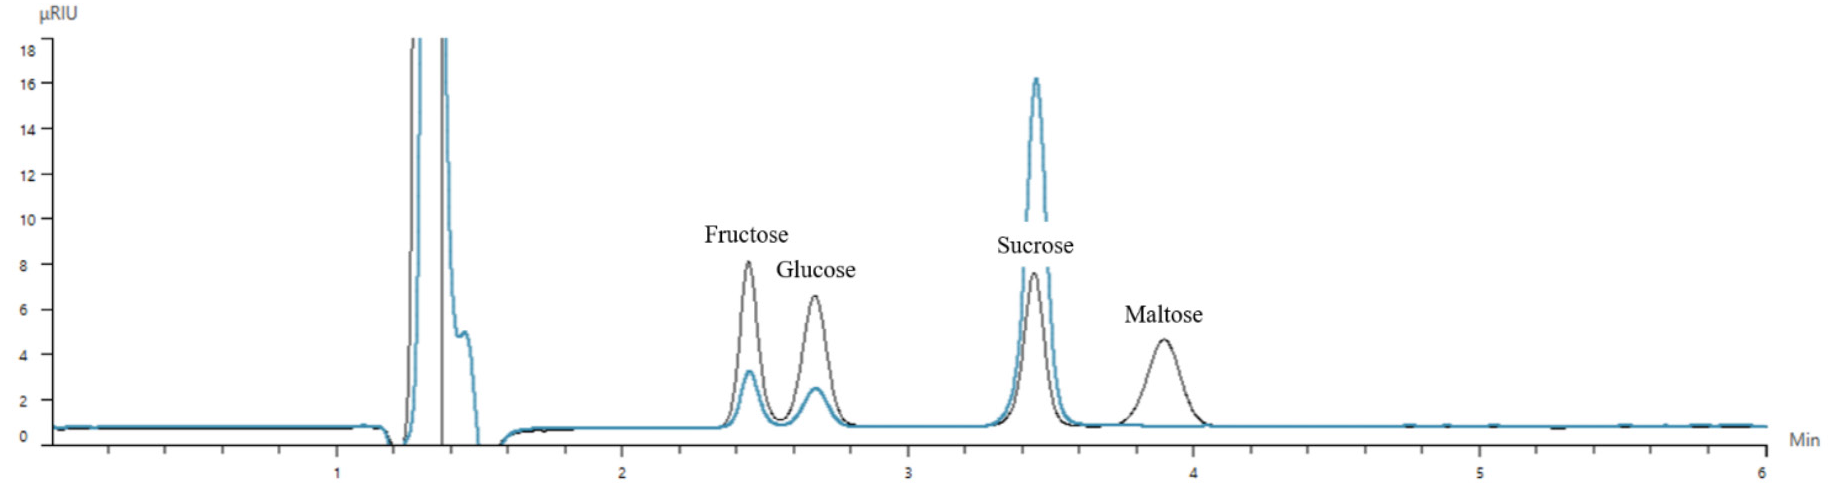
Figure 8. Overlay chromatograms of Syrup C (blue) and 0.625 mg/mL standard (black). Image Credit: PerkinElmer Food Safety and Quality
Closer inspection via a chromatographic overlay with the 0.625 mg/mL sugar standard (Figure 8) reveals that the additional peaks represent fructose and glucose.
Table 3. Amount sugar (mg) and percent sugar (w/w) for each of the three syrups analyzed. Amounts are based on the average of three injections. Source: PerkinElmer Food Safety and Quality
| SYRUP A; SAMPLE WEIGHT: 637.1 mg |
| Analyte |
Amount (mg) |
Percent Sugar (w/w) |
| Fructose |
Trace |
n/a |
| Sucrose |
Trace |
n/a |
| Glucose |
338.19 |
53.08 |
| SYRUP B; SAMPLE WEIGHT: 886.6 mg |
| Analyte |
Amount (mg) |
Percent Sugar (w/w) |
| Fructose |
Trace |
n/a |
| Sucrose |
Trace |
n/a |
| Glucose |
477.71 |
53.88 |
| SYRUP C; SAMPLE WEIGHT: 831.41 mg |
| Analyte |
Amount (mg) |
Percent Sugar (w/w) |
| Fructose |
53.46 |
6.43 |
| Sucrose |
45.95 |
5.53 |
| Glucose |
350.91 |
42.21 |
Table 3 shows quantitative results for each syrup sample. These are based on standard calibration.
Syrups A and B were found to contain a quantitative amount of sucrose, though trace amounts of glucose and fructose were also observed below the limit of detection – these were, therefore, not considered in any of the calculations.
Syrup C was found to contain far higher concentrations of glucose and fructose than Syrups A and B, likely due to the apples used in the syrup’s production.
The total percent sugar by weight for Syrup C was found to be 54.17%, close to that of the other two maple syrups based solely on the amount of sucrose present.
Conclusion
This study demonstrates a PerkinElmer LC 300 HPLC system with RI detection’s potential for the rapid and robust chromatographic separation and quantitation of four sugars.
All results exhibited excellent retention time repeatability, as well as very good linearity over the tested concentration ranges. The method offers LOQs of ≤0.1 mg/mL for almost every analyte.
This study involved sugar analysis in three different syrups - one spiced apple syrup from a local farmer’s market and two maple syrups from a local grocery store.
The method enabled the identification of specific analytes contained in each syrup sample. It also facilitated a comparison of sugar profiles, both chromatographically and quantitatively.
References
- USDA United States Standards for Grades of Maple Syrup, March 2015.
- Storz, G.; Darvill, A. G.; Albersheim, P. Characterization of polysaccharides isolated from maple syrup. Phytochemistry 1986, 25, 437−441.
- Ball, D. W. The chemical composition of maple syrup. J. Chem. Educ. 2007, 84, 1647−1650.
Acknowledgments
Produced from materials originally authored by Jamie Foss from PerkinElmer, Inc.
This information has been sourced, reviewed and adapted from materials provided by PerkinElmer Food Safety and Quality.
For more information on this source, please visit PerkinElmer Food Safety and Quality.