3D printers see frequent use in industrial applications and in-home use by hobbyists due to their ability to construct an array of three-dimensional molded objects.
The most common choice of molding method in 3D printers is the fused deposition modeling (FDM) technique. FDM involves using heat to melt a continuous resin filament before depositing this in layers.
A range of filaments for 3D printers have been developed, the majority of which are made from thermoplastic resins. Key filament materials include ABS resin, PLA resin, engineering plastics, super engineering plastics and composites created via the addition of carbon fiber or glass fiber to a thermoplastic resin.
3D printers are reliant on filament material softening when heated and hardening when cooled – this characteristic of filament materials is the cornerstone of the 3D printing process.
Differential scanning calorimetry (DSC) enables the detailed analysis of fusion and crystallization, which is extremely important in selecting material and setting of molding conditions.
User Benefits
- DSC is efficient in selecting and setting the molding conditions of diverse 3D printer filaments.
- DSC grasps the impacts of the thermal properties of the filament on the physical properties and formability of molded products.
- Differences in thermal properties, even in filaments of the same resin, can be easily confirmed by DSC.
This article outlines a study that measured the thermal properties of a number of composite filaments for 3D printers. These measurements were conducted using Shimadzu thermal analyzers.
Measurement Samples
Table 1 displays the range of composite filaments for 3D printers measured. Figure 1 displays the external appearance of sample materials 1 and 2.
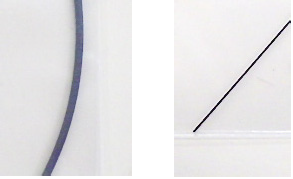
Figure 1. Appearance of Sample Materials (Left: (1) Nylon 6 + Short Fiber CFRP, Right: (2) Nylon 6 + Continuous Fiber CFRP). Image Credit: Shimadzu Scientific Instruments
Sampling and Measurement Conditions
The range of sample materials is shown in Table 1. Short fibers were cut into round slices, while continuous fibers were cut to 3 mm lengths. Following cutting, samples were placed in cells (Figure 2). Table 2 displays the measurement conditions used.
Table 1. List of Measurement Samples. Source: Shimadzu Scientific Instruments
| No. |
Sample name |
| (1) |
Nylon 6 + short fiber CFRP |
| (2) |
Nylon 6 + continuous fiber CFRP |
| (3) |
Nylon 6 + continuous fiber GFRP |
| (4) |
PEEK + short fiber CFRP |
| (5) |
PEEK + short fiber CFRP |
| (6) |
Nylon 6 + short fiber CFRP |
Table 2. Measurement Conditions. Source: Shimadzu Scientific Instruments
| . |
. |
| Instrument |
DSC-60 Plus differential scanning calorimeter |
| Heating rate |
10 ˚C/min |
| Temperature range |
0 ˚C - 245 ˚C (samples (1), (2), (3), (6))
30 ˚C - 400 ˚C (samples (4), (5)) |
| Sample weight |
10 mg |
| Atmosphere |
Nitrogen |
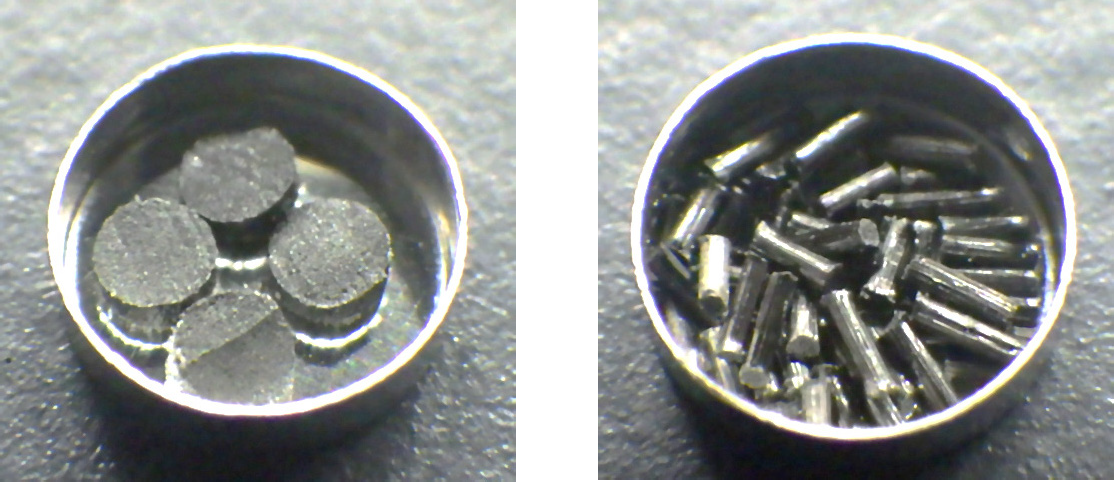
Figure 2. Sampling Conditions (Left: Short Fiber, Right: Continuous Fiber). Image Credit: Shimadzu Scientific Instruments
Measurement Results of Nylon 6 Filaments
Figure 3 displays DSC curves of samples 1, 2, 3 and 6.
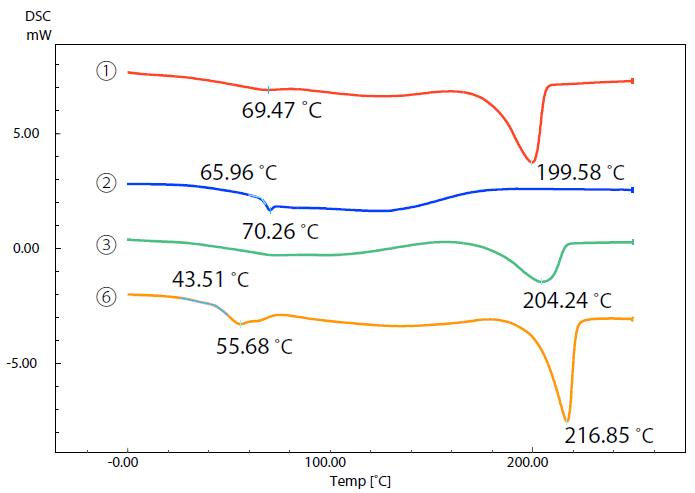
Figure 3. DSC Curves of Samples (1), (2), (3), and (6). Image Credit: Shimadzu Scientific Instruments
A comparison between DSC curves highlighted the differences in their respective thermal characteristics - samples 1, 3 and 6 exhibited significant endothermic peaks due to melting at approximately 200 ˚C to 220 ˚C.
This indicates that these samples are crystalline. Melting temperature is an index of a 3D printer’s temperature setting.
There was no endothermic peak due to melting detected in sample 2, but it was possible to note a glass transition close 66 ˚C, confirming that this material is amorphous.
The melting peak of sample 3 was found to be approximately 204 ˚C - smaller than the peaks of samples 1 and 6 as a result of the increased glass fiber content and reduced resin content in sample 3.
In addition to melting or a glass transition, every sample material exhibited what is known as ‘gradual endothermic change.’ This occurred over a wide temperature range from room temperature to 200 ˚C.
It was anticipated that this change was due to the vaporization of water, prompting the researchers to measure the weight change using a Shimadzu DTG-60 simultaneous thermogravimetry/differential thermal analyzer.
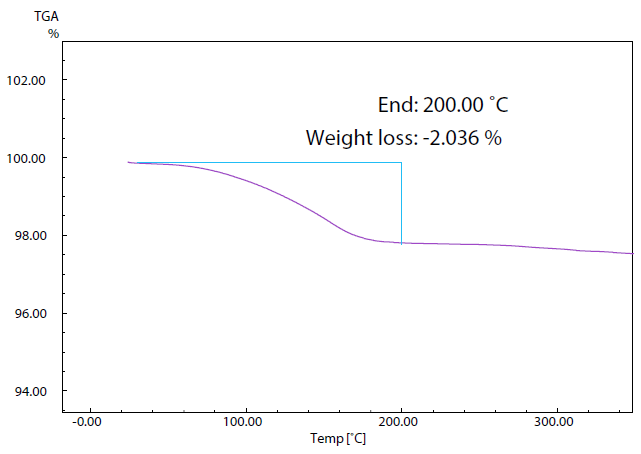
Figure 4. TG Curve of Sample (2). Image Credit: Shimadzu Scientific Instruments
Figure 4 displays the TG curve of sample 2, though the DTA curve is omitted here. Measurements revealed a weight decrease of 2.0% up to the temperature of 200 ˚C; this is considered the result of the vaporization of adsorbed water.
The tendency of Nylon 6 to readily adsorbs water in this fashion means that the material is typically dried prior to use as a 3D printer filament.
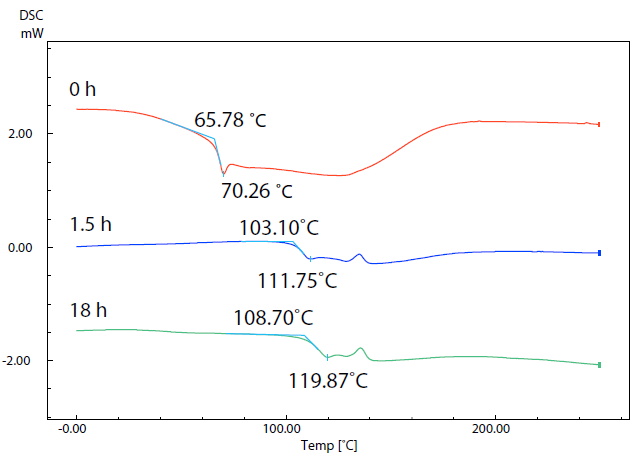
Figure 5. SC Curves of Sample (5) with Different Drying Times. Image Credit: Shimadzu Scientific Instruments
Figure 5 displays results acquired via DSC measurements of sample 2 following drying at 80 ˚C for 0 hours (start), 1.5 hours and 18 hours. The data reveals that the glass transition temperatures of the respective samples increased from 65.8 ˚C to 103.1 ˚C and then to108.7 ˚C as drying continued.
Water acts as a plasticizer, which results in the glass transition occurring at a lower temperature as water content increases. Formability is also altered depending on water content,1 highlighting the need for pre-treatment to dry the filament material.
Measurement Results of PEEK Filaments
Figure 6 features the DSC curves of samples 4 and 5. The glass transition of sample 4 can be observed at 143.1 ˚C, with melting occurring at 340.2 ˚C. The glass transition of sample 5 occurs at 146.8 ˚C.
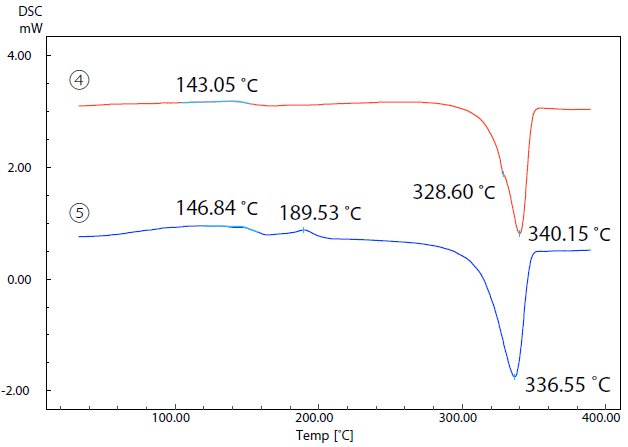
Figure 6. DSC Curves of Samples (4) and (5). Image Credit: Shimadzu Scientific Instruments
An exothermic peak due to crystallization is present at 189.5 ˚C, while an endothermic peak due to melting is present at 336.6 ˚C. These samples exhibit a difference of approximately 4 ˚C in their melting temperatures.
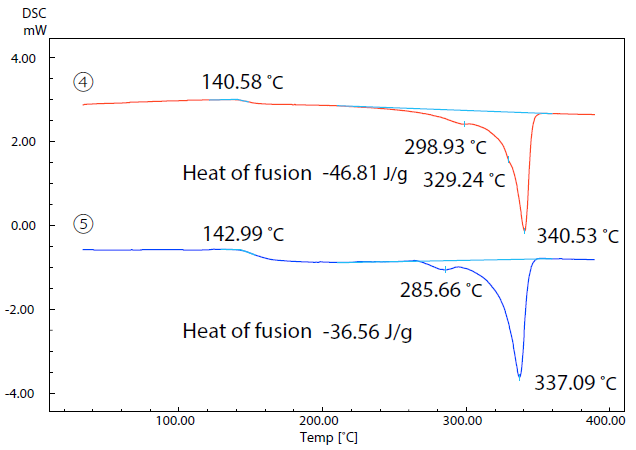
Figure 7. DSC Curves of Samples (4) and (5) in 2nd Run. Image Credit: Shimadzu Scientific Instruments
Figure 7 displays the results of a second run. In this run, the two samples were initially heated to 400 ˚C prior to being cooled to room temperature and heated once more.
The samples’ relative crystallinity was estimated via a comparison of the heat of fusion of the two sample materials.
Here, heat of fusion was calculated by dividing the amount of heat required for melting by the resin weight acquired using the DTG-60.
When molding using a 3D printer, the filament is heated and melted, extruded from the nozzle hole and deposited. It is then cooled and solidified.
If the second run of the DSC is considered equivalent to the measurement of the molded product following cooling and solidification, then the molded product of sample 4 would be considered to have higher crystallinity than the product of sample 5 due to the heat of fusion of sample 4 being larger.
These differences in crystallinity can influence the physical properties of molded products, especially their mechanical strength.
Conclusion
This article explores the use of a DSC to measure a number of composite filaments for 3D printers.
Even where filaments were comprised of the same resin, these exhibited differences in terms of their thermal properties; for example, melting temperature, glass transition temperature and heat of fusion.
These differences could potentially impact a molded product’s formability and physical properties, so it is vitally important that sufficient thermal analysis is conducted to assess the thermal properties of the filament material.
References
- N. Jia and H. A. Fraenkel, Journal of Reinforced Plastics and Composites, 23 (7), 729, (2004)
Acknowledgments
Produced from materials originally authored by A. Naganishi from Shimadzu Scientific Instruments Inc.

This information has been sourced, reviewed and adapted from materials provided by Shimadzu Scientific Instruments.
For more information on this source, please visit Shimadzu Scientific Instruments.