Advanced Driver-Assistance Systems (ADAS) enhance driving safety and comfort by monitoring the vehicle’s surroundings and providing alerts and displays to help prevent accidents. These systems employ various sensors, including wide-angle cameras, millimeter-wave radar, and ultrasonic sensors. However, these devices consume significant electrical power and generate heat, requiring efficient thermal management solutions.

Image Credit: Spyro the Dragon/Shutterstock.com
Since sensors are often mounted externally, ensuring airtight sensor housings is critical.
Resin materials are sometimes used for sensor cases to reduce weight, but they must have excellent heat resistance and minimal warping to withstand heat generated by electronic components. Therefore, evaluating the properties of the resin and its additives is essential.
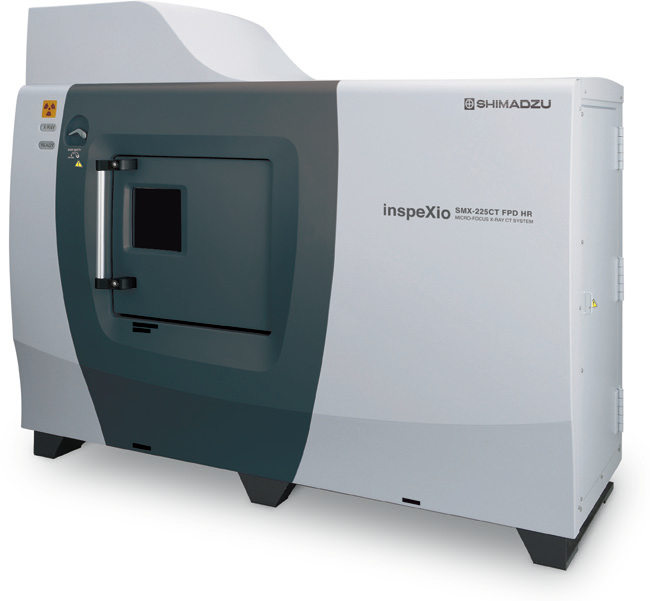
Fig. 1. Appearance of inspeXio™ SMX™-225CT FPD HR Plus Microfocus X-Ray CT System. Image Credit: Shimadzu Scientific Instruments
This article evaluates a millimeter-wave radar device used in ADAS by employing a microfocus X-ray CT system (Fig. 1) and an infrared microscope (Fig. 2).
The X-ray CT system facilitated nondestructive internal structural observation, void detection in adhesives, and measurement of the wide-angle camera’s installation angle. The infrared microscope was used for qualitative analysis of the resin material in the casing.
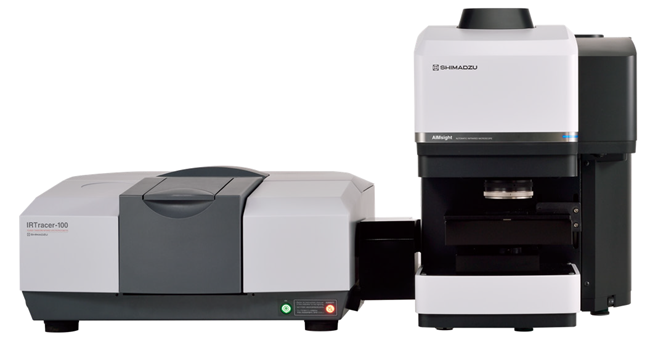
Fig. 2. Appearance of IRTracer™-100 and AIMsight™ Infrared Microscope System. Image Credit: Shimadzu Scientific Instruments
Millimeter-Wave Radar Observation and Measurement
X-ray CT systems capture transmission X-ray data from all around a sample (360°) and reconstruct 3D images via computational processing.
Internal structures can be nondestructively observed, with brighter regions indicating higher X-ray absorption and darker regions indicating lower absorption. Quantitative analyses, such as distance and volume measurements, are possible using numerical data like color and pixel information, which supports quality control, failure analysis, and competitive benchmarking.
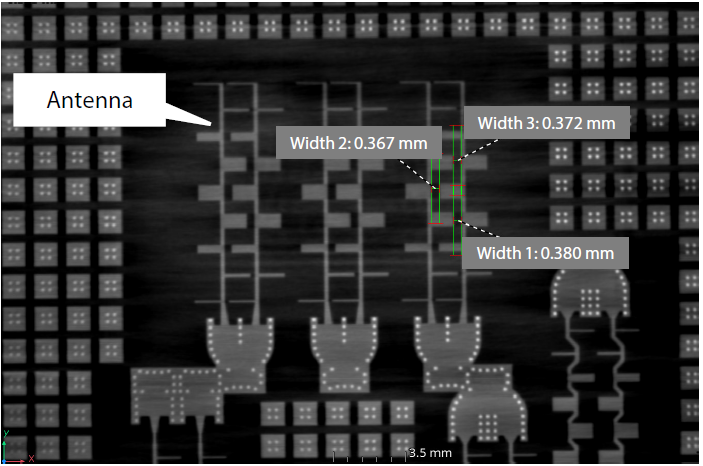
Fig. 3. Cross-Sectional Image of Antenna Part. Image Credit: Shimadzu Scientific Instruments
Figure 3 shows a cross-sectional image of the radar’s antenna with approximately 0.050 mm resolution. Measurements such as distances between antennas can be accurately performed on this image.
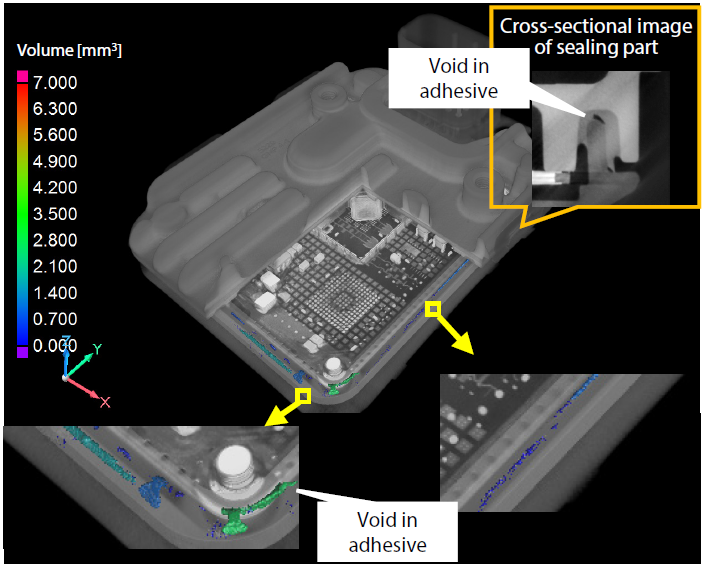
Fig. 4. 3-Dimensional Display Image in Evaluation of Void Volume in Adhesive. Image Credit: Shimadzu Scientific Instruments
As shown in Figure 4, the adhesive's void volume is displayed in color. Since the void volume of adhesives can be analyzed in this manner, the X-ray CT system can be utilized in evaluating sealing materials before and after endurance tests.
For resin material analysis, the infrared microscope was used. A resin sample from the radar was crushed using a diamond cell before measurement.
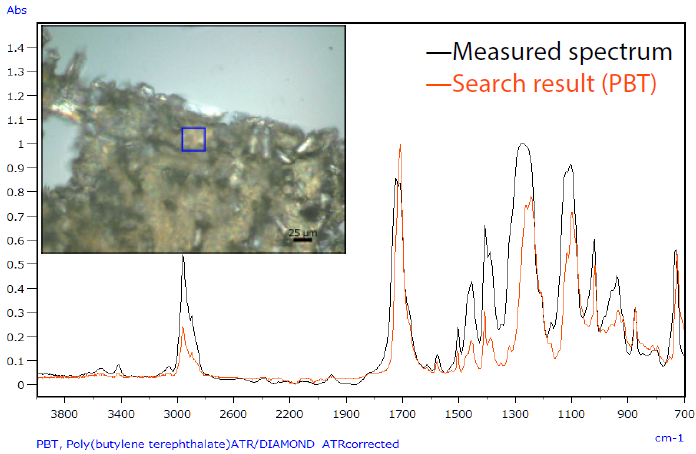
Fig. 5. Measured Spectrum of Millimeter-Wave Radar Resin Part and Search Result. Image Credit: Shimadzu Scientific Instruments
Table 1 lists the measurement parameters, and Figure 5 displays the infrared spectrum overlaid with the database search results. The resin spectrum matched polybutylene terephthalate (PBT), a thermoplastic polyester known for low shrinkage during molding, mechanical strength, and high heat resistance. PBT is suitable for radar cases as it transmits 77 GHz and 24 GHz radio waves.
Table 1. Measurement Conditions. Source: Shimadzu Scientific Instruments
| . |
. |
| Instruments |
IRTracer-100, AIMsight |
| Resolution |
8 cm-1 |
| Accumulation |
45 times |
| Apodization function |
SqrTriangle |
| Aperture size |
10 μm × 30 μm |
| Step width |
2 μm |
| Mapping range |
30 μm × 120 - 154 μm |
| Detector |
T2SL |
Transparent fibers observed in parts of the sample were also analyzed. Figure 6 shows their infrared spectrum compared with database results, confirming these fibers as glass, which are added to PBT to enhance stiffness. This demonstrates the infrared microscope’s capability to identify both resin types and additives.
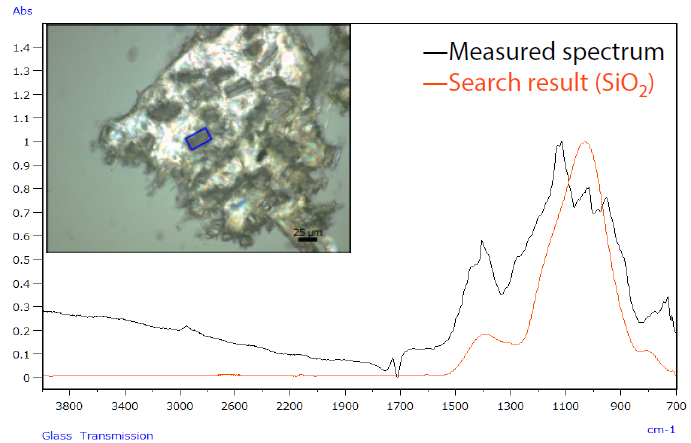
Fig. 6. Measured Spectrum of Glass Fibers in Millimeter-Wave Radar Resin and Search Result. Image Credit: Shimadzu Scientific Instruments
Automotive Camera Observation and Measurement
Cross-sectional and 3D images of an onboard automotive camera were obtained using the X-ray CT system (Fig. 7). Adhesive regions highlighted in orange (Fig. 7a) and screws (Fig. 7b) confirm the camera’s secure attachment. Installation angles of the camera lens were measured (Fig. 7c and 7d), revealing an 18° tilt relative to the case bottom and a 90° angle relative to the case side reference axis. This confirms that X-ray CT can verify internal quality during product development and manufacturing without damaging the housing.
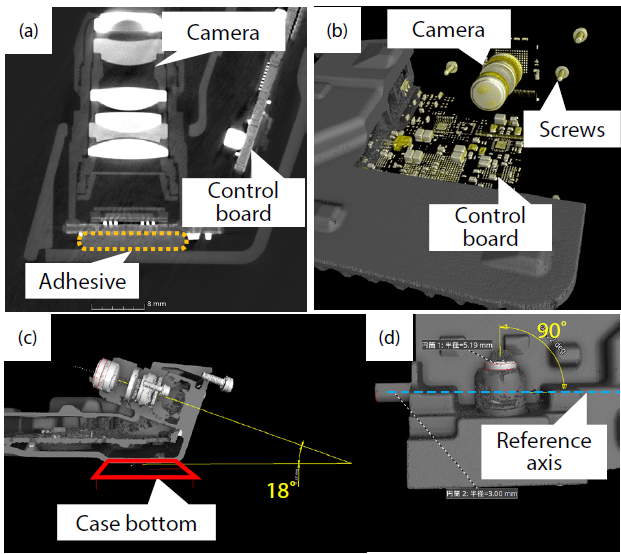
Fig. 7. Cross-Sectional Images and 3-Dimensional Display Images of Automotive Camera. Image Credit: Shimadzu Scientific Instruments
The resin part of the camera was also analyzed with the infrared microscope using the Attenuated Total Reflectance (ATR) method directly on the case. The infrared spectrum matched epoxy resin (Fig. 8), a thermosetting resin characterized by high mechanical strength, heat resistance, and water resistance.
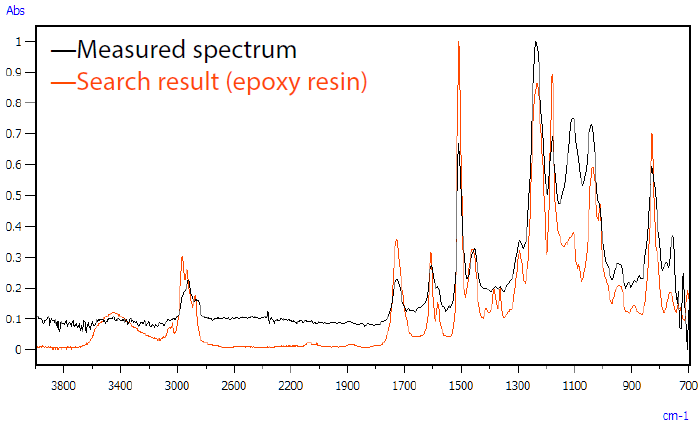
Fig. 8. Measured Spectrum of Resin Part of Automotive Camera and Search Result. Image Credit: Shimadzu Scientific Instruments
Summary
The internal configurations of a millimeter-wave radar and an automotive camera were nondestructively examined using X-ray CT, allowing detailed shape observation, dimensional measurement, void detection in sealing materials, and verification of camera lens installation angles.
Infrared microscopy enabled qualitative resin analysis, revealing different resin types used in the radar and camera components.
This information is valuable for design optimization, durability evaluation during development, quality assurance in manufacturing, and benchmarking against competitors’ products.

This information has been sourced, reviewed and adapted from materials provided by Shimadzu Scientific Instruments.
For more information on this source, please visit Shimadzu Scientific Instruments.