U-Pb dating is the frequently employed age-determination method in igneous and metamorphic rock research. U-Pb data is unique due to the long-lived nature of its target minerals and the materials’ tendency to preserve complex age domains – therefore preserving the history of important geological events.
Despite these innovations, geochronological studies routinely encounter a bottleneck when extracting and locating dateable minerals. Some samples have few, small or multiple populations of dateable phases.
This complexity results in a number of challenges when locating all the datable populations of phases, potentially leading to sampling bias that could impact the interpretation of U-Pb ages. This is particularly an issue for provenance studies.
There is a significant need to develop a means of rapidly locating phases of interest as part of routine investigations. Not only would this improve the number of datable minerals identified – but it would also create more confidence in the determined textural, chemical and deformation histories of each mineral.
The use of scanning electron microscopy (SEM) can offer higher resolution, while the addition of energy dispersive X-ray (EDS) analysis provides a robust framework for improving the productivity of analysis – two techniques that can help address this bottleneck.
Methods
This article describes a zircon and monazite dating protocol suitable for use with small minerals – 5 µm to 60 µm in size.
The protocol was developed using the Thermo Scientific™ Axia ChemiSEM, an instrument that offers a new approach to EDS analysis and provides quantitative EDS mapping and SEM imaging simultaneously.
This new protocol leverages the power of the system’s native image montage creation and unique compositional mapping capabilities, facilitating an automated method that is able to locate zircon and monazite grains within a large area of polished geological sample.
The integrated and always-on EDS makes it possible to scan a large part of the sample of interest, while quantitative elemental information provided by the Axia ChemiSEM offers the ability to localize the different zircons, monazites and titanites.
This overview is employed as a map to inform further analyses, for example, cathodoluminescence images and higher magnification EDS quantifications.
A simple, three-step workflow enables this analysis:
- Low-magnification SEM-EDS phase mapping is used in the automated acquisition of a large-scale overview. Chemical information is displayed, with the option to highlight the position of zircon, monazite and titanite by visualizing only the elements of interest (Zr, Ce, La and Ti).
- High-magnification backscattered electron (BSE) imaging and ChemiSEM phase mapping provide an overview that acts as the basis for simple point-and-click navigation towards higher magnification elemental analyses with point and ID quantifications.
- Cathodoluminescence (CL) imaging on specific minerals is performed as part of the workflow, providing additional textural information for zircon analysis – a key consideration for complex metamorphic and igneous samples, which may include multiple phases of zircon growth.
Large-scale BSE overview, higher magnification BSE imaging and ChemiSEM characterization were each acquired at 25 keV to accurately identify both Kα (at 15.7 keV) and Lα peaks (at 2.04 keV) of the Zr.
This also helped avoid misidentification with phosphorous, which exhibits a Kα peak at 2.01 keV, which overlaps with the Lα peak of Zr.
CL imaging was performed with lower acceleration voltage (10 keV) using the retractable solid-state cathodoluminescence detector. This was composed of four distinct channels: red, green, blue and panchromatic.
Each of the channels is considered a separate detector, with information acquired as four different images. The images’ RGB channels can then be combined to obtain a single image with different contributions re-colored and highlighted in red, green and blue, respectively.
The primary advantage of this workflow is its use of a combination of SEM imaging and EDS to identify an area of interest.
The X-ray collection is coupled to the SEM imaging, while the EDS signal is processed and quantified prior to being displayed. This live quantification sees the spectral peaks deconvolved, the background removed and artifacts automatically corrected, for example, peak overlaps.
This results in the generation of a live, artifact-free compositional image that can be interpreted without the need for additional post-processing.
Discussion
Figure 1 displays a typical large-scale overview (navigation montage) that has been acquired using the backscattered electron detector. This provides an overview of the compositional variations in the area analyzed.
The grayscale image highlights the location of crystals (the higher the atomic number, the brighter the object), but this is not sufficient to precisely localize the monazites and zircons.
The Axia ChemiSEM is able to deliver the same large-scale overview while overlaying chemical information on the high-resolution imagery.
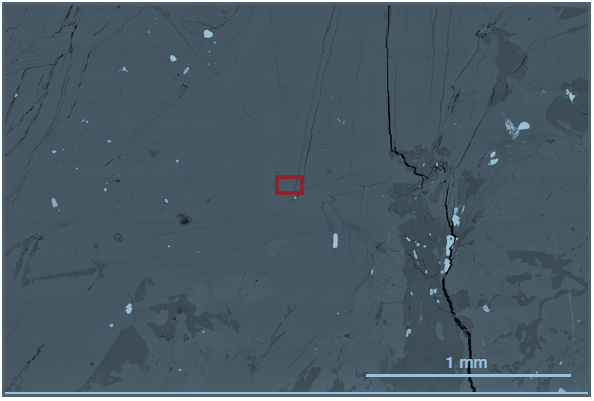
Figure 1. Large-scale overview of a 2.8 mm x 2 mm area (Acc. voltage 25 keV, beam current 15 nA). The red box shows the size of a typical SEM FOV with a magnification of approximately 1,000x. Image Credit: Thermo Fisher Scientific – Electron Microscopy Solutions
Users can, therefore, skip several steps – as Figure 1 does not contain compositional information, it would normally be necessary to select (in the dark) areas of interest, risking investing vital time on useless minerals.
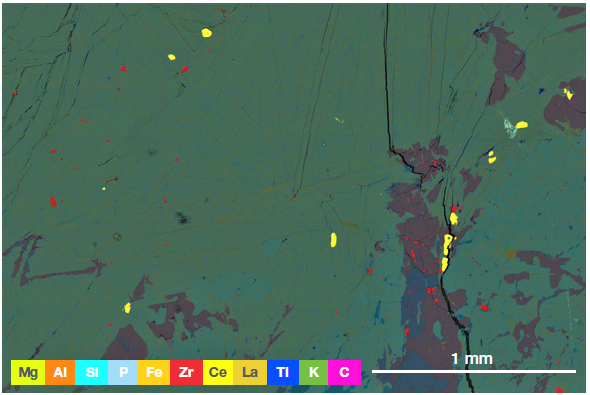
Figure 2. ChemiSEM montage with 9x9 tiles (Acc. voltage 25 keV, beam current 15 nA). Image Credit: Thermo Fisher Scientific – Electron Microscopy Solutions
The ChemiSEM map (Figure 2) adds the information needed to discriminate between the different minerals.
In the example presented here, several grains that had identical contrast in the backscattered electron image (due to possessing a similar mean atomic number) are now colored differently according to their composition.
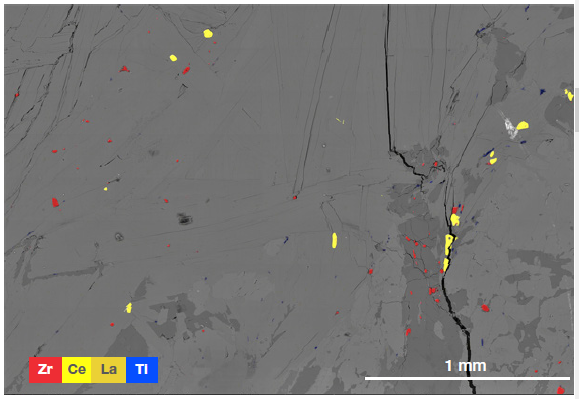
Figure 3. ChemiSEM montage showing the localization of Zr, Ce, La, and Ti. Image Credit: Thermo Fisher Scientific – Electron Microscopy Solutions
It is possible to further highlight the positions of zircons, monazites and titanites. It also hides any unwanted elements and opts to only display the elements required to identify these minerals, for example, Zr, Ce, La and Ti (Figure 3).
The montage navigation function offers a precise means of exploring the scanned area and centering a feature of interest, automatically driving to its stage position. The large-scale image also highlights the textural context of each individual grain of interest.
In the example presented here, different areas were selected for high-magnification characterization. Zircons at a range of sizes between 5 µm and 50 µm were further characterized via the live quantitative elemental information of the Axia ChemiSEM. This acquisition was performed simultaneously alongside the SEM image.
CL images have also been acquired. It should be noted that CL investigation of zircon is of special interest because CL provides information on the internal structure of zircon – frequently invisible to or undetectable via other imaging techniques.
CL is an essential tool in relating the textural petrogenesis to the geochronological interpretation of U-Pb data.
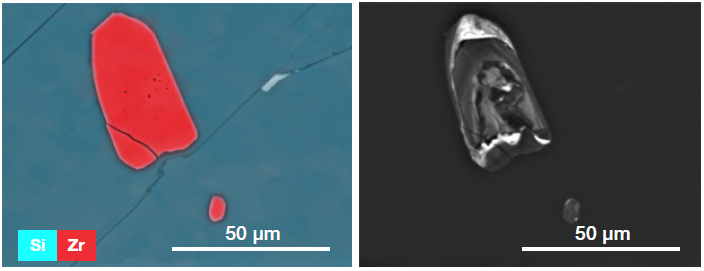
Figure 4. ChemiSEM image of zircons showing the Si and Zr distribution in the imaged area. Right image presents CL-Pan image (Acquisition parameters: ChemiSEM image acc. voltage 25 keV, CL image acc. voltage 10 keV). Image Credit: Thermo Fisher Scientific – Electron Microscopy Solutions
Figure 4 displays the results in two different areas.
One of the most common features illustrated via the CL characterization of zircons is the prevalence of growth zoning. In the example presented here, it was noted that almost all zircons observed contained complex core structures with faceted late-stage rims.
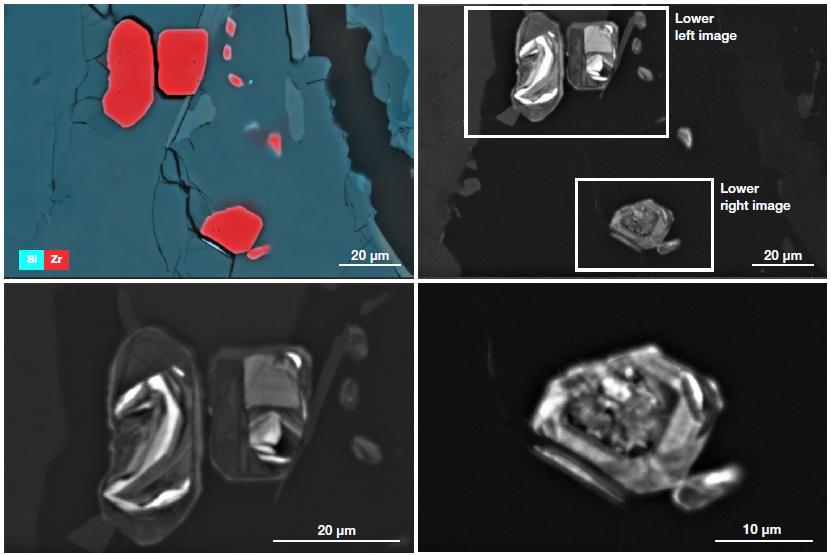
Figure 5. ChemiSEM image of zircons showing the Si and Zr distribution in the imaged area. Top right image presents CL-Pan image; bottom line images are higher magnifications of the different zircons (Acquisition parameters: ChemiSEM image acc. voltage 25 keV, CL image acc. voltage 10 keV). Image Credit: Thermo Fisher Scientific – Electron Microscopy Solutions
In a matter of minutes, the process of collecting this data has created a digital catalog of target phases, their internal structure and their textural context.
Transmitted light is typically employed when looking to distinguish zircons from monazites, but it is not easy to discriminate between them, as these often have similar optical properties. This is especially the case in samples where zircons lack clear facets.
The immediate quantitative chemical information offered by the Axia ChemiSEM provides a clear distribution of all the elements in place. This is achieved in the time taken to acquire a traditional SEM image.
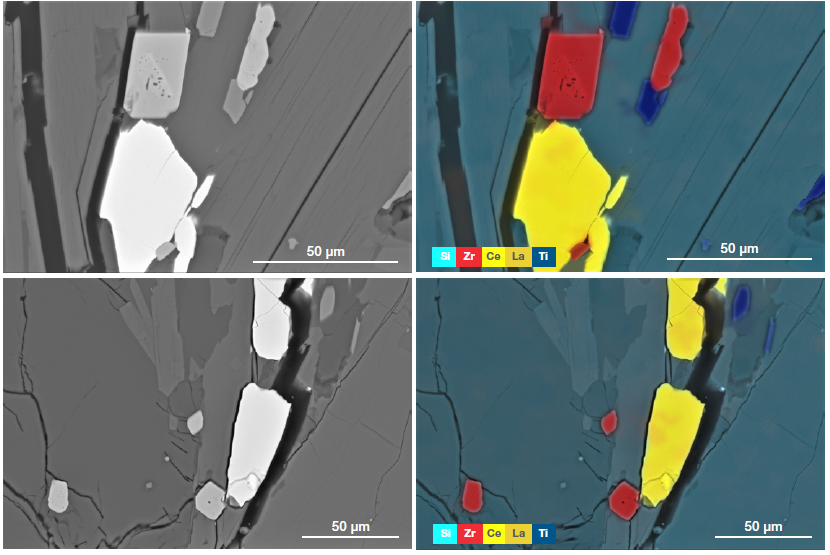
Figure 6. Left images show the BSE image and right images show the ChemiSEM image with the elements of interest ON. Elements signal from the background have been unselected (Acc. voltage 25 keV, beam current 0.26 nA). Image Credit: Thermo Fisher Scientific – Electron Microscopy Solutions
The BSE images that are presented in Figure 6 display different minerals. It is evident from the different gray levels that some of these possess different compositions.
The ChemiSEM image shows the composition and the distribution of the elements of interest, with the example highlighting the distribution of Zr and Si to show locations of zircons, the distribution of Ti for titanites and the distribution of Ce and La for monazites.
Figure 7 shows CL images acquired in both areas presented in Figure 6.
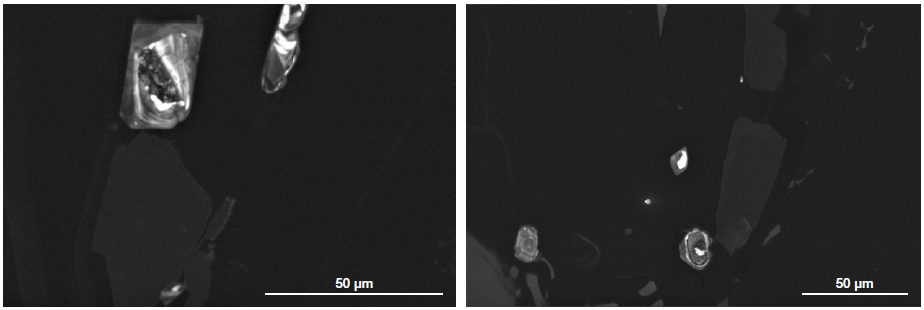
Figure 7. CL images of the areas shown in Figure 6 (Acc. voltage 10 keV, beam current 0.76 nA). Image Credit: Thermo Fisher Scientific – Electron Microscopy Solutions
Conclusion
SEM has a longstanding history of use in the location of zircons and monazites.
This activity can be laborious, however, due to the need for manual microscope operation, switching between different user interfaces for elemental identification, and the need to manually catalog each grain found that are common in traditional workflows.
This article showcased a novel workflow that is able to provide rapid access to chemical information over large areas of the thin polished section.
The workflow outlined here enabled the rapid identification of both zircon and monazite, as well the easy discrimination of titanite, apatite and other potentially datable phases.
The Axia ChemiSEM’s unique live compositional mapping capabilities offered immediate access to chemical information, saving considerable time and improving throughput compared to conventional methods.
From a practical perspective, users are able to transition easily from locating a large number of target phases directly to more detailed compositional mapping, line scans or spot analyses as required.
The Axia ChemiSEM’s easy-to-use solid-state CL detector provides the final, often hard-to-acquire information necessary for fast and accurate characterization of geological samples.

This information has been sourced, reviewed and adapted from materials provided by Thermo Fisher Scientific – Electron Microscopy Solutions.
For more information on this source, please visit Thermo Fisher Scientific – Electron Microscopy Solutions.