Malachite is a copper carbonate hydroxide mineral (Cu2(CO3) (OH)2) with an external form that is conditioned by crystals growing together into an aggregate.
It is found in a range of forms, each possessing different chemistry – chemistry that is established by a range of external factors, including environmental conditions during mineral formation.
Malachite is a secondary mineral of copper, formed when copper minerals are changed by other chemicals. During its formation, elements such as Al, Mg, Si or Fe may appear in the structure as inclusions, having been carried by leaching processes.
Tracking and characterizing the relationships between chemistry and microstructure are vital considerations when interpreting the history of secondary mineralization.
These investigations aim to comprehend the spatial chemical and textural relationships impacting the mineralization while understanding the relative timing of crystal growth.
EDS (energy dispersive X-ray spectroscopy) is a useful analytical technique that can be employed as an initial step towards a general overview of mineral phase variability. It is also useful for linking these phases with more detailed microstructural features.
These approaches are not optimized for this type of analysis, however, often being slow and requiring highly specialized knowledge to employ effectively.
This article explores the use of the Thermo Scientific™ Axia™ ChemiSEM as an efficient and rapid means of evaluating the chemical variability of minerals on a large scale.
It also highlights this system’s ability to elucidate the chemical nature of specific details.
Methods
The use of scanning electron microscopy (SEM) coupled with traditional EDS systems is limited in terms of its ability to provide chemical information on a large field of view when screening a sample of interest. This is an essential tool in deciding where to focus on for more specific characterization, however.
A traditional SEM-EDS workflow typically separates the processes of imaging the sample and elemental characterization, making the process laborious and extending the time required.
The choice of the area of interest (requiring further analysis) in traditional EDS is not guided by the chemical information, frequently leading to wasted time as users must manually search the sample for features or regions of interest.
The Axia ChemiSEM provides quantitative elemental information blended with electron images during acquisition, offering almost immediate access to quantitative compositional maps
The Axia ChemiSEM offers an entirely new means of mineral characterization. A general overview of a large-scale sample’s elemental distribution offers a clear indication of the localization and distribution of chemically unknown inclusions, providing a useful guideline for more detailed analyses.
Analysis
Since malachite formation is a secondary mineralization process, it often exhibits compositional variations on a large scale. These are highly dependent on the interaction between copper phases, water and other surrounding minerals.
In the example presented here, a large-scale overview has been acquired by combining a navigation montage and live quantitative information. This facilitates an initial understanding of the distribution of the elements and any chemical variability in the sample of interest.
As the X-ray collection takes place in the background throughout image acquisition, any compositional changes can be easily tracked across the sample. This is achieved via the creation of maps of elemental distribution on large areas of the surface.
The SEM offers navigation montage as a built-in function, enabling straightforward navigation when working with large samples. This feature automatically collects a number of neighboring images, using these to rapidly create a low magnification image that acts as a large-scale overview of the sample.
This image can be employed as a map to navigate the sample surface or as a means of centering a feature of interest and automatically moving the stage position in a single click.
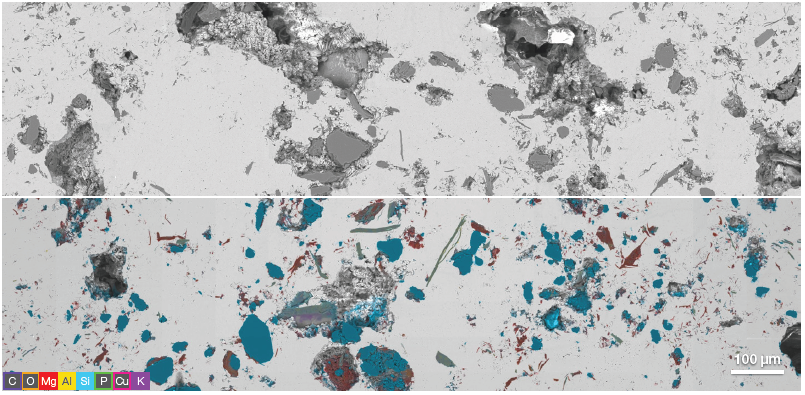
Figure 1. Large-scale overview of the sample without (top) and with (bottom) the elemental information. These montages have been acquired starting from a magnification of 1500x. 15x15 tiles have been automatically collected. Image Credit: Thermo Fisher Scientific – Electron Microscopy Solutions
The figure above displays two different navigation montages of a single sample. One montage features a traditional backscattered electron image while the other features the respective quantitative elemental map – this map also includes compositional information of the whole scanned surface.
While the traditional grayscale image includes information on the distribution, size and shape of the various inclusions along the surface, it only provides partial information on their composition.
A darker gray level in the backscattered electron image indicates the inclusions being lower in atomic number than the malachite matrix.
The acquisition of the same montage with the addition of quantitative elemental information offers a higher level of detail, allowing users to immediately correlate morphological information with chemical data and providing them with more information to help select the most appropriate area for further investigation.
Once a RoI has been selected, a more detailed characterization can be performed using a standard SEM imaging approach.
The Axia ChemiSEM offers a workflow-free approach that allows users to seamlessly acquire all the necessary information without needing to alter their approach.
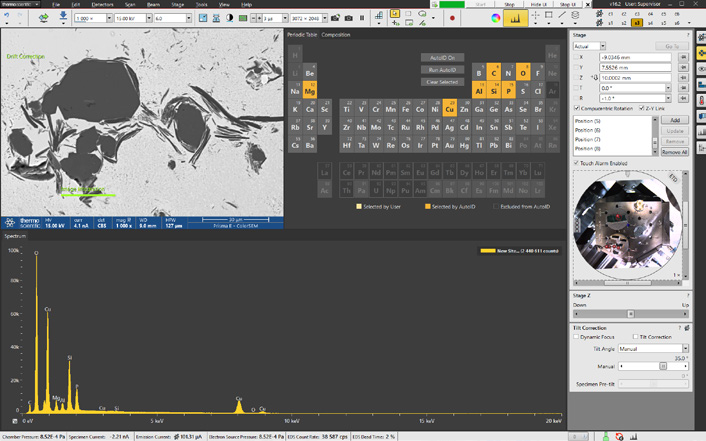
Figure 2. Axia ChemiSEM analytical layout integrated in the graphical user interface showing the acquisition of a BSE image and the spectrum related to the area acquired. Image Credit: Thermo Fisher Scientific – Electron Microscopy Solutions
Figure 2 highlights one of the first steps of a traditional SEM imaging session - the acquisition of a backscattered electron (BSE) image of the selected area.
Since Axia ChemiSEM fully integrates the EDS into the SEM graphical user interface, acquisition and processing of quantitative elemental information occur live and X-rays are continually acquired (Figure 2).
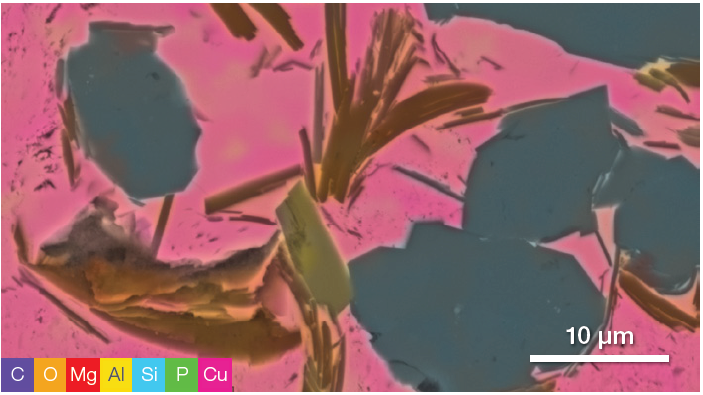
Figure 3. Quantitative elemental image of the area presented in Figure 2. Image Credit: Thermo Fisher Scientific – Electron Microscopy Solutions
An initial overview of elemental distribution can be generated by activating the quantitative elemental mapping once an image has been acquired. This will illustrate the presence of any elements in the area of interest (Figure 3).
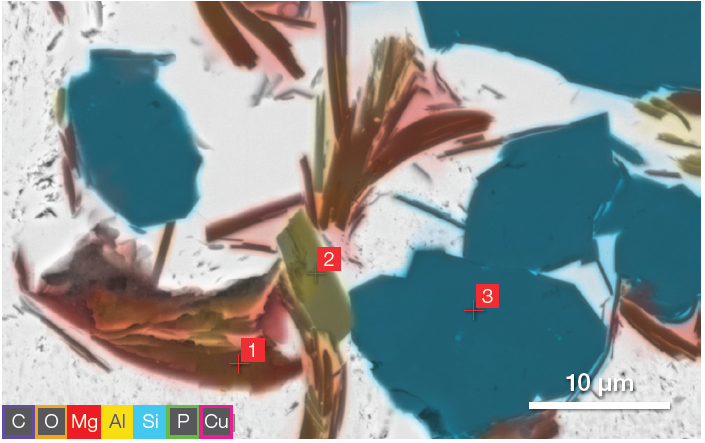
Figure 4. Image in Figure 3, with C, Cu, P and O deselected. Point analyses acquisition parameters: acc. voltage 15 keV, beam current 0.44 nA, average count rate ≈ 10 kcps, acquisition time 60 s per point. Image Credit: Thermo Fisher Scientific – Electron Microscopy Solutions
By deselecting some of the elements during this same acquisition, it is possible to highlight that the composition of the inclusions in the image is different for some objects in the RoI (Figure 4).
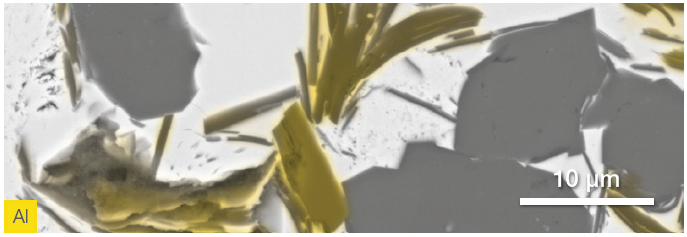
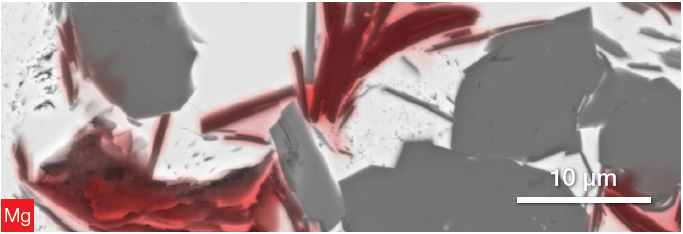
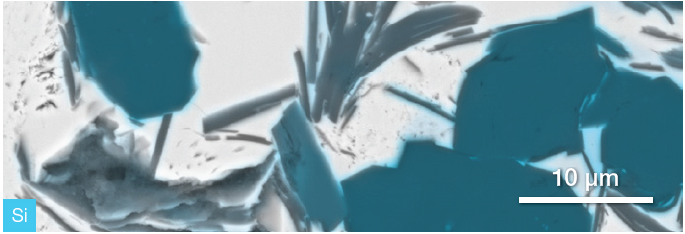
Figure 5. From top to bottom: Al, Mg and Si distribution. Image Credit: Thermo Fisher Scientific – Electron Microscopy Solutions
The set of images displayed in Figure 5 highlights at least three different phases, where not all elements found are present.
This difference would not be detected without the quantitative elemental information provided by the Axia ChemiSEM because the contrast (provided by the backscattered electron image) is not sufficient to confidently infer compositional differences within inclusions in the image with identical gray levels.
The ability to interact with these tools directly in the microscope UI allows users to focus their investigation (imaging the sample) at the center of the analysis.
Point and ID analyses were acquired by selecting the point mode analyses and selecting the point of interest (Figure 5). This enabled the comprehensive characterization of the inclusions presented in Figure 5 without the need to switch software or re-acquire the image.
The signal from each point was acquired for 60 seconds, with results shown below.
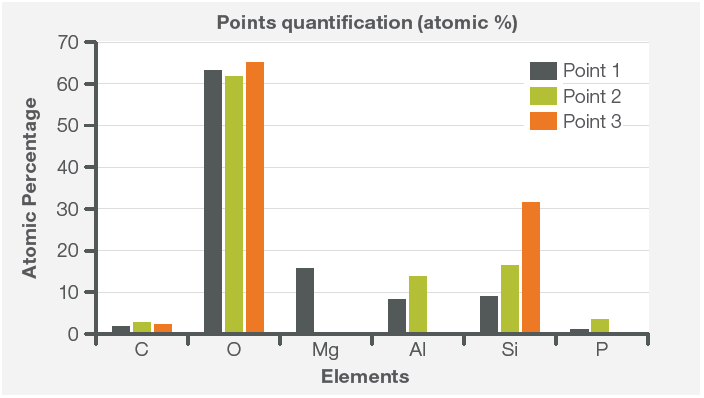
Figure 6. Quantification from the three points highlighted in Figure 4. Acquisition parameters: acc. voltage 15 keV, beam current 0.44 nA, average count rate ≈ 10 kcps, acquisition time 60 s per point. Image Credit: Thermo Fisher Scientific – Electron Microscopy Solutions
It is possible to rapidly compare the three points acquired by selecting the three spectra immediately after their acquisition. The ability to overlay the different spectra quickly offers more detailed information on the composition of the points analyzed (Figure 7).
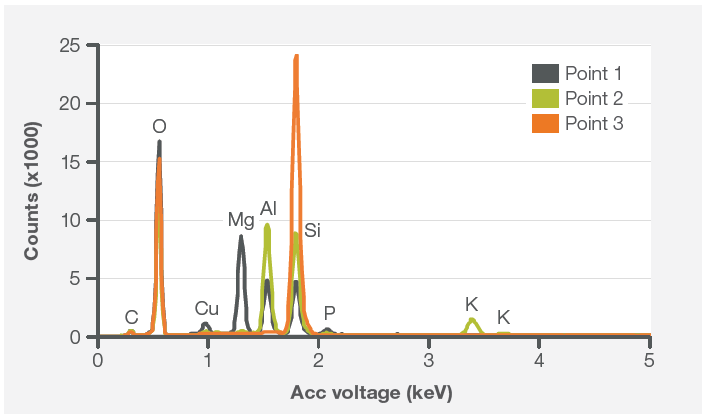
Figure 7. Spectra comparison from Point 1, Point 2, Point 3. Image Credit: Thermo Fisher Scientific – Electron Microscopy Solutions
The point and ID analyses supported the findings determined from the elemental image.
Point 1 was found to contain the highest amount of Mg, with almost 10% Al and Si. The inclusion analyzed by Point 3 seemed to be (most likely) made of silica, while the analysis of the central inclusion (the composition of this is shown in Point 2) illustrates the presence of K.
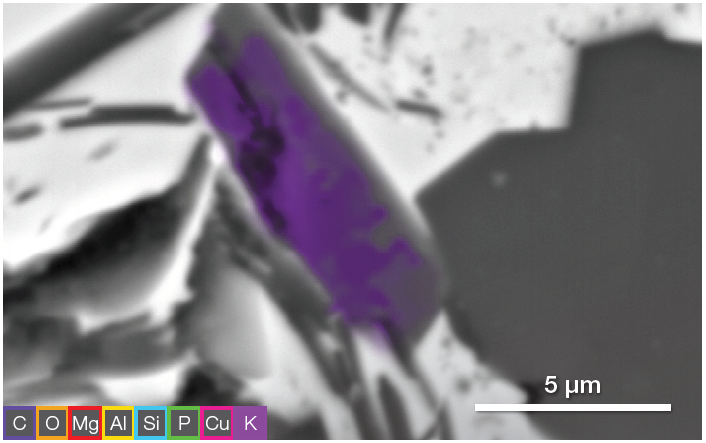
Figure 8. K quantitative map of the area of interest. Image Credit: Thermo Fisher Scientific – Electron Microscopy Solutions
Re-acquiring a quantitative elemental image and including this in the elements selected during image acquisition (Figure 8) allowed for the further clarification of potassium localization.
Conclusion
Axia ChemiSEM is able to provide an impressive amount of information surrounding any unknown inclusions in minerals such as malachite. Its robust combination of high-quality EDS mapping and wide-area imaging makes this highly suited for the investigation of chemical or textural derived processes.
Approaching this analysis as a conventional SEM imaging session enabled the analysis of a range of chemical information, including elemental distribution within inclusions of the same compositional contrast.
The analysis was completed with a relatively short time-to-data and without the need to change workflows or switch between software programs.

This information has been sourced, reviewed and adapted from materials provided by Thermo Fisher Scientific – Electron Microscopy Solutions.
For more information on this source, please visit Thermo Fisher Scientific – Electron Microscopy Solutions.