In demanding applications, structural materials can be subject to both high temperatures and high stresses at the same time. The combination of temperature and stress in metals often leads to time-dependent plastic responses or creep, which can easily result in premature failure.
Creep at temperature can be done at the microscale but is usually studied with bulk scale specimens. In-situ SEM micro-pillar compression enables the specific regions of the microstructure, like individual grains, to be targeted and permits high-resolution characterization of the deformation mechanisms.
Numerous load functions can be used to characterize the time-dependent response: creep, load relaxation or strain rate jump tests. The data from these can be utilized to fit activation volumes and energies, which show the dominant dislocation processes.
Extremely detailed deformation process maps, as a function of stress, temperature, strain rate and grain orientation, can be envisioned in this way which would help to optimize current- and next-generation materials design.
This article outlines the in-situ SEM micro-pillar compression tests of a Ni-based superalloy, IN718, at 650 °C, tested with three types of load functions that are designed to probe the time-dependent response.
These include a stress relaxation test,1 a linear quasistatic loading and a strain rate jump test.2 As the high vacuum of the SEM helps protect the material from oxidation during testing, the utilization of in-situ SEM has more synergy with the high-temperature testing.
Experimental Procedure
A Hysitron PI 89 SEM PicoIndenter equipped with a 10-micron diamond flat punch tip and 800 °C heating option was used to carry out the testing. The superalloy sample comes from the Raytheon Technologies Research Center.*
The pillars were machined into a single grain as confirmed by electron backscatter diffraction (EBSD) and were fabricated via a focused ion beam.
The sample mounted on the heating stage is demonstrated in Figure 1, together with the locations of the three test pillars and their load functions. These pillars were around 5 microns in diameter and 10 microns tall.
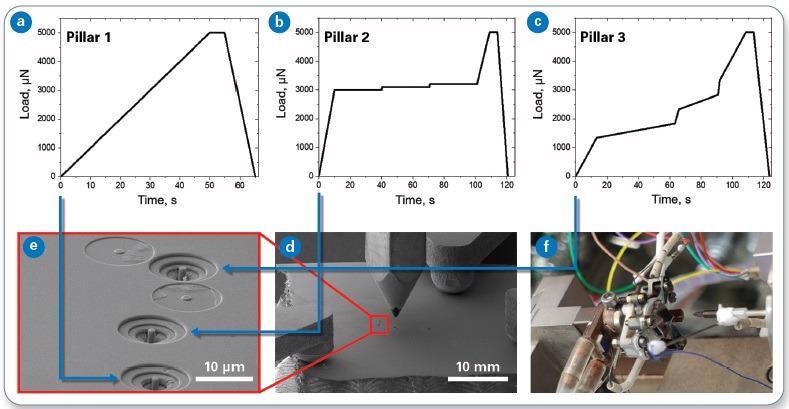
Figure 1. Overview of the experiments: (a-c) three different load functions are applied to (d) each of three pillars, with the sample clamped to the sample heater shown in (e) and (f). Image Credit: Bruker Nano Surfaces
The tip and sample were heated at a rate of 30 °C per minute to 650 °C. The load function for each pillar is shown alongside the results.
Strain and stress calculations were performed by utilizing the Tribo iQ analysis application, which can also produce side-by-side stress-strain videos with the SEM videos. To compensate for the pillar pushing into the substrate, a Sneddon correction was also applied.
Results and Discussion
Figure 2 shows the results for Pillar 1, which was subjected to linear quasistatic loading. Loading time is set with a 5-second hold, and 10-second unload at 50 seconds with a rate of 100 nanometers per second.
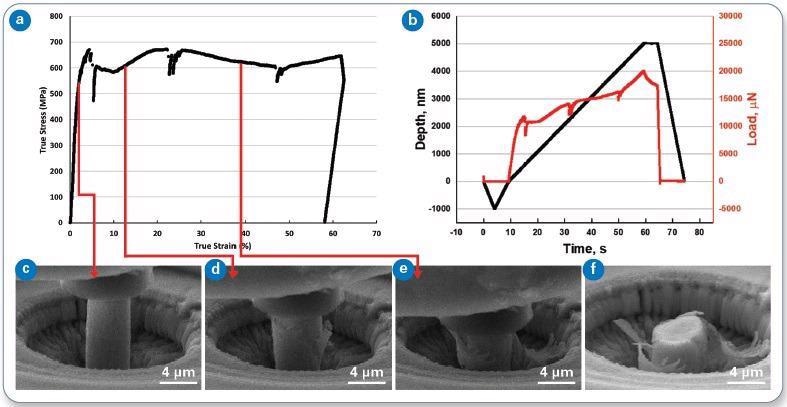
Figure 2. (a) True stress versus true strain, and (b) load and displacement versus time for Pillar 1. Frames from the in-situ video are also shown (c-f). This pillar was subjected to a linear quasistatic loading under displacement control. Image Credit: Bruker Nano Surfaces
As demonstrated, even with the protective environment of the SEM vacuum, oxide is flaking off the outside of the pillar during the test. The presence of oxide can change the image forces acting on dislocations and may supply some confining stress.
The stress-strain response is characteristic of a metal, with a linear elastic slope up to the yield point, where the load-displacement curve curls over.
Sporadic large load drops occurred after the yield point, which were correlated to the formation of slip steps on the surface with little to no strain hardening. The slip looks to be multi-slip based upon the post-test image.
The results from Pillar 2 can be seen in Figure 3. This was subjected to three load relaxations, which were carried out well into the plastic regime. Three separate load relaxations of 30-second duration were used, beginning at 60 % of the prescribed displacement to ensure they occurred in the plastic regime.
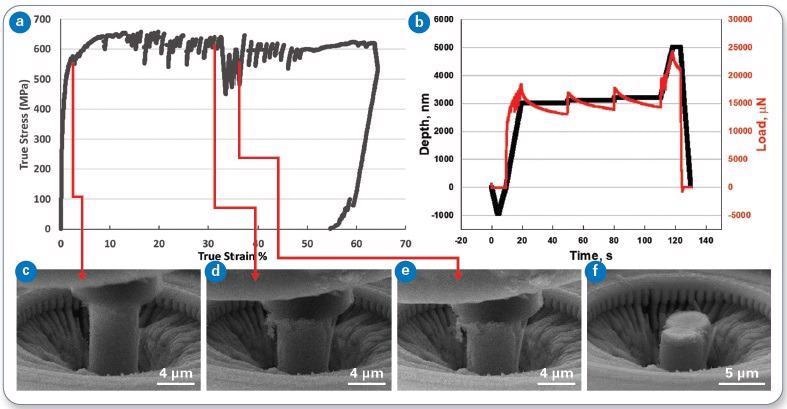
Figure 3. (a) True stress versus true stain, and (b) load and displacement versus time for Pillar 2. Frames from the in-situ video are also shown (c-f). This pillar was subjected to three load relaxation holds, where the displacement was held constant in displacement control after plasticity was induced. Image Credit: Bruker Nano Surfaces
A small amount of reloading is needed between cycles due to relaxation, and this was set to 100 nanometers. Although the overall stress-strain response was similar to that of Pillar 1, the load relaxations demonstrate some details of the time-dependent plastic response in the pillar.
Thermal energy supplies a further mechanism for dislocations to maneuver around any unspecified obstacles by cross-slip or climb at elevated temperatures.
Each load relaxation event looks to have a slightly lower slope than the one before; this is expected because of the constantly decreasing density of stored dislocations versus time.
The relaxation rate is slightly higher than the endpoint of the cycle before, initially upon reloading, demonstrating that some additional dislocations are introduced upon reload.
The results from Pillar 3 can be seen in Figure 4, and this pillar was subjected to strain rate jumps using displacement control.
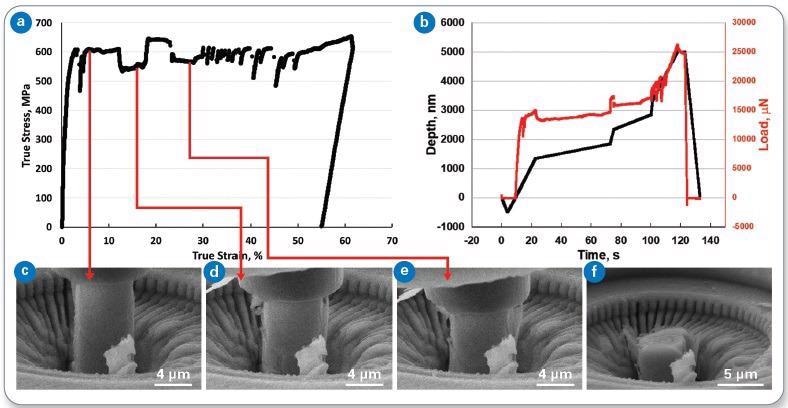
Figure 4. (a) True stress versus true strain, and (b) load and displacement versus time for Pillar 3. Frames from the in-situ video are also shown (c-f). This pillar was subjected to strain rate jump tests, consisting of 5 jumps over 1.5 orders of magnitude. Image Credit: Bruker Nano Surfaces
The strain rate jump test had five jumps covering 1.5 orders of magnitude in strain rate (strain rates of 0.007s-1, 0.0007s-1, 0.014s-1, 0.0014s-1, 0.07s-1 corresponded to displacement rates of 100 nm/s, 10 nm/s, 200 nm/s, 20 nm/s, 500 nm/s).
Again, the overall stress-strain curve is similar to Pillar 1 and Pillar 2, but the details which happen during the strain rate jumps are indicative of time-dependent plastic response. As expected, it can be seen that higher stresses are needed for higher loading rates.
In order to determine stress versus strain rate, the fit of which is related to the activation volume, the amount of stress change between each strain rate can be used.
The load-displacement response and stress strain of all three pillars are compared in Figure 5. The responses are similar, showing yield stress between 500 and 700 MPa at this temperature.
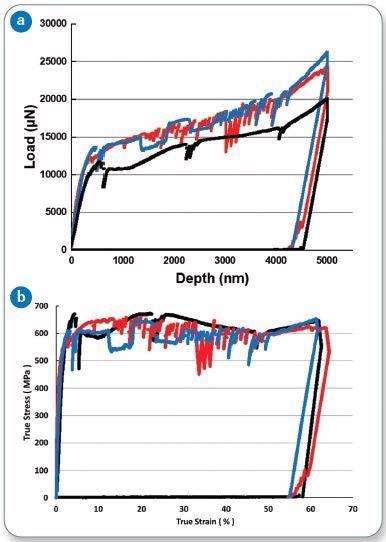
Figure 5. Comparison of (a) load-displacement and (b) true stress versus true strain curves for the three pillars. Image Credit: Bruker Nano Surfaces
Conclusions
The three types of load function were used successfully at 650 °C for each of the three superalloy pillars. Overall, the stress-strain response was similar, but the utilization of strain rate jumps on Pillar 3 and load relaxations in Pillar 2 indicate the time-dependent plastic response.
Substantial relaxation and strain rate sensitivity were seen at higher temperatures, showing prevalent thermally activated dislocation motion mechanisms.
The results also demonstrate that the Hysitron PI 89 SEM PicoIndenter is an ideal way to investigate deformation mechanisms at high resolution.
Acknowledgment
* The material from RTRC is based upon work supported by the Department of Energy under Award Number(s) DE-FE0031642.
References
- Yan, Y., Chen, W., Sumigawa, T., Wang, X., Kitamura, T. and Xuan, F.Z., 2020. A Quantitative In Situ SEM Bending Method for Stress Relaxation of Microscale Materials at Room Temperature. Experimental Mechanics, 60(7), pp.937-947.
- Snel, J., Monclús, M.A., Castillo-Rodriguez, M., Mara, N., Beyerlein, I.J., Llorca, J. and Molina-Aldareguia, J.M., 2017. Deformation mechanism map of Cu/Nb nanoscale metallic multilayers as a function of temperature and layer thickness. JOM, 69(11), pp.2214-2226.

This information has been sourced, reviewed and adapted from materials provided by Bruker Nano Surfaces.
For more information on this source, please visit Bruker Nano Surfaces.