Mining plants require various samples of the metals extracted from ore to be routinely analyzed, including the feed (crushed ore), the tails (waste ore left over after processing) and the concentrate (the final product).
Metals requiring analysis at a copper-gold mine do not just include copper (Cu) and gold (Au). Silver (Ag) is often present at significant levels, while related elements may also require measurements, such as iron (Fe) and arsenic (As).
Mining laboratories frequently employ flame atomic absorption spectrometers (AAS) to perform this analysis. Flame AAS is a robust, relatively straightforward and cost-effective technique, but this does present a number of limitations.
It tends to be relatively slow when analyzing multiple elements and exhibits a narrow linear range requiring frequent dilutions. Detection limits for some elements, such as arsenic, are also poor.
This article details the analysis of reference materials for copper, iron, silver and arsenic. The study described here employed PerkinElmer’s Avio® 220 Max hybrid simultaneous ICP-OES – an ideal solution for laboratories seeking to enhance the productivity of analyses typically undertaken using flame AAS.
The instrument’s innovative dual view plasma has been designed to facilitate the analysis of both trace and major elements within a single method, while its distinctive double-monochromator optical system with CCD detector ensures exceptional detection limits.
The Avio 220 Max ICP-OES can also be switched off entirely when not being used. This not only saves power and argon but has a start up time of only 10 minutes, meaning that this has minimal impact on throughput.
Experimental
Sample Preparation
A total of six certified reference materials (CRMs) were analyzed during this study: GBM305-4 and GBM313-3 (Geostats Pty. Ltd. Western Australia, Australia) and OREAS 501B, 502B, 503B and 504B (Ore Research & Exploration, Pty. Ltd., Victoria, Australia).
These CRMs represent typical feed ore samples encountered at a copper-gold mine. They were first digested in an SPB sample preparation block (PerkinElmer Inc, Shelton, Connecticut USA) using aqua-regia that had been made from analytical reagent-grade acids.
For each sample, a total of 0.4 g was weighed into a 50 mL polypropylene test tube. Next, 5 mL of analytical-grade nitric acid and 15 mL hydrochloric acid were added to the tube.
Each tube was gently swirled before being left to sit for a 10-minute period prior to being inserted into the sample preparation block set. This was then set to a temperature of 110 °C before being covered with polypropylene watch glass and digested for 1 hour.
The tubes were removed, and the samples were left to cool for a total of 30 minutes before diluting to the 50 mL mark with deionized (DI) water. They were then capped and shook.
No internal standard was employed in this study, though the use of an internal standard could further enhance data quality.
Calibration Standards
Calibration standards were prepared in 30% v/v hydrochloric acid to match the prepared samples’ acid content. Table 1 shows the concentrations. An undigested acid blank (i.e. nitric and hydrochloric acid) was used for the calibration blank.
Table 1. Calibration Standards (mg/L). Source: PerkinElmer
| Element |
Standard 1 |
Standard 2 |
Standard 3 |
Standard 4 |
| Silver |
0.2 |
0.4 |
0.8 |
1.2 |
| Arsenic |
10 |
20 |
30 |
40 |
| Copper |
5 |
10 |
50 |
100 |
| Iron |
50 |
100 |
150 |
200 |
Instrument and Method Parameters
Analysis was conducted using the Avio 220 Max hybrid simultaneous ICP-OES. Table 2 shows the instrument conditions used.
Table 2. Avio 220 Max ICP-OES Sample Introduction and Instrument Conditions. Source: PerkinElmer
| Parameter |
Value |
| Nebulizer |
PEEK Low-flow Gemcone |
| Spray Chamber |
Baffled Glass Cyclonic |
| Torch |
1-slot Quartz |
| Injector |
2.0 mm ID Alumina |
| Read Time |
1-2 seconds (2 replicates) |
| RF Power |
1500 watts |
| Plasma Gas Flow |
10 L/min |
| Auxiliary Gas Flow |
0.2 L/min |
| Nebulizer Gas Flow |
0.6 L/min |
There was a risk of blockages from both high levels of dissolved solids and any residual particulates in the digested samples. The study, therefore, employed a PEEK low-flow Gemcone nebulizer due to its high blockage resistance.
RF power was set to 1500 watts, while plasma gas was set to 10 L per minute, and nebulizer gas was set to 0.60 L per minute.
Reduced plasma gas flow is a key benefit of Avio Max’s patented Flat Plate™ plasma technology.
The instrument’s use of PlasmaShear™ also helps prevent the deposition of samples on the interface optic, removing the need for maintenance or cleaning on the interface region – a key capability when running ores and other high-matrix samples.
The Avio 220 Max ICP-OES’s high sensitivity meant that it was only necessary to utilize short read times of 1-2 seconds per element. Total analysis time per sample was 2 minutes, including uptake, read delay and a 30-second autosampler wash.
The Syngistix™ for ICP software was used to perform the full range of instrument control and data acquisition.
Table 3 displays the wavelengths and plasma views used.
The axial mode was selected for silver and arsenic due to its capacity to measure lower concentrations. Radial mode provides a higher linear calibration range, prompting the decision to use this mode for copper and iron.
Table 3. Wavelengths and Plasma View. Source: PerkinElmer
| Element |
Wavelength |
Plasma View |
| Silver |
Ag 328.068 |
Axial |
| Arsenic |
As 188.979 |
Axial |
| Copper |
Cu 221.459 |
Radial |
| Iron |
Fe 273.955 |
Radial |
Results and Discussion
Figure 1 displays the calibration graphs, highlighting that all wavelengths exhibited excellent linearity with correlation coefficients > 0.9999 using a linear-through-zero equation.
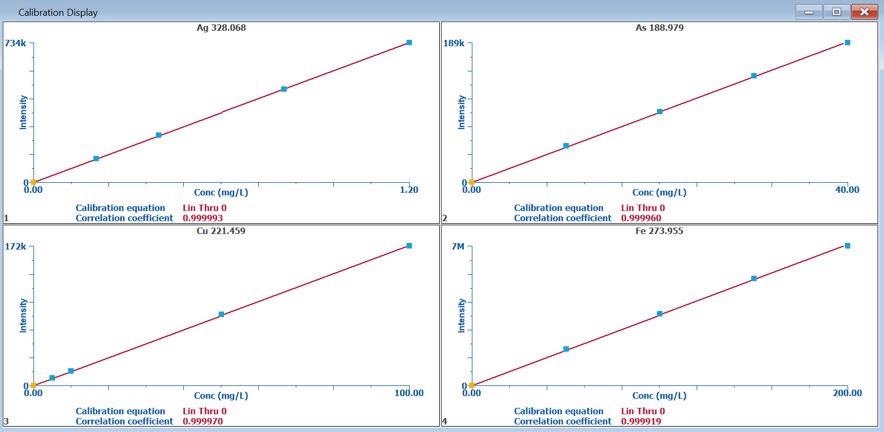
Figure 1. Calibration plots for Ag, As, Cu, Fe. Image Credit: PerkinElmer
Figure 2 displays an emission spectrum for GBM313-3. The grey bars in the figure represent the pixels on the CCD detector employed in the analyte peak measurement, while the green crosses represent background correction (BGC) points.
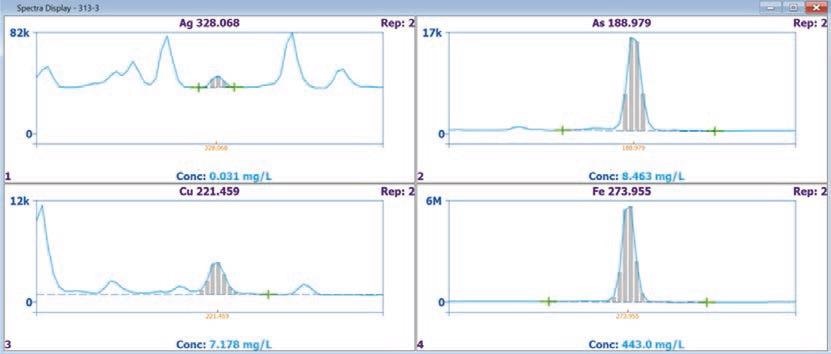
Figure 2. GBM313-3 Spectra for silver, arsenic, copper, and iron. Image Credit: PerkinElmer
The Avio 220 Max ICP-OES’s excellent sensitivity meant that it was possible to obtain a clear peak for 0.031 mg/L Ag at Ag 328.068 nm.
Silver has the potential to suffer from spectral interferences from adjacent wavelengths due to the high concentrations of iron, copper and titanium, but these elements did not interfere with silver thanks to the high resolution of the Avio 220 Max.
Figure 3 details the results from the silver, arsenic, copper and iron analysis derived from the six GBM and OREAS reference materials.
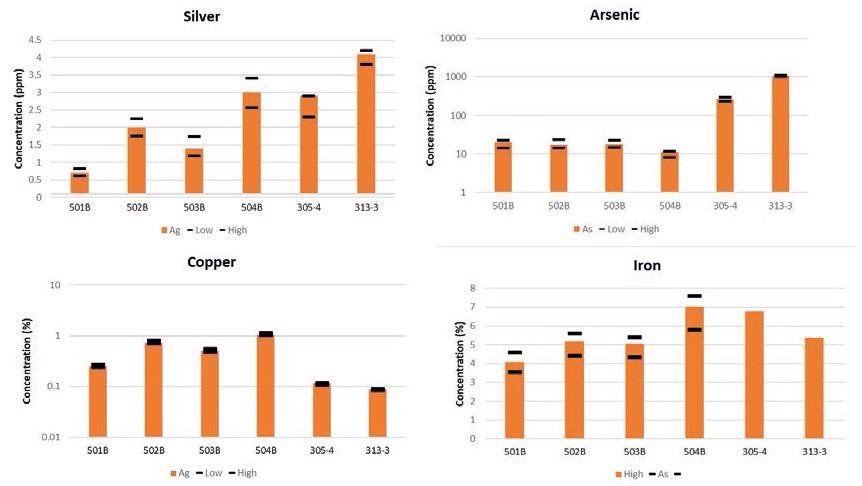
Figure 3. Silver, arsenic, copper, and iron results in certified reference materials. The black bars represent the certificate tolerance limits for each reference material. Iron was not certified in GBM 305-4 and GBM 313-3. Image Credit: PerkinElmer
All of the results were found to be comfortably within the uncertainty limits. For example, copper ranged from 0.25% to 1.05% (wt%) while results for silver were found to be between 0.7 and 4.1 ppm; this confirmed that interferences from high Fe (up to 7% in the sample) had a minimal impact on the result.
Arsenic results were also found to be within the expected limits at both the low concentrations in OREAS (10-20 ppm) and at the higher levels in the GBM samples.
It is also important for copper mines to be able to monitor any impurities linked to the production of copper concentrate. Elements such as arsenic are typically considered to be ‘penalty elements’ when refining the concentrate into pure copper.
A smelter may incur cost penalties should levels of arsenic be found to be above 1000 mg/kg arsenic. The Syngistix software provides an easy, at glance solution to determine if any elements fall outside of a user-defined range.
Figure 4 provides an example of Syngistix automatically highlighting a sample that included over 1000 mg/kg of arsenic, providing a fast visual indication that this sample may fall outside of the required specification.
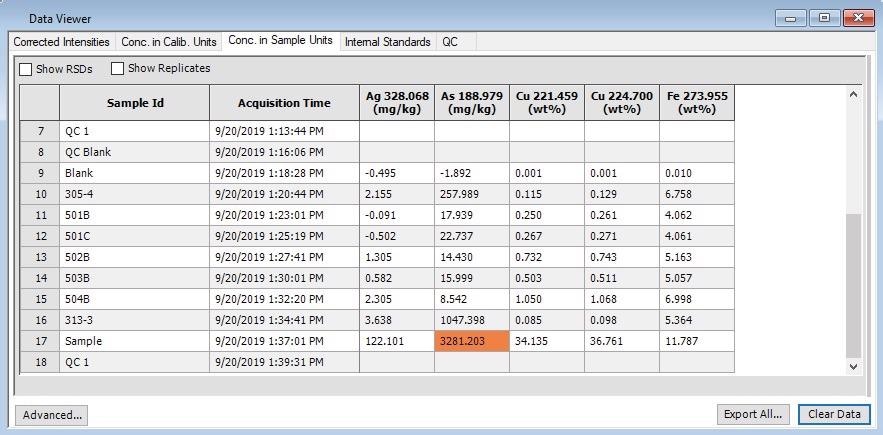
Figure 4. Data Viewer in Syngistix software, automatically highlighting a sample which contains arsenic above a user-defined limit. Image Credit: PerkinElmer
Conclusion
The study presented here has successfully illustrated the analytical-speed advantage offered by the Avio 220 Max hybrid simultaneous ICP-OES when used for multi-element analysis. This offers a number of advantages over the conventional flame AAS technique, which can only measure a single element at a time.
It is possible to measure both major and trace elements in the same method using dual view, and the instrument offers a rapid analysis time of just 2 minutes per sample for copper, iron, arsenic and silver.
The Avio 220 Max’s exceptional sensitivity makes it ideal for the accurate measurement of historically challenging elements at low levels.
The Avio 220 Max ICP-OES also boasts excellent cost-effectiveness due to its use of Flat Plate plasma technology and its capacity to switch the instrument off when it is not analyzing samples without notably impacting overall throughput. This is thanks to its best-in-class start up time of just 10 minutes from a cold start.
Consumables Used
Table 4. Source: PerkinElmer
| Component |
Part Number |
| Sample Uptake Tubing, Black/Black (0.76 mm id), PVC |
09908587 |
| Drain Tubing, Red/Red (1.14 mm id), PVC |
09908585 |
| Low-Flow GemCone Nebulizer |
N0770358 |
| Autosampler Tubes |
B0193222 (15 mL)
B0193234 (50 mL) |
| Pure-Grade Silver Standard, 1000 mg/L |
N9300171 (125 mL)
N9300151 (500 mL) |
| Pure-Grade Arsenic Standard, 1000 mg/L |
N9300180 (125 mL)
N9300102 (500 mL) |
| Pure-Grade Copper Standard, 1000 mg/L |
N9300183 (125 mL)
N9300114 (500 mL) |
| Pure-Grade Iron Standard, 1000 mg/L |
N9303171 (125 mL)
N9300126 (500 mL) |
Acknowledgments
Produced from materials originally authored by Peter Dickenson from PerkinElmer, Inc.

This information has been sourced, reviewed and adapted from materials provided by PerkinElmer.
For more information on this source, please visit PerkinElmer.