As Raman technology has advanced more challenging applications have been explored, where high fluorescence and low concentration of samples are present. Monoclonal antibodies and antibody fragments are increasingly important classes of biotherapeutics. However, these products are both challenging and expensive to manufacture.
New process analytical tools (PAT) used to monitor these products during their manufacture are of significant interest. Deep UV Raman spectroscopy promises to provide the required specificity and accuracy, however, instruments, have historically been large and complex. In this paper, a new deep UV Raman instrument (ODIN developed by ISI) is described which uses a solid-state laser and a spatial heterodyne spectrometer. The instrument overcomes the practical limitations of the technique and could readily be used for online measurements. A series of observations have been made of biopharmaceutical products, including IgG and domain antibodies, where high levels of both specificity and accuracy have been demonstrated.
Raman spectroscopy as a measurement technique shows great promise in applications in biologics production. The method is non-invasive and theoretically can be employed to measure any molecular compound while delivering high specificity and sensitivity data, as well as acquiring purity and concentration information.
Due to the weak scattering cross section of the target samples, Raman observations of these products are especially challenging at low concentrations (mg/ml). Additionally, many complex biological substances show an extremely strong fluorescence response that generally masks the Raman signature.
Several researchers have investigated deep UV resonant Raman spectroscopy (UVRRS) as a potential approach for monitoring the manufacture of biopharmaceutical products.1,2,3 Samples can be analyzed in detail because at <250 nm operation, the target Raman and fluorescence response become spectrally separated.
Furthermore, as the wavelength of the laser falls below 250 nm, it approaches the electronic transition of numerous organic molecules generating a resonant effect that can amplify the Raman signal by several orders of magnitude.4,5,6
Presently high-performance deep UV instruments utilize gas pumped lasers,4,5 which need to be water cooled and nitrogen purged. Another approach involves using a CuNe laser like the one used during the Mars perseverance mission.7
These lasers do not necessitate cooling and are comparatively compact. However, these systems are limited in their application capacity to strongly scattering or highly concentrated samples as they are pseudo pulsed instruments with a net power of 0.04 mW.
These instruments are usually paired with a high-performance dispersive spectrometer and a cooled CCD. The spectrometer is usually sensitive to environmental conditions meaning the resolution to achieve good quality Raman spectra at laser wavelengths is below 250 nm and often requires regular realignment.
This can result in the instrument needing a larger physical footprint than when being operated at longer wavelengths.1,2 The spectrometer will usually utilize a 25 µm (or less) slit to ensure the spectra is well-resolved.
To ensure the light collection in this arrangement reaches its maximum peak, the laser spot at the target should be maintained below the slit width, which also results in exposing the target sample to large power densities, that when combined with the high photon energy, can lead to sample damage.7,8
To safeguard against this risk, samples are usually repositioned throughout the duration of their measurement to mitigate any prolonged exposure of any single region of a target sample, thereby enabling successful capture of Raman spectra.
To date, challenges such as these have limited the adoption of deep UV Raman instruments to academic laboratories and extremely specific research applications, such as the Mars exploration missions.
To confront these issues, the authors have prepared a new compact deep UV Raman instrument that utilizes a diode pumped laser, a spatial heterodyne spectrometer (SHS),9 coupled with a reflective Raman collection probe.
A relatively compact form factor is maintained as a result of the diode laser, which also yields outstanding stability and performance characteristics. The SHS facilitates a large optical throughput, resulting in a comparatively large laser spot at the target, thus preventing power density induced sample damage.
The instrument has demonstrated success in the capture of the Raman spectra of a range of biochemical samples such as immunoglobulin G (IgG), tryptophan and a sequence of domain antibody (dAb) samples.
Antibody fragments (e.g., Fab, scFv, Dab, etc.) are progressively becoming an important class of protein-based biotherapeutics.
As a result of their smaller size and structure, antibody fragments have beneficial properties (e.g., easier tissue penetration) that accommodate a range of diagnostic and therapeutic applications. These products are typically high-priced, and any system that can offer data to boost their production is of interest.
The dAb samples were extracted at various stages of a pilot bioreactor manufacturing process and at varying concentrations. To the knowledge of the authors, this is the first time an observation of this kind has been made.
Instrument Development
A CAD image of the instrument (with removed enclosure) is shown in Figure 1.
The system is comprised of (a) a diode laser manufactured by TOPTICA Photonics, (b) a spatial heterodyne spectrometer and (c) a reflective Raman collection probe that interfaces optically to the sample, both manufactured by IS-Instruments. The primary instrument has a form factor of 75 × 45 × 35 cm and interfaces to the spectrometer with a fiber optic cable.
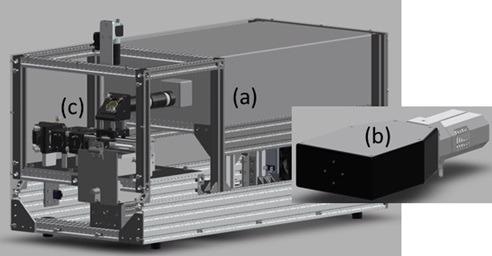
Figure 1. CAD image of full system: (a) TOPTICA laser head, (b) ISI HES spectrometer and (c) backscatter Raman collection probe. Image Credit: IS-Instruments, Ltd.
Laser
TOPTICA Photonics developed a new deep-UV laser system, operating at 228.5 nm (Figure 1B), which importantly did not require water cooling or internal gas purging, which significantly simplified operation. This laser source is based on diode-pumped solid-state laser (DPSSL) technology and was optimized for a compact footprint.
The DPSSL is utilized as a low-noise pump laser, delivering an output power of around 200 mW at the basic wavelength of 457 nm. This is frequency-converted into the deep-UV using the method of second-harmonic generation (SHG).
The required output power of > 10 mW in the UV is obtained by merging the SHG process with an optical enhancement cavity, which enables a conversion efficiency greater than 13% and a maximum UV power of 20 mW.
Optical components employed in the UV stage of the laser, specifically the non-linear crystal, are vulnerable to UV-induced degradation. Therefore the entire UV compartment is hermetically sealed to guarantee stable operation in target deployment environments.
To further enhance the lifetime, the UV compartment is fitted with an optics shifter, which can move the non-linear crystal (without manual alignment) inside the cavity and offer several operation spots on the crystal surface. With a measured spot lifetime greater than 1,000 hours, the UV laser meets industry requirements for a lifetime of >10,000 hours.
Moreover, for UV beam shaping, an optical lens system is part of the sealed compartment. This system is comprised of lenses to focus the UV beam into an optical slit, where walk-off induced features of the beam profile are inhibited, bringing about an output beam quality of M² < 1.3.
The profile of this beam profile guarantees an optically clean and small focus at the target samples. Utilizing two additional lenses, the output beam is slightly focused, so that the focus position is 0.7 m from the laser aperture and the 1/e² beam diameter is around 200 μm.
With these beam parameters, no external lens is necessary for the measurement of samples with the Raman instrument.
Sample Interface
As displayed in Figure 2, the Raman collection probe is an all-reflective device, where the laser is aimed at the sample via a turning mirror which guides the light down towards the sample. The position of the sample is shown with a red arrow in Figure 2.
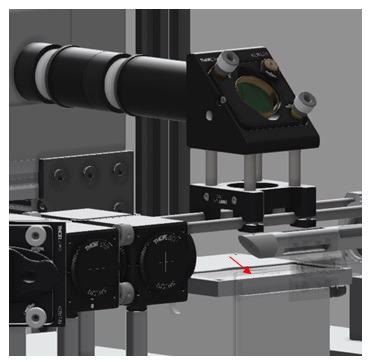
Figure 2. CAD image of the instrument – sample interface. Red arrow indicated sample position. Image Credit: IS-Instruments, Ltd.
Also displayed is the dynamic positioning stage on which the sample is fixed. This enables a scanning routine throughout the duration of the Raman measurement, which also ensures that the samples are not impaired by prolonged laser exposure, a function that is presented and described in detail in the Experimental section.
The backscattered Raman light is acquired using a 12.5 mm focal length f1:1 mirror. The light is then guided through a 229 nm long pass filter to curb extraneous laser light before a 50 mm focal length mirror with a 25 mm diameter focuses the light into a 0.91 mm diameter collection fiber.
The light is then fiber coupled into the spectrometer for extraction of the spectral information.
Spectrometer
The spatial heterodyne configuration of the spectrometer is shown in Figure 3. The design is suitable for operation in the deep UV, where power density, resolution and stability requirements are subjected to extreme rigor.
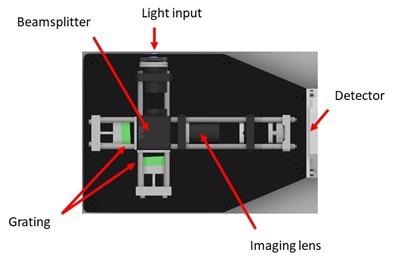
Figure 3. Spatial heterodyne spectrometer design as used by the UVRRS instrument. Image Credit: IS-Instruments, Ltd.
First developed by Harlander et al. (1992), this design was brought about to investigate diffuse stellar objects. A number of teams have since adapted the design for Raman observations at a range of excitation wavelengths.11,12,13
The instrument images an interferogram that must undergo a Fourier transform to extract the spectral information and, as such, is categorized as a static Fourier transform spectrometer.
The design offers a number of advantages; it provides a considerable etendue benefit over dispersive systems. This allows an increase of the spot at the target sample, which reduces the power density while losing no light.
The interferometer configuration facilitates high resolution acquisition with modest grating line densities without a need to increase the instrument’s footprint. The design is naturally stable in wavelength space, limiting the necessity to regularly realign the instrument.
The spectrometer was fiber attached to the Raman probe with a 0.91 mm diameter 0.22 NA optical fiber. The spectrometer does not require a slit, thereby removing a common source of optical loss. The instrument utilizes 400 lines/mm gratings, and the fringe pattern is imaged via a triplet UV lens to minimize aberrations.
Using a cooled Andor iDUS CCD camera, the fringe pattern was subsequently imaged – the detector possesses1024 × 256 pixels with a pitch of 26 µm.
Previously, Lamsal14 exhibited a UV SHS instrument utilizing a split plate beam splitter to reduce any distortion as a result of plate flatness. However, this expands the distance between the gratings and other optical elements, which magnifies any movement in the grating plates due to environmental conditions.
Therefore, a tailor-made cubic beam splitter was fabricated with a flatness of λ/10 at 228.5 nm. This resulted in limited phase distortions within the optics with an overall instrument flatness better than λ/4.
Experimental
The spectrometer was calibrated using cyclohexane which exhibits a series of discreet peaks from 801 cm-1 to 1444 cm-1 as shown in Figure 4. Cyclohexane spectra was routinely acquired to confirm instrument stability was maintained.
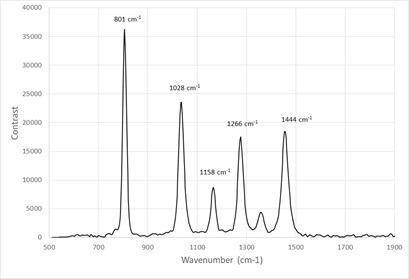
Figure 4. Raman spectrum of cyclohexane captured in 1 s. Image Credit: IS-Instruments, Ltd.
Operating in the deep UV, target samples can be subjected to very high radiant energies. This may lead to damage, which can degrade the spectra acquired as the target material degrades and is potentially damaged.
An evaluation of the IgG, which is known to be vulnerable to UV degradation, was conducted to understand this effect. This data was obtained using 30 second integration times where an average of 10 frames was used to generate the spectra presented.
IgG spectra was acquired in three different measurement conditions:
- Static; such that the same region of the sample was exposed continuously to the laser
- Rotating; with the sample rotating, tracing an approx. 15 mm circle over the sample surface
- Rotating and linearly translating as above with the addition of a 15 mm ‘to-and-fro’ linear motion to make sure no part of the sample was susceptible to extended laser exposure.
The resulting spectra is displayed in Figure 5. In the static configuration, the spectra signify that the sample has experienced a significant amount of damage, with no clear peaks being visible between 700 cm-1 and 1500 cm-1.
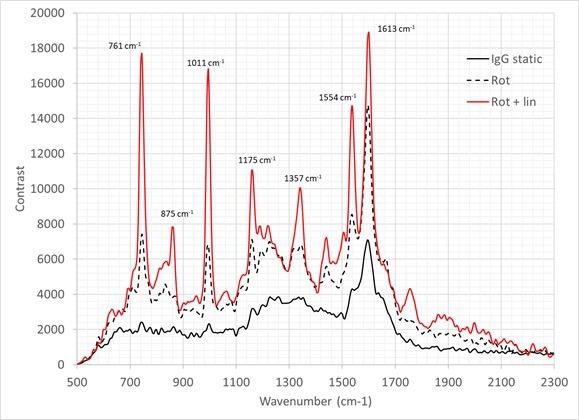
Figure 5. Raman spectra of IgG (30 second integration time, average of 10 frames). Solid black line = IgG is measured in static configuration; Dotted black line IgG measured with sample rotating during the observation; Red line IgG measured with a complex motion applied using a rotation and linear stage. Image Credit: IS-Instruments, Ltd.
The quality of the data can be improved using a rotation stage with peaks becoming prominent in this region. However, they are 2-3 times weaker than the structure observed at 1605 cm-1.
The addition of the linear transition enhances the spectral quality considerably, indicating no damage is seen within the timeframe of the measurement. This complex motion was utilized for all remaining samples described in the remainder of this study.
Additionally, a sequence of IgG dilutions in deionized water was generated. Eleven samples in total were organized from 0.1 mg/ml to 2 mg/ml: a subset of which is presented in Figure 6. All spectra is the result of 10 averaged frames, each acquired with a 30 second integration time.
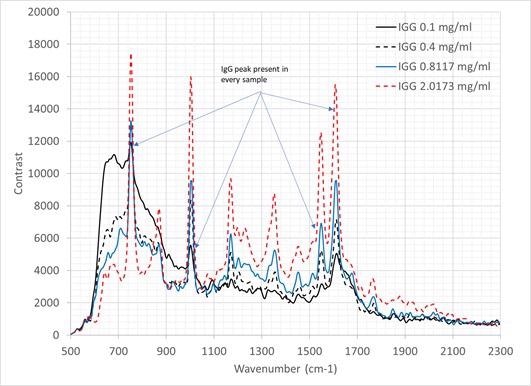
Figure 6. Raman spectra of IgG at a range of concentrations as labelled (all spectra presented are the averaged output of 10x 30 second frames. Image Credit: IS-Instruments, Ltd.
The spectra demonstrates that as the IgG concentration moves towards 0.1 mg/ml, the water spectrum demonstrates greater visibility. Extrapolation suggests a detection limit of IgG in water of 0.08 mg/ml.
Principal component analysis (PCA) or principal component regression (PCR) is a tool frequently used for analysis to extract concentration values of trace species in a given target. The spectra was analyzed further utilizing a PCR model. The objective of which was to determine the instrument’s potential for quantitative analysis.
The model utilizes a single 30-second frame of each sample spectra, where the data was divided into training and data sets using the K-folds cross-validation method. A principal component analysis was then run.
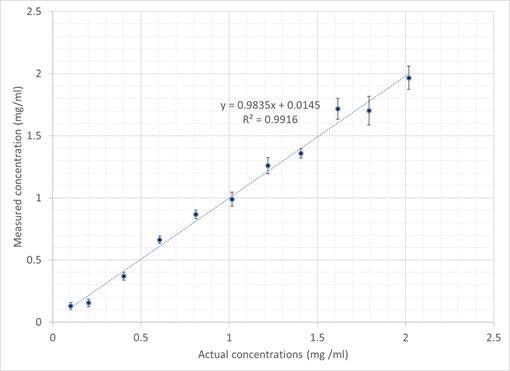
Figure 7. Plot showing IgG PCR-calculated vs. actual sample concentration. Image Credit: IS-Instruments, Ltd.
The consequent output generated the IgG concentration values as calculated. This was plotted against the true concentrations, as displayed in Figure 8.
The error bars are measured against the standard deviation of the individual frames, with accuracy levels ranging from 0.03 mg/ml for the low concentration sample to 0.1 mg/ml for the higher concentration samples. The data demonstrates an outstanding linear relationship with a regression coefficient of 0.99.
To assess the instrument’s utility further, tryptophan, the common amino acid, was evaluated. The Raman spectrum of this sample was taken by taking the average of 10 frames, each captured in a 30 second integration time as displayed in Figure 8.
The sample concentration was 1.038 mg/ ml. and the sample was rotated and linearly translated to prevent sample degradation as previously detailed.
The interferogram, generated by the spatial heterodyne spectrometer, experiences minimal processing prior to the FFT algorithm. This was made up of flat field correction to eliminate instrument aberrations and a spline fit to extract the fiber intensity profile. No spectral smoothing was applied.
Previously, Kumamoto et al.15 presented a well-resolved tryptophan Raman spectrum utilizing a 2 cm-1 resolution monochromator at 244 nm with a gas pumped laser.
The spectrum in Figure 8 compared favorably, with all peaks resolved, including the double peak at 1342 cm-1 / 1359 cm-1. However, comparatively, this spectrum was obtained in relatively short timeframes as a result of the state-of-the-art SHS technology replacing the scanning monochromator detailed in a previous study.15
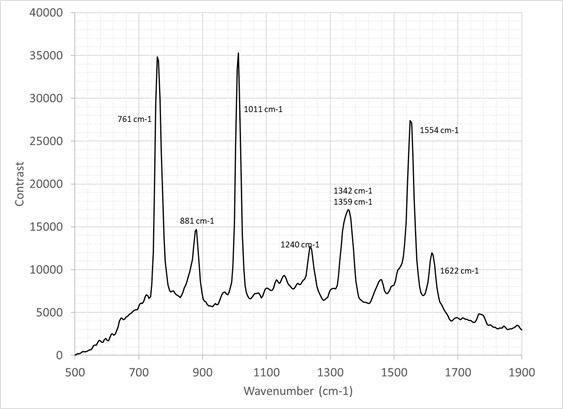
Figure 8. Raman spectrum of tryptophan. Image Credit: IS-Instruments, Ltd.
Domain Antibody (dAb) Raman Acquisition
Cytiva Life Sciences supplied a series of domain antibodies (dAb) within the TESTA challenge program16 which were also examined. The dAb pilot production facility at the TESTA center, Uppsala, was developed to demonstrate the technology and facilitate market innovation while promoting Cytiva’s products, e.g., resins, filters, bioreactors, etc.
The objective of the process is to produce and purify a domain antibody fragment, i.e., the variable region of an antibody’s kappa light chain. Antibody fragments employed in diagnostic or therapeutic applications would be made in a similar manner, although with greater rigor in the routines (GLP or GMP standard), and purify the end-product to an even higher degree.
Five samples acquired from various parts of the purification process were pulled out and stored at -20 °C for subsequent analysis with the deep UV Raman instrument. A list of the samples can be seen in table 2.
Table 2. List of dAb samples. Source: IS-Instruments, Ltd.
| |
Sample |
Description |
Comment |
| 1 |
End of Fermentation |
Sample of Supernatant at harvest
(heat treated to disrupt periplasm and release dAb) |
Crude sample with a lot of contaminants (host cell proteins and DNA, culture media components etc.) |
| 2 |
Protein L load |
Sample taken after clarification step (TFF using Hollow fiber) before chromatography capture step (protein L resin) |
Cell debris and large sized contaminants removed. Exchange of buffer. |
| 3 |
Protein L pool |
Sample from pooled fractions of protein L chromatography capture step |
Protein L is the major purification step (affinity resin) |
| 4 |
Capto MMC impres load |
Should in principle be the same as protein L pool but might be in different buffer? |
|
| 5 |
Capto MMC impres pool |
Sample after multimodal chromatography (polishing) step |
Polishing step with further removal of endotoxins and host cell proteins (named ECP in diagram below) |
Each of these samples was measured identically as corresponding to the IgG and tryptophan observations. The resultant spectra can be seen in Figure 9. Distinct differences are seen between the early-stage process samples; samples marked ‘end of fermentation’ and ‘Protein L load’ and the ensuing purification steps.
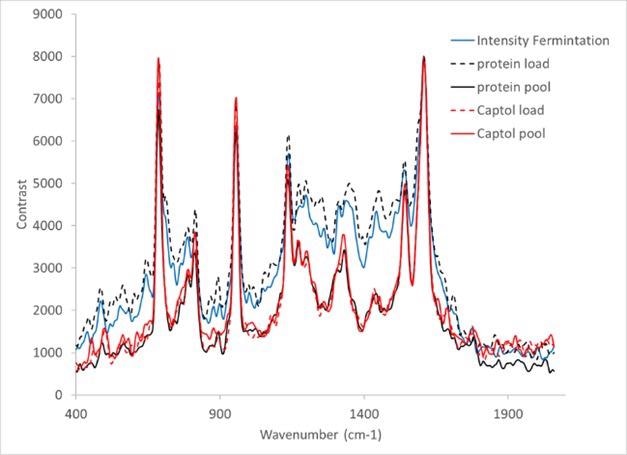
Figure 9. Raman spectra of dAb sample provided by the TESTA centre, Cytiva Life Sciences. Image Credit: IS-Instruments, Ltd.
In terms of relative peak heights across the spectrum, subtle differences can also be seen between the remaining samples. This is probably due to the various dAb concentrations within each sample.
Moreover, an additional sensitivity evaluation was carried out. A series of capto L pool dAb samples were diluted into five different concentrations, as shown in Table 3. The Raman spectra is displayed in Figure 10.
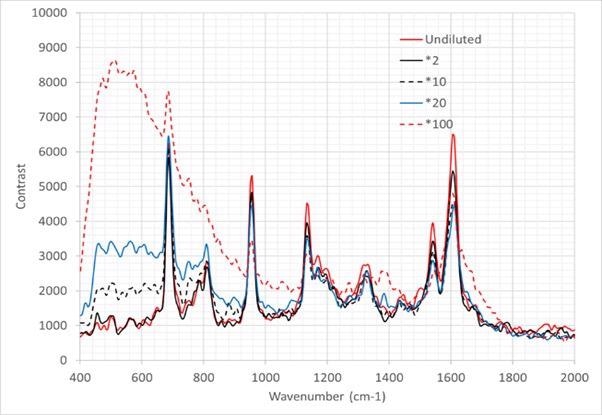
Figure 10. Raman spectra of sample dilutions presented in table 3. Image Credit: IS-Instruments, Ltd.
Table 3. dAb dilutions. Source: IS-Instruments, Ltd.
| Dilution |
dAb conc. (mg/mL) |
Sample volume (µL) |
Buffer volume (µL) |
| 100x |
~0.1 |
20 |
1980 |
| 20x |
~0.5 |
50 |
950 |
| 10x |
~1 |
100 |
900 |
| 2x |
~5 |
500 |
500 |
| 1x |
1x |
1000 |
0 |
Each of the spectra displayed is taken from an average of 10 frames, where each frame was acquired in a 30 second integration time.
In the low concentration samples, the solvent (PBS – largely water) can be seen, both at 1628cm‑1 and below 1000 cm-1, where the spectra steadily raises to the boundary of the spectral range of the instrument. As an increase in concentration is observed, not only does the water feature eliminate, but the unique dAb peaks become more distinguished.
The PCA analysis prepared for the IgG data was repeated for the dAB data. A plot that exhibits calculated vs. actual concentration is displayed in Figure 11.
Observations of linearity were once again deemed excellent with a regression coefficient of 0.989. The error bars on the individual samples are larger as a result of a small number of sample points across the range of concentration.
It can be expected that in a manufacturing facility deployment scheme, an increased number of samples could be utilized to build a calibration model and thereby boost confidence in individual measurements. Furthermore, the analysis could be improved by using the full 300-second dataset instead of relying on a single 30-second frame.
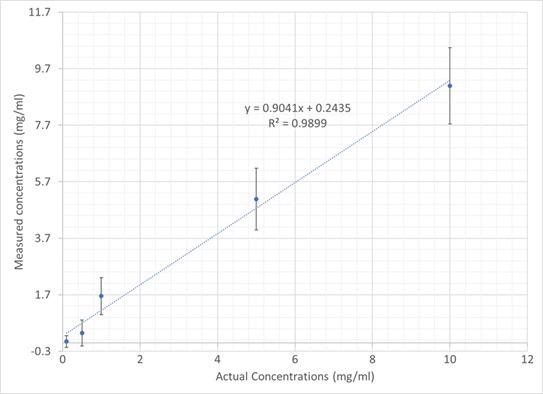
Figure 11. Plot showing dAb PCR-calculated vs actual sample concentration. Image Credit: IS-Instruments, Ltd.
Conclusions
To sum up, an innovative, compact and dependable deep UV resonant Raman instrument has been introduced. The system brings together a recently developed diode laser from TOPTICA photonics and a spatial heterodyne spectrometer.
Both have been combined for integration into a single instrument with a novel all-reflective backscatter Raman collection probe. Sample damage as a result of extended laser exposure has been limited via the introduction of a dynamic sample positioning stage.
A number of biological materials have been evaluated using the UVRRS instrument: immunoglobulin, tryptophan and domain antibodies. Each sample has produced a unique and notable Raman spectrum.
Samples of variable concentrations have also been analyzed, where superb linearity characteristics proved the utility of the instrument for quantitative analysis. A detection threshold <0.1 mg/ml for IgG was established.
A sequence of domain antibodies made by the TESTA center, a bioprocess pilot-scale technology showcase and innovation facility run by Cytiva Life Sciences, were characterized successfully.
This demonstrated the technology’s potential to monitor a biotechnology production process while determining sample concentration simultaneously. This outlines the instrument’s potential to boost production yield and significantly reduce wastage.
References
- L Ashton and R Goodarce (2011) European Pharmaceutical review Vol 16 Issue 3
- Wen, Z.-Q., Cao, X. and Vance, A. (2008). J. Pharm. Sci 97, 2229-2241
- S, I. M., I, R., Rodrigues-Mendieta, Friel, C. T., Radford,S. E. and Smith, D. A. (2006). Rev. Sci. Instrum 77,055105
- Smith, E. and Dent, G., (2005) Modern Raman Spectroscopy - A Practical Approach. John Wiley and Sons
- S. Nocentini and L. Chinsky, “In vivo studies of nucleic acid by ultraviolet resonance Raman spectroscopy on eukaryotic living cells,” J. Raman Spectrosc. 14(1), 9–10 (1983)
- Y. Yazdi, N. Ramanujam, R. Lotan, M. F. Mitchell, W. Hittelman, and R. Richards-Kortum, “Resonance Raman spectroscopy at 257 nm excitation of normal and malignant cultured breast and cervical cells,” Appl. Spectrosc. 53(1), 82–85 (1999)
- Rohit Bhartia et al. (2021) “Perseverance’s Scanning Habitable Environments with Raman and Luminescence for Organics and Chemicals (SHERLOC) Investigation” Space Science Rev 217:58
- Y. Kumamoto, A. Taguchi, N. Isaac Smith, and Satoshi Kawata “Deep UV resonant Raman spectroscopy for photodamage characterization in cells” (2011) Biomedical Optics Express Vol2 Issue 4
- M. Harz, M. Krause, T. Bartels, K. Cramer, P. Rösch, and J. Popp, “Minimal invasive gender determination of birds by means of UV-resonance Raman spectroscopy,” Anal. Chem. 80(4), 1080–1086 (2008)
- J. Harlander, R. J Reynolds and F. L. Roesler., “Spatial Heterodyne Spectrometer for the exploration of diffuse emission line a far ultraviolet wavelengths” Astro Phys Journal 396 (1992)
- J. E. Lawler, Z. E. Labby, J. M. Harlander, and F. L. Roesler, “Broadband, high-resolution spatial heterodyne spectrometer,” Appl. Opt. 47, 6371–6384 (2008)
- O. R. Dawson and W. M. Harris, “Tunable, all-reflective spatial heterodyne spectrometer for broadband spectral line studies in the visible and near-ultraviolet,” Appl. Opt. 48, 4227–4238 (2009)
- M. J. Foster, J. Storey and M. A. Zentile Optics Express 2017; 25.
- Lamsal, N., (2016) Univ. of S. Carolina, The Development of a high resolution deep-UV spatial heterodyne Raman spectrometer
- Plakhotnik, T., Reichardt, J., (2017) Accurate absolute measurements of the Raman backscattering differential cross-section of water and ice and its dependence on the temperature and excitation wavelength, Journal of Quantitative Spectroscopy and Radiative Transfer 194, 58-64
- Jolliffe, I. T. (1986). [Springer Series in Statistics] Principal Component Analysis || Principal Components in Regression Analysis. , 10.1007/978-1-4757-1904-8(Chapter 8), 129–155. doi:10.1007/978-1-4757-1904-8_8
- https://machinelearningmastery.com/k-fold-cross-validation/
- A. S. Eisenberg and L. J. Juszczak (2012) “ Correlation of TrpGly and GlyTrp Rotamer Structure with W7 and W10 UV Resonance Raman Modes and Fluorescence Emission Shifts” Journal of Amino Acids 2012 735076
- M. Blanco*, J. Coello, H. Iturriaga, S. Maspoch, M. Redon “First Principal Component Regression for Mixture Resolution in Control Analysis by UV-Visible Spectrophotometry” (1994) Applied Spectroscopy 48 Issue 1 37-43
- McLachlan, Geoffrey J.; Do, Kim-Anh; Ambroise, Christophe (2004). Analyzing microarray gene expression data. Wiley.
- R. P. Kengne-Momo, Ph. Daniel , F. Lagarde, Y. L. Jeyachandran, J. F. Pilard, M. J. Durand-Thouand, and G. Thouand (2012) “Protein Interactions Investigated by the Raman Spectroscopy for Biosensor Applications” International Journal of Spectroscopy 462901
- L Ettah and L Ashton (2018) “Engaging with Raman Spectroscopy to Investigate Antibody Aggregation” Antibodies 7(3) 24.
- Racheli Birnboim-Perach, Yehudit Grinberg, Lilach Vaks, Limor Nahary, and Itai Benhar (2019) “Production of Stabilized Antibody Fragments in the E. coli Bacterial Cytoplasm and in Transiently Transfected Mammalian Cells” Methods in Mol Biology 1904:455-490
- https://testa-challenge.confetti.events/
- Jolliffe, I. T. (1986). [Springer Series in Statistics] Principal Component Analysis || Principal Components in Regression Analysis. , 10.1007/978-1-4757-1904-8(Chapter 8), 129–155. doi:10.1007/978-1-4757-1904-8_8
- https://machinelearningmastery.com/k-fold-cross-validation/

This information has been sourced, reviewed and adapted from materials provided by IS-Instruments, Ltd.
For more information on this source, please visit IS-Instruments, Ltd.